Abstract
Aims
Quantifying the ex vivo growth of complex multi-species dental biofilms by cross-polarization 1310-nm optical coherence tomography system (CP-OCT) was investigated.
Methods and Results
Bacterial microcosms, which were derived from plaque samples of pediatric subjects, were incubated in a biofilm reactor system containing discs of different dental materials for 72 hours with daily sucrose pulsing (5x). CP-OCT analysis of biofilm mass was validated with crystal violet assays at various growth stages of these complex biofilms. CP-OCT was able to filter out the back-reflected signals of water layers in the hydrated biofilm and allowed for direct biofilm quantification. The overall depth resolved scattering intensity of the biofilm showed very strong positive correlation to crystal violet assay quantification (Spearman's ρ = 0.92) during the growth phase of the biofilm.
Conclusion
CP-OCT was able to quantify the mass of the biofilm by measuring the overall depth-resolved scattering of the biofilm.
Significance and Impact of the Study
CP-OCT has the ability to non-destructively monitor biofilm growth and elucidate the growth characteristics of these microcosms on different dental material compositions.
Keywords: dental biofilms, polarization, optical coherence tomography
INTRODUCTION
Methods are needed to longitudinally assess the dynamic growth of complex multi-species biofilms on biomaterials. This paper studies oral bacterial microcosms, which are derived directly from plaque samples at the tooth-restorative material interfaces of pediatric subjects. Conventional techniques for examining oral biofilm growth involve irreversible sample preparation prior to analysis. This paper examines Cross-Polarization Optical Coherence Tomography (CP-OCT) as an alternative method for non-destructive biofilm assessment.
Irreversible sample preparations of bacterial biofilms typically involve fixation steps, and the addition of fluorescent molecular probes, or absorptive dyes such as crystal violet (CV). The CV assay is a straightforward method to quantitatively assess the mass of biofilms; both live and dead bacteria as well as the extracellular matrix component are targeted in CV staining (Sule et al. 2009). This makes CV assay a gold standard in rapid bacterial biofilm assessment. The downside to CV assay is that the same biofilm sample cannot be monitored over time, which means that biofilm growth experiments must be done with a large number of samples that are assessed at different time points. In addition, the CV assay is not able to extract any dimensional (i.e. biofilm height) information. Fluorescence-based probes, in combination with confocal scanning laser microscopy (CSLM), have been very useful for biofilm assessment. They can be used to visualize live and dead cells in a biofilm, the percent of extracellular matrix within the biofilm, to identify cellular activity, and to visualize other specific cellular targets (Neu and Lawrence 1997). CSLM fluorescence analysis also can be used for dimensional analysis. However, although CSLM can achieve submicron lateral resolution of biofilms using specifically targeted fluorescent probes, it is not so effective at determining the full depth of biofilms greater than 150 μm thick, due to poor penetration of fluorescent dyes and the attenuation of visible wavelengths that are commonly used for excitation (Vroom et al. 1999; Paramonova et al. 2007).
There is a growing need to understand how material properties affect the growth and retention of dental biofilms in order to prevent decay at the restoration material-tooth interface. In this study, we used multi-species oral biofilm microcosms derived from sampling dental plaque from pediatric dental subjects with a history of early dental decay (caries), who are at risk of developing secondary decay at the material interface. By growing these oral biofilm microcosms rather than single-species bacteria, we are creating a laboratory model system that better replicates the intraoral environment. The overall plan in using this model system is to understand the interaction between resin composites and oral biofilms and eventually elucidate the unique process that leads to secondary caries. This system is capable of growing biofilms with depths considerably in excess of 150 μm. It is possible that dental materials with antimicrobial properties may be most effective at early stages of biofilm growth, and progressively less effective once biofilm density begins to increase. In order to be able to determine that, we sought to develop a method for quantitative comparison of biofilm depth at later stages of growth.
Several authors have attempted to visualize biofilm growth using optical coherence tomography (OCT) but have not demonstrated any quantitative methods to evaluate the biofilm (Xi et al. 2006; Haisch and Niessner 2007). Since biofilms are aggregates of bacterial cells and matrix molecules under hydrated conditions, conventional OCT is sensitive to the confounding influence of water layers within the biofilm that can produce reflections that are orders of magnitude larger than the biomass scattering. Our aim was to validate a method that uses the aggregate or integrated scattering intensity as a means to quantify biofilms. Cross Polarization-OCT (CP-OCT) is designed to minimize the specular reflection component of the OCT signal by utilizing incident polarized light and measuring the backscattering signal in the orthogonal axis. By using near infrared wavelengths (centered near 1310-nm), CP-OCT was used to non-destructively and quantitatively assess the growth of ex vivo oral microcosms.
MATERIALS AND METHODS
Ex vivo Oral Biofilm Microcosms
We developed an ex vivo model to assess the proliferation of oral biofilms on dental materials. That model system was based on the CDC Biofilm Reactor (Biosurface Technologies Corporation, Bozeman, Montana). This biofilm reactor design allows growth media to be flowed through a glass vessel, which is stirred to generate shearing forces. Surfaces for biofilm sampling are provided by removable circular discs of 12 mm diameter and 2-3 mm thick, mounted on rods which fit into the vessel. This experiment evaluated biofilm growth on discs of three different materials (n=12 each): hydroxyapatite (HA, Clarkson Chromatography), methacrylate based composite (Z100, 3M), and silorane based composite (LS, 3M). Both types of composite discs were polished to a 0.1μm finish. All discs were disinfected with 70% ethanol, and then coated with stock saliva from pediatric subjects with a history of early dental decay (caries). The material was saliva coated to recreate the salivary pellicle that facilitates bacterial colonization (Jakubovics and Kolenbrander 2010). The saliva samples used for the material coating were first diluted two-fold in a buffer that simulates the ionic composition of saliva (Gibbon's buffer), then sterilized with 0.2 μm filters, and stored at -80° C until needed. The disks were then inoculated with stock microcosm biofilms suspended in Gibbon's buffer. The stock microcosms had previously been grown in the manner described below, from fresh dental plaque sampled from the interface of composite resin restorations. The biofilms were removed, re-suspended in growth medium (see below) with 20% glycerol, and stored at -80°C until needed. Stock saliva and microcosms from two separate pediatric donors were used in two separate bioreactor experiments. The disks were then placed into the reactor vessel, which contained 350 ml of basal mucin medium (BMM) that has been widely used to grow oral microcosm biofilms. The first 24 hours of incubation were intended to allow the bacteria to establish themselves on disk surfaces under conditions of shear. Accordingly the reactor was incubated at 37° C with stirring at 125 rpm, but no media flow. After 24 hours, media flow began at a rate of 17 ml/min. That flow rate was maintained for 24 hours, and then increased to 20ml/min for another 24 hours, to facilitate the removal of planktonic bacteria. On each of those days, the reactor was pulsed with 20% sucrose five times. This was intended to simulate fermentable carbohydrate consumption analogous to three meals and two snacks, so sucrose pulsing was discontinued during the night. An initial concentration of 5% sucrose within the vessel was achieved after each pulse. At various time points (24, 32, 48, 52, 56, and 72 hours), a rod that contained discs of each of the materials was removed for CP-OCT analysis. CP-OCT imaging of the discs was done within a few minutes after their removal from the vessel with no histological preparation. The discs were kept partially hydrated during imaging. After the discs were imaged, crystal violet assays were performed as described below.
Cross-Polarization Optical Coherence Tomography
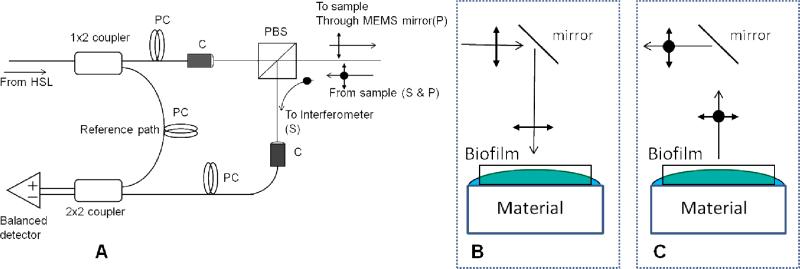
A Cross-Polarization Swept Source OCT (CP-OCT) System (IVS-200-CPM, Santec Co. Komaki, Japan) was used to image biofilm growth on hydroxyapatite and dental composite material discs (Figure 1). The portable CP-OCT system used a high swept rate (30 kHz) continuous wavelength scanning laser centered near 1310 nm with a bandwidth of 104 nm. The axial resolution for structures in the biofilm was 8.5 μm. The lateral resolution of the system was ~80 μm. However, the system had a fixed depth focus and this required using a low numeric aperture (NA) lens to maximize the depth of focus and assess the degree of scattering for thicker biofilms. The output beam from the swept source traveled in single-mode fiber and then was split to a sample and reference arm that was housed in a scanning probe. In the sample arm, the output signal traveled through a collimator system and traveled through a polarizing beam splitter. The output wave was linearly polarized in the P-polarization state. Light then traveled through a fixed focusing lens (f=60) and was reflected onto a two axis tilt Micro-Electro-Mechanical System (MEMS) scanning mirror in the body of the probe. The MEMS mirror collected two-dimensional images. The linearly polarized output beam was reflected at the probe end to illuminate (~8 mW) a material disc and, when present, the overlying biofilm. The backscattered signal from the tissue sample traveled back through the probe and the polarizing beam splitter. At this point, the S-polarization state (cross-polarization of the incident beam) was diverted to recombine with the reference signal. Interferometric concepts of swept source OCT imaging are described elsewhere (Liu and Brezinski 2007). Image analysis was performed using Matlab™.
Figure 1.
Cross-Polarization OCT. A) A Mach-Zehnder type interferometer that used a polarization beam splitter (PBS) to illuminate with linear polarized light. This part of the CP-OCT system is integrated to a two axis tilt MEMS scanning mirror and then illuminates a 90 degree mirror. B) The sample biofilm growing on a material disc in the bioreactor is illuminated with linear polarized light. The sample is kept partially hydrated to simulate the hydrated conditions in the oral cavity. C) The aqueous layers in the sample will reflect and preserve the linear polarized light (P-state). Bacterial cellular and extracellular components will partially depolarize the incident light into the cross-polarization axis (S-state). The PBS will filter out the P-state from the returning optical signal and allows the cellular and extracellular scattering to be measured.
Biofilm Assessment
Immediately following the OCT imaging of the biofilm at each of the time points, discs were re-suspended in 1.0 ml 1x PBS solution. For each time point (24, 32, 48, 52, 56, and 72 hours), six disc samples were imaged (two sample discs of the three different materials), and then resuspended. The biofilm was mechanically removed from each of the material discs using a thin rubber-like cell culture scraper (Sarstedt, USA), placed into a 1.5 ml tube, and centrifuged (9300 × g) for 5 minutes at 4°C. The supernatant was removed, and 0.5 ml of 0.1% crystal violet solution was added to each tube. The samples were incubated with shaking at 125 rpm for 15 min at room temperature. Samples were again centrifuged for 5 minutes, and rinsed twice with water. 1.0 ml of 30% acetic acid was added to each stained disc and the dye was allowed to solubilize during 15 minutes of incubation. The optical density then was measured at 600 nm (Synergy HT, Biotek) for all samples (n=36), and compared with the CP-OCT results.
RESULTS
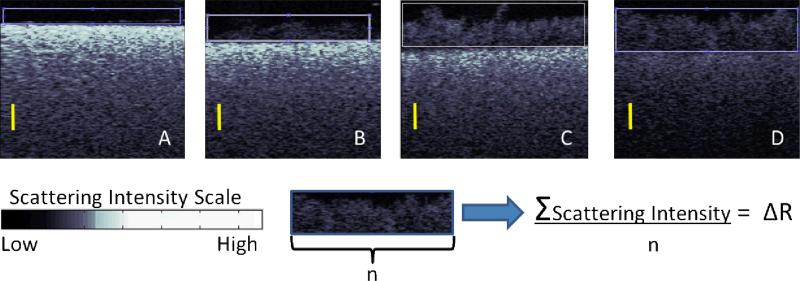
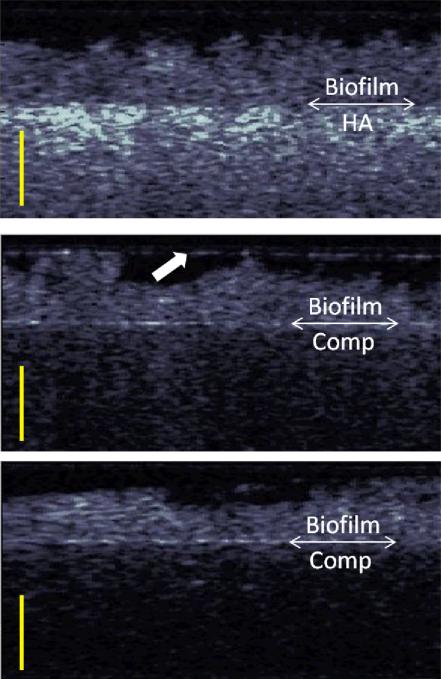
There was almost no detectable biofilm growth during the first 24 hours, when media flow was absent. CP-OCT can image the high scattering of the hydroxyapatite (HA) discs, and after 31 hours a detectable biofilm was shown to proliferate on the high scattering HA. The biofilm backscattered the incident linearly polarized light, but not to the same degree as the dense HA material. Figure 2 shows the biofilm growing on HA at the initial growth phase. The scattering intensity scale shown in Figure 2 is displayed in a logarithmic decibel scale. The biofilm mass was quantified by integrating the total scattering intensity within a rectangular area above the material disc. This integration was normalized by the lateral dimension of the integrated rectangle to produce the average line intensity profile (delta R) of the attached biofilm. The background noise intensity was offset to zero so that integration of air spaces did not contribute to the delta R value. After 48 and 52 hours, the biofilm increased in depth (Figure 2C and D) and produced a higher overall integrated scattering and delta R. As the biofilm grew the signal of the underlying HA disc was seen to diminish because both the incident and backscattered signal was attenuated by the overlying biofilm. The overall pattern of biofilm growth was analogous on the methacrylate based and silorane based materials (Figure 3). Methacrylate and silorane material have very low backscattering compared to HA; thus, the contrast of the overlaying biofilm was inverse, as the biofilms showed higher backscattering intensity than the resin composites. Neither CV nor CP-OCT measured a difference in the growth between the materials at any of the measured time points but there was an appreciable change in the biofilm over time (Figure 4A).
Figure 2.
Cross-Polarization OCT images of the growth of multi-species bacterial microcosms (rectangle area) on hyrdroxyapatite discs after A) 24 hours B) 31 hours C) 48 hours D) 52 hours. The scale bars are 500 μm in optical depth or roughly ~385 μm in biofilm depth. The scattering intensity of a biofilm in a rectangular area is integrated and normalized to produce the delta R parameter. The Delta R increased during biofilm growth.
Figure 3.
Cross-Polarization OCT images of the microcosms after 48 hours of growth on (top) hydroxyapatite, (middle) silorane based composite, (bottom) methacrylate based composite. The double arrow demarcation shows the boundary between the biofilm and the material. The scale bars are 500 μm in optical depth or roughly ~385 μm in biofilm depth. The arrow (middle image) shows a highly reflecting water layer that causes some crosstalk into the cross polarization channel.
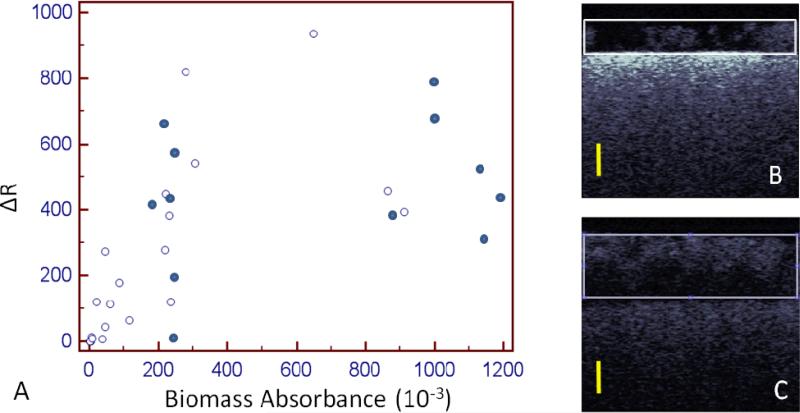
Figure 4.
Scatter plot of Cross-Polarization OCT analysis and crystal violet. Open circles denote time points from 24-52 hours. 6 samples at 24 hours were near zero for both analyses. Closed circles show the biofilm at 56 and 72 hours. At these later time points, the biofilm began (B) detaching or (C) growing to a thickness that attenuated the OCT signal in the deeper layers. The scale bars are 500 μm in optical depth or roughly ~385 μm in biofilm depth.
The delta R of the CP-OCT images was strongly correlated (Spearman's rho=0.92) to crystal violet absorbance values over the period represented by the 24 to 52-hour time points (open circles, Figure 4A). However, when the biofilm was allowed to grow and mature to 56 and 72 hours (dark circles in Figure 4A), the overall correlation was lower (Spearman's rho=0.78) between delta R and crystal violet absorbance. CP-OCT scans of the biofilm at 56 and 72 hours showed that at those points the biofilms were prone to detaching from the surface (Figure 4B) or growing to a significant height (Figure 4C). On the one hand, detachment (dark circles on the left of Figure 4A) produced lower values of delta R and crystal violet absorbance. On the other hand, if the biofilm reached a height of over 500 μm, the back-scattered signal was notably attenuated. This attenuation is seen in Figure 4C where the bottommost aspect of the biofilm appears much darker in intensity then the upper portion of the biofilm. As the biofilm reached a large mass, the scattering of the biofilm layer closest to the material was measured to be very low and thus, the calculated delta R for these biofilms were lower than expected (dark circles on the right of Figure 4A). This issue of attenuation in the CP-OCT biofilm images was also seen in two disc samples grown for 52 hours (open circles on the right of Figure 4A) that showed considerable growth by CV analysis. Therefore, the later time points had an overgrown biofilm that either attenuated the incident/returning signal or was in the process of detaching from the disks. As the biofilm grew thicker than 500 μm, it became more difficult to detect the underlying resin composite discs, due to their lower scattering than HA.
DISCUSSION
This work highlighted the value of using a near infrared, 1310-nm based CP-OCT system to achieve imaging depths that exceed the limiting imaging depth in visible light-based CLSM studies (Xi et al. 2006; Haisch and Niessner 2007). Although other authors have shown that OCT can be used for biofilm visualization (Nguyen et al. 2010), the importance of this work is that it introduces a rapid non-destructive method of quantifying the biofilm based on overall depth-resolved scattering. The biofilm is visualized by CP-OCT because the incident light is depolarized by the scattering components in the biofilm. In contrast, the interface between air and an aqueous layer on the disc will reflect and preserve the linear polarized light (Figure 1, P-state). The cross-polarization element of the OCT system filters out the original polarization state (P-state), allowing the scattering of the biofilm components to be measured. Reflections from aqueous layers would be expected to be orders of magnitude larger than the bacterial and extracellular matrix backscattering. This study did find that a few samples imaged (Figure 3A-arrow) show a residual component of the larger reflected signal of aqueous layers. The CP-OCT system is effective in removing 99.9% of reflected light (P-state). This means that there is a small signal from a water layer reflection that is not filtered by the system; however, this has a negligible effect on the overall integrated scattering and delta R.
For CP-OCT analysis, the index of refraction mismatches between the bacterial cell membranes and extracellular matrix with the surrounding aqueous layer likely cause a large degree of the measured backscattered signal (Balaev et al. 2003; Leis et al. 2005). Cell sorting technology based research on visible light scattering has shown that the cell membrane component has a major influence on the backscattering component of the signal (Meyer 1979). Since CP-OCT uses low coherence interferometry to gate out multiple scattered photons, single photon backscattering of individual components of the oral microcosms were the primary contributors to the measured cross-polarization signal. Integrating the measured single photon backscattering and normalizing the overall backscattering to an average scattering profile, delta R, produced a measure that was strongly correlated with crystal violet staining. That strong correlation suggests that CP-OCT is a valid method for monitoring biofilm growth. Furthermore, the integration-based method can be applied to markedly uneven biofilms since this method does not rely on extracting any defined boundary of the biofilm. Since CP-OCT is capable of characterizing demineralization effects (Fried et al. 2002), CP-OCT may be used to assess both the growth and subsurface degradation effects of in vitro bacterial microcosms in future tooth-restoration models.
The significance of this work is that CP-OCT provides a means to non-destructively monitor biofilm growth on dental materials and possibly elucidate if unique and novel biomaterials resist colonization or promote early detachment from certain oral biofilm microcosms. We are exploring those questions in ongoing studies.
ACKNOWLEDGEMENTS
This work was supported by NIH Grant 1R01DE021366-01, 3M Foundation Faculty Development Award, and the University of Minnesota. The authors would acknowledge the resources provided by the Minnesota Supercomputing Institute at the University of Minnesota.
REFERENCES
- Balaev AE, Dvoretski KN, Doubrovski VA. In: Determination of refractive index of rod-shaped bacteria from spectral extinction measurements. Tuchin VV, editor. SPIE; 2003. pp. 375–380. [Google Scholar]
- Fried D, Xie J, Shafi S, Featherstone JDB, Breunig T, Lee CQ. Imaging caries lesions and lesion progression with polarization sensitive optical coherence tomography. J Biomed Optics. 2002;7:618–627. doi: 10.1117/1.1509752. [DOI] [PubMed] [Google Scholar]
- Haisch C, Niessner R. Visualisation of transient processes in biofilms by optical coherence tomography. Water Research. 2007;41:2467–2472. doi: 10.1016/j.watres.2007.03.017. [DOI] [PubMed] [Google Scholar]
- Jakubovics NS, Kolenbrander PE. The road to ruin: the formation of disease-associated oral biofilms. Oral Diseases. 2010;16:729–739. doi: 10.1111/j.1601-0825.2010.01701.x. [DOI] [PubMed] [Google Scholar]
- Leis AP, Schlicher S, Franke H, Strathmann M. Optically transparent porous medium for nondestructive studies of microbial biofilm architecture and transport dynamics. Appl Environ Microbiol. 2005;71:4801–4808. doi: 10.1128/AEM.71.8.4801-4808.2005. [DOI] [PMC free article] [PubMed] [Google Scholar]
- Liu B, Brezinski ME. Theoretical and practical considerations on detection performance of time domain, Fourier domain, and swept source optical coherence tomography. J Biomed Opt. 2007;12:044007–044012. doi: 10.1117/1.2753410. [DOI] [PubMed] [Google Scholar]
- Meyer RA. Light-Scattering from Biological Cells - Dependence of Backscatter Radiation on Membrane Thickness and Refractive-Index. Appl Optics. 1979;18:585–588. doi: 10.1364/AO.18.000585. [DOI] [PubMed] [Google Scholar]
- Neu TR, Lawrence JR. Development and structure of microbial biofilms in river water studied by confocal laser scanning microscopy. FEMS Microbiology Ecology. 1997;24:11–25. [Google Scholar]
- Nguyen CT, Tu H, Chaney EJ, Stewart CN, Boppart SA. Non-invasive optical interferometry for the assessment of biofilm growth in the middle ear. Biomed Opt Express. 2010;1:1104–1116. doi: 10.1364/BOE.1.001104. [DOI] [PMC free article] [PubMed] [Google Scholar]
- Paramonova E, de Jong ED, Krom BP, van der Mei HC, Busscher HJ, Sharma PK. Low-load compression testing: a novel way of measuring biofilm thickness. Appl Environ Microbiol. 2007;73:7023–7028. doi: 10.1128/AEM.00935-07. [DOI] [PMC free article] [PubMed] [Google Scholar]
- Sule P, Wadhawan T, Carr NJ, Horne SM, Wolfe AJ, Prüβ BM. A combination of assays reveals biomass differences in biofilms formed by Escherichia coli mutants. Letters in Applied Microbiology. 2009;49:299–304. doi: 10.1111/j.1472-765X.2009.02659.x. [DOI] [PMC free article] [PubMed] [Google Scholar]
- Vroom JM, De Grauw KJ, Gerritsen HC, Bradshaw DJ, Marsh PD, Watson GK, Birmingham JJ, Allison C. Depth penetration and detection of pH gradients in biofilms by two-photon excitation microscopy. Appl Environ Microbiol. 1999;65:3502–3511. doi: 10.1128/aem.65.8.3502-3511.1999. [DOI] [PMC free article] [PubMed] [Google Scholar]
- Xi C, Marks D, Schlachter S, Luo W, Boppart SA. High-resolution three-dimensional imaging of biofilm development using optical coherence tomography. J Biomed Opt. 2006;11:034001–034006. doi: 10.1117/1.2209962. [DOI] [PubMed] [Google Scholar]


