

Abstract
Purpose
To measure the correlation between subjective symptom score, conventional clinical tests, and Fourier-domain optical coherence tomography (FD-OCT) of lower tear meniscus parameters in patients with dry eye disease.
Methods
Eighteen patients with dry eye disease requiring medical therapy and/or punctal occlusion were recruited for this prospective, nonrandomized, observational case series.
Severity of symptoms of dry eye disease was assessed using the Indiana Dry Eye Questionnaire 2002. Clinical assessments were completed using slit-lamp biomicroscopy, rose bengal dye staining, fluorescein tear break-up time (TBUT), and 5-minute Schirmer’s test with topical anesthesia. The lower tear meniscus was imaged using a FD-OCT system with 5-μm axial resolution and measured manually by a masked grader using computer calipers. Correlation was assessed using Spearman’s correlation coefficient (ρ).
Results
The mean scaled symptom score was 58 ± 21 (±SD), with a range of 0 to 100. Vital staining test averaged 1.7 ± 3.4, TBUT averaged 4.4 ± 1.8 seconds, and Schirmer’s tests averaged 10.2 ± 8.1 mm. As determined by OCT, the meniscus height was 228 ± 153 μm, depth was 127 ± 79 μm, and cross-sectional area was 0.018 ± 0.021 mm2. OCT meniscus area was negatively correlated with the symptom questionnaire score (P < 0.01) and positively correlated with Schirmer’s test results (P < 0.01). There was no significant correlation between symptom score and rose bengal staining, TBUT, or Schirmer’s test results (P > 0.01).
Conclusions
Lower tear meniscus measurement with FD-OCT is an objective, noninvasive test that correlates well with symptoms of dry eye disease and the Schirmer’s test.
Keywords: dry eye disease, optical coherence tomography, tear meniscus, symptoms, rose bengal, Schirmer’s, tear breakup time
Dry eye disease is a common condition worldwide.1-7 Severe dry eye disease may cause significant discomfort and ocular surface damage. Despite the availability of numerous clinical and investigational tools, no gold standard diagnostic test exists.8-10 The complexity of diagnosis and management of dry eye disease pertains to the difficulty of correlating patient symptoms and objective, quantitative clinical findings.8-17 Therefore, many clinicians diagnose and manage dry eye disease based solely on symptoms. Disease management and development of new therapies18-25 could be aided by the development of a reliable noninvasive diagnostic approach to evaluate disease severity and treatment efficacy.
The current literature on tomographic characterization of the tear film and tear menisci suggests that parameters produced by optical coherence tomography (OCT) are good quantitative indicators of tear volume.26-35 Fourier-domain (spectral) OCT allows much faster data acquisition compared to time-domain OCT and may also improve measurement reliability and accuracy.26-27 Before adopting OCT for management of dry eye disease, correlations between OCT measurements and conventional clinical tests should be evaluated. In this report, we sought to determine the correlation between subjective symptoms, rose bengal vital staining score, tear break-up time (TBUT), Schirmer’s test, and OCT lower tear meniscus parameters in patients with a clinical diagnosis of dry eye disease.
MATERIALS AND METHODS
Patients and procedures
Patients with dry eye disease requiring artificial tears, medical therapy (cyclosporine 0.05%), and/or punctal occlusion were recruited from the Doheny Eye Institute Dry Eye Clinic for this prospective, non-randomized, observational study. The only exclusion criterion was a requirement that no eye drops be instilled 2 hours before OCT imaging, to ensure that the effects of medications on tear film was negated. The research was approved by the Institutional Review Board at the University of Southern California and was in accordance to the tenets set forth in the Declaration of Helsinki. Written informed consent was obtained from each patient and all procedures and data management conformed to the Health Insurance Portability and Accountability Act of 1996.
A single certified clinical coordinator technician (SR) conducted all tests, including OCT imaging, rose bengal dye staining, TBUT, and the 5-minute Schirmer’s test with topical 0.5% proparacaine (Proparacaine hydrochloride ophthalmic solution, 0.5%, Alcon Laboratories, Fort Worth, TX, USA). Rose bengal dye staining, TBUT, and 5-minute post-anesthetic Schirmer’s test were performed and scored as previously described.36 Both rose bengal and fluorescein TBUT staining were performed on the same day, after OCT imaging. Briefly, for rose bengal, a drop of sterile non-preserved saline was instilled on a dye-impregnated strip (RoseGlo™, Sigma Pharmaceuticals, Monticello, IA). Excess fluid was shaken off before gentle application of the tip of the strip on the inferior palpebral conjunctiva. The patient was requested to blink a few times to promote uniform coating of the ocular surface. After 30 seconds, slit-lamp examination was performed for staining pattern and density, and a numerical score was obtained per the National Eye Institute workshop grading system.36 Fluorescein TBUT was performed in a similar fashion using a fluorescein-impregnated strip (Ful-Glo™, Akorn Pharmaceuticals, Lake Forest, IL). The TBUT was recorded in seconds, from the time of eyelid opening to the appearance of the first dry spot formation on the cornea. Schirmer’s test was performed by placing a Schirmer’s strip (TearFlo™, HUB Pharmaceuticals, Rancho Cucamonga, CA) at the junction of the mid and lateral thirds of the lower eyelid after instillation of one drop of proparacaine and removal of the excess fluid with a dry cotton-tipped applicator. Subsequently, the patient was instructed to look forward for five minutes, blinking normally but refraining from talking. After 5 minutes, the Schirmer’s strip was removed, and the amount of wetting was measured. Examination by slit-lamp biomicroscopy was performed by an ophthalmologist.
Scaled Symptom Score
The patients were instructed to complete the 6-page Indiana University Dry Eye Questionnaire 2002 (research.opt.indiana.edu/Labs/CorneaContactLens/DEQ.pdf) for symptom assessment by one investigator (SR) at the beginning of the visit. A scaled symptom score, i.e., a disease severity index, was computed from an average of scores collected from questions 6-18. The graded responses were scaled such that “0” was the least severe and “100” was the most severe. No distinction was made between eyes.
OCT imaging procedure
The lower tear meniscus was imaged at the inferior cornea-lid junction with a 6-mm vertical × 2.8-mm depth scan using a Fourier-domain OCT system (RTVue, Optovue, Inc., Fremont, CA). The OCT system was equipped with a corneal adaptor module with a 5-μm axial resolution and 15-μm transverse resolution (Fig. 1A, inset). Ambient temperature was regulated at 21°C, and there was no airflow except for the ceiling central air conditioning system. Each patient was directed to rest his or her chin on the chinrest with the forehead pressed against the forehead band. The patient was then instructed to fixate on an internal target, blink, and then refrain from blinking until completion of the 3-second scan. Immediately after completion of the scan and storage of the data, the patient was instructed to blink before a second scan. Both scans were performed 2 seconds after the blink. For each patient, only measurements from the right eye were included for analysis.
Figure 1.

Lower tear meniscus measurement. (A) Anatomy of the lower tear meniscus; the inset illustrates the scan position. (B) and (C) Caliper measurement protocol.
OCT lower tear meniscus parameter measurement
The measurement techniques have been described previously.27 Briefly, the OCT images (Fig. 1) were exported for manual computer caliper measurement using the ReVue RTVue software (version 4.0, Optovue). The lower tear meniscus height was defined as the distance from the cornea-meniscus junction to the lower eyelid-meniscus junction (Fig. 1B). The depth was measured from the midpoint of the air-meniscus interface to the cornea-lower eyelid intersection (Fig. 1B). The two-triangle approximation was used for area calculation (Fig. 1C). The angle was estimated from the angle between the inferior cornea and the lower tear meniscus surface. The two-triangle approximation was selected for its simplicity and for its good approximation of the tear meniscus compared to polygonal approximation (unpublished data). The saline group refractive index of 1.342 at the 830-nm wavelength was used to correct measurements for the effect of refraction at the air–meniscus interface.37-38 All measurements were performed by one masked experienced investigator (PN).
Statistical analysis
To avoid statistical complications from correlation between the right and left eyes, measurements from only the right eye of each patient were analyzed. The statistical significance level was set to P < 0.01 to minimize spurious correlation.39 The between-test correlations were assessed by means of non-parametric Spearman’s correlation coefficient (ρ) because of the small sample size. Descriptive statistics were calculated for all variables and expressed as mean ± standard deviation (SD), unless stated otherwise.
RESULTS
A total of 18 patients and 18 right eyes were included in this study. The patient characteristics are detailed in Table 1. Most of the patients were both Caucasian and female. The mean age was 56.6. Many of these patients had other systemic co-morbidities. All were using artificial tears, and two-thirds were using topical cyclosporine. Other therapies included punctal plugs and punctal cauterization (Table 1).
Table 1.
Characteristics of Dry Eye Patients in This Study
| Demographics | |
| No. of patients | 18 |
| Age (mean ± SD, range) | 56.6 ± 15, 19 - 88 |
| Race (% Caucasian) | 61 |
| Gender (% female) | 72 |
| Contact lens wearer (%) | 28 |
| Best corrected visual acuity (mean, range) | 20/23.3, 20/15 - 20/40 |
| Right (range) | 20/20 - 20/40 |
| Left (range) | 20/15 - 20/40 |
| Intraocular pressure (mmHg) | 13.0 ± 2.8 |
| Right (mean ± SD) | 12.8 ± 2.9 |
| Left (mean ± SD) | 13.1 ± 2.8 |
| Dry eye therapy (%) | |
| Artificial tears | 100 |
| Topical cyclosporine 0.5% | 67 |
| Punctal plugs | 39 |
| Punctal cauterization | 11 |
| Ocular co-morbidity (%) | |
| Meibomian gland disease | 67 |
| Sjögrens syndrome | 11 |
| History of LASIK | 11 |
| Systemic co-morbidity (%) | |
| Hypertension | 44 |
| Drug or seasonal allergy | 39 |
| Hypothyroidism | 22 |
| Rheumatoid arthritis | 22 |
| Psychiatric disorders | 22 |
| Cancer | 17 |
| Sinus disease | 11 |
| Asthma | 11 |
| Diabetes mellitus | 11 |
| Lupus | 6 |
The dry eye symptom score and measurements are provided in Table 2. The mean scaled symptom score was 58, suggesting persistence of symptoms despite polytherapy. The vital staining score with rose bengal was 1.7, and in 15 of our 18 patients the staining score was within the normal range according to the criterion recommended by the National Eye Institute/Industry Workshop on Clinical Trials in Dry Eyes.36 Tear film stability measured by TBUT was 4.4, compared to the commonly accepted normal limit of 10 seconds.36 The basal tear secretion rate measured by Schirmer’s test ranged from 0 - 25 mm, encompassing values characteristic of normal and severe aqueous tear deficiencies.
Table 2.
Summary of Test Results for Dry Eye Patients
| Conventional Clinical Dry Eye Tests |
OCT Lower Tear Meniscus |
|||||||
|---|---|---|---|---|---|---|---|---|
| Symptom Score |
Rose Bengal |
TBUT (s) |
Schirmer’s (mm) |
Height (mm) |
Depth (mm) |
Area (mm2) |
Angle (deg) |
|
| Mean | 58 | 1.7 | 4.4 | 10.2 | 228 | 127 | 0.018 | 30 |
| Standard Deviation | 21 | 3.4 | 1.8 | 8.2 | 153 | 79 | 0.021 | 10 |
| Minimum | 14 | 0.0 | 1.0 | 0.0 | 38 | 18 | 0.001 | 17 |
| Maximum | 82 | 12.0 | 8.0 | 25.0 | 591 | 294 | 0.072 | 65 |
Lower tear meniscus measurements by Fourier-domain OCT are also detailed in Table 2. The meniscus height averaged 228, depth averaged 127, and area averaged 0.018. The meniscus angle averaged 30 degrees. Spearman’s analysis did not reveal any significant association between the angle and any other diagnostic test, including OCT area, height, and depth, and thus was omitted from any further analysis.
Spearman’s correlation coefficient analysis did not reveal a significant relationship between symptom score and staining score, TBUT, or Schirmer’s tests, (Spearman’s ρ = 0.168, −0.229, and −0.357, respectively, with P > 0.01). Vital staining score and TBUT were not significantly correlated with any of the OCT meniscus variables; but vital staining score showed a trend toward a negative correlation with Schirmer’s test score (ρ = −0.488, P = 0.04, (Table 3). Here, we observed negative correlation between the symptom score and the meniscus height (Spearman’s ρ = −0.556, P = 0.018, Table 3), the meniscus depth (Spearman’s ρ = −0.595, P = 0.009, Table 3), and the area (Spearman’s ρ= −0.602, P = 0.008, Table 3, Fig. 2). Similarly, there was a strong positive correlation between the Schirmer’s test results and OCT meniscus parameters. The overall significance was supported by each of the three lower meniscus variables (Table 3): height (ρ = 0.754, P < 0.001), depth (ρ = 0.772, P < 0.001), and area (ρ = 0.729, P < 0.001, Table 3, Fig. 3).
Table 3.
Correlations among Measurements by Nonparametric Spearman’s (ρ)
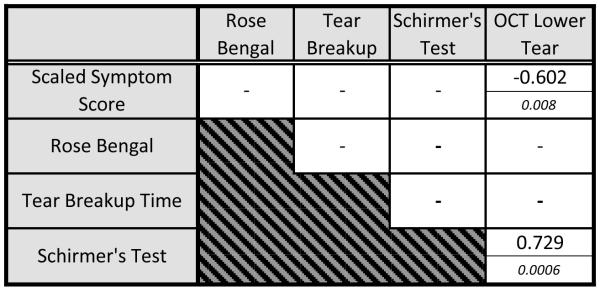 |
OCT= optical coherence tomography.
Note: For each cell, the top number represents Spearman’s coefficient ρ and the bottom italicized number denotes the P value. Nonsignificant correlations (P > 0.01) are not shown.
Figure 2.

Scatter plot of OCT lower tear meniscus area versus scaled symptom score. There was a significant negative correlation between the lower tear meniscus area and the scaled symptoms score.
Figure 3.

Scatter plot of OCT lower tear meniscus area versus Schirmer’s test. There was a significant positive correlation between the lower tear meniscus area and the Schirmer’s test score.
DISCUSSION
Despite the availability of numerous quantitative tools to assist the diagnosis and management of dry eye disease, correlating symptoms and signs remains a challenge. Vital dye staining test, tear break-up time, Schirmer’s test, and the cotton-thread test are easily administered, but the correlations between these various tests and between the tests and the patients’ subjective symptoms are poor in many published studies.8-17 These tests could confound results by disrupting the natural tear film, affecting tear production, and modifying the meniscus structure. Although these tests are helpful, the low repeatability and poor correlation with symptoms highlight the need for minimally invasive, objective, and informative tools.
Tear film insufficiency is correlated with tear meniscus measurements.15,30,40-45 OCT has the advantage of being a noninvasive in vivo technique for quantitative measurement of the tear film and tear menisci, not requiring ocular surface contact or dye instillation. Compared to time-domain OCT, Fourier-domain OCT provides higher scan speed and image resolution and may allow even more precise and expedient tear meniscus evaluation. Review of the literature suggests that OCT technology provides an objective and reliable tool for quantitative lower tear meniscus measurement.29-35
We performed a quantitative analysis of the lower tear meniscus using Fourier-domain OCT. The OCT lower tear meniscus results were consistent with previous publications in this area. 28,30,32-33,35,40,42,43,45-48 The meniscus measurements for patients in this cohort were lower than those of normal patients and were in concordance with previously reported measurements for patients with dry eye disease. For healthy subjects, the published mean OCT lower meniscus heights ranged from 190 to 400 μm, with most values falling between 240 and 290 μm. Published mean OCT lower meniscus areas ranged from 0.016 to 0.034 mm2, with most researchers reporting values between 0.021 and 0.029 mm2.28,30,32-33,43,45-48 For dry eye patients, most reported mean OCT lower meniscus heights ranged from 140 to 250 μm, and most lower meniscus areas were in the range of 0.0095 to 0.018 mm2.30,33,43,48-49 The values from our cohort were in good agreement with Ibrahim et al.33,49 and Yuan et al.43 In fact, Ibrahim and colleagues found a significant correlation between upper, as well as lower, tear meniscus height measurement, with slit lamp measurement, strip meniscometry, TBUT, vital stain, and Schirmer’s test, using Spearman’s correlation. Caution is advised, however, when performing comparisons among studies. Variability among patient demographics, measurement protocols, or OCT systems may yield different results.
The present work demonstrated significant correlations between the Schirmer’s scores and all three OCT-determined lower meniscus parameters (P < 0.01). Our data are consistent with recent findings by Kim et al.,45 though a stronger correlation was detected in our study. One would expect to find a good correlation between the Schirmer’s test and lower tear meniscus parameters because the Schirmer’s test measures tear production and the tear meniscus area is related to tear volume.49 And tear production rate should be closely related to tear volume. This correlation suggests that noninvasive OCT has the potential to serve as a good substitute for Schirmer’s test, which if not performed with care, could be irritating to the patient, provoke variable reflective tearing, and yield unreliable results.
We found a significant negative correlation between symptom scores and the OCT lower meniscus area (P < 0.01). In contrast, the symptom scores were not significantly correlated with the rose bengal staining score, TBUT, or Schirmer’s test. Although symptoms of ocular discomfort represent only one aspect of dry eye disease, these symptoms are the primary driver of clinical management.50 Neither TBUT nor Schirmer’s test alone were sufficiently sensitive and specific indicators. The good correlations between OCT lower meniscus parameters and Schirmer’s test and subjective symptoms suggest that they may be useful in the diagnosis and management of dry eye disease. The Indiana questionnaire was selected in this study instead of validated instruments such as the NEI Visual Functioning Questionnaire-25 (NEI VFQ-25) and the Ocular Surface Disease Index (OSDI) for the following reasons. The VFQ-25 evaluates visual function and ocular health in general. The OSDI surveys vision related function, ocular symptoms and enviromental triggers. Schiffman et al, 2000 demonstrated that the OSDI is an excellent tool for the evaluation of dry eye disease with good correlation well with other questionnaires.51 The authors, however, found that the OSDI scores do not correlate well with traditional objective clinical measures of dry eye, such as Schirmer test type I. Begley et al, 2002 concluded that the Indiana DEQ is a sensitive test for dry eye disease.52 Accordingly, we used the Indiana questionaire to correlate subjective symptoms with objective clinical measures and OCT tear meniscus measurements. Consequently, the correlations found in this study may not be extrapolated to other validated symptom assessment surveys.
In this study, we demonstrated a significant correlation between FD-OCT lower tear meniscus parameters and a scaled subjective score, as well as the conventional Schirmer’s test. We did not detect a significant correlation between symptom scores and rose bengal staining score, TBUT, or Schirmer’s score. These findings suggest that FD-OCT measurement of the lower tear meniscus may be useful for the quantification of tear volume and evaluation of dry eye disease, especially when reliable and objective outcomes are required, such as in clinical trials and epidemiological studies.50,53-54 Given our small sample size, larger studies are needed to validate the clinical utility of FD-OCT in the diagnosis and management of dry eye disease.
Acknowledgments
Financial Support: R01EY018184, R24EY13015, research grant from Optovue, Inc., grant from Research to Prevent Blindness, Charles C. Manger III, MD, Chair in Corneal Laser Surgery endowment. The sponsors and funding agencies had no role in the design or conduct of this research.
Footnotes
Financial Disclosure(s): Proprietary interests: David Huang received stock options, patent royalty and travel support from Optovue, Inc. (Fremont, CA). David Huang and Yan Li received research grant support from Optovue. Srinivas R. Sadda received research support from Optovue. The other authors have no proprietary interests in the topic of this manuscript.
This is a PDF file of an unedited manuscript that has been accepted for publication. As a service to our customers we are providing this early version of the manuscript. The manuscript will undergo copyediting, typesetting, and review of the resulting proof before it is published in its final citable form. Please note that during the production process errors may be discovered which could affect the content, and all legal disclaimers that apply to the journal pertain.
References
- 1.Moss SE, Klein R, Klein BE. Prevalence of and risk factors for dry eye syndrome. Arch Ophthalmol. 2000;118:1264–8. doi: 10.1001/archopht.118.9.1264. [DOI] [PubMed] [Google Scholar]
- 2.Schein OD, Muñoz B, Tielsch JM, et al. Prevalence of dry eye among the elderly. Am J Ophthalmol. 1997;124:723–8. doi: 10.1016/s0002-9394(14)71688-5. [DOI] [PubMed] [Google Scholar]
- 3.Schaumberg DA, Sullivan DA, Buring JE, et al. Prevalence of dry eye syndrome among US women. Am J Ophthalmol. 2003;136:318–26. doi: 10.1016/s0002-9394(03)00218-6. [DOI] [PubMed] [Google Scholar]
- 4.Lin PY, Tsai SY, Cheng CY, et al. Prevalence of dry eye among an elderly Chinese population in Taiwan: the Shihpai Eye Study. Ophthalmology. 2003;110:1096–101. doi: 10.1016/S0161-6420(03)00262-8. [DOI] [PubMed] [Google Scholar]
- 5.Hikichi T, Yoshida A, Fukui Y, et al. Prevalence of dry eye in Japanese eye centers. Graefes Arch Clin Exp Ophthalmol. 1995;233:555–8. doi: 10.1007/BF00404705. [DOI] [PubMed] [Google Scholar]
- 6.Lee AJ, Lee J, Saw SM, et al. Prevalence and risk factors associated with dry eye symptoms: a population based study in Indonesia. Br J Ophthalmol. 2002;86:1347–51. doi: 10.1136/bjo.86.12.1347. [DOI] [PMC free article] [PubMed] [Google Scholar]
- 7.McCarty CA, Bansal AK, Livingston PM, et al. The epidemiology of dry eye in Melbourne, Australia. Ophthalmology. 1998;105:1114–9. doi: 10.1016/S0161-6420(98)96016-X. [DOI] [PubMed] [Google Scholar]
- 8.Savini G, Prabhawasat P, Kojima T, et al. The challenge of dry eye diagnosis. Clin Ophthalmol. 2008;2:31–55. doi: 10.2147/opth.s1496. [DOI] [PMC free article] [PubMed] [Google Scholar]
- 9.Jordan A, Baum J. Basic tear flow. Does it exist? Ophthalmology. 1980;87:920–30. doi: 10.1016/s0161-6420(80)35143-9. [DOI] [PubMed] [Google Scholar]
- 10.Yokoi N, Komuro A. Non-invasive methods of assessing the tear film. Exp Eye Res. 2004;78:399–407. doi: 10.1016/j.exer.2003.09.020. [DOI] [PubMed] [Google Scholar]
- 11.Nichols KK, Mitchell GL, Zadnik K. The repeatability of clinical measurements of dry eye. Cornea. 2004;23:272–85. doi: 10.1097/00003226-200404000-00010. [DOI] [PubMed] [Google Scholar]
- 12.Nichols KK, Nichols JJ, Mitchell GL. The lack of association between signs and symptoms in patients with dry eye disease. Cornea. 2004;23:762–70. doi: 10.1097/01.ico.0000133997.07144.9e. [DOI] [PubMed] [Google Scholar]
- 13.Schein OD, Tielsch JM, Munõz B, et al. Relation between signs and symptoms of dry eye in the elderly. A population-based perspective. Ophthalmology. 1997;104:1395–401. doi: 10.1016/s0161-6420(97)30125-0. [DOI] [PubMed] [Google Scholar]
- 14.Lin PY, Cheng CY, Hsu WM, et al. Association between symptoms and signs of dry eye among an elderly Chinese population in Taiwan: the Shihpai Eye Study. Invest Ophthalmol Vis Sci. 2005;46:1593–8. doi: 10.1167/iovs.04-0864. [DOI] [PubMed] [Google Scholar]
- 15.Mainstone JC, Bruce AS, Golding TR. Tear meniscus measurement in the diagnosis of dry eye. Curr Eye Res. 1996;15:653–61. doi: 10.3109/02713689609008906. [DOI] [PubMed] [Google Scholar]
- 16.Saleh TA, McDermott B, Bates AK, et al. Phenol red thread test vs Schirmer’s test: a comparative study. Eye. 2006;20:913–5. doi: 10.1038/sj.eye.6702052. [DOI] [PubMed] [Google Scholar]
- 17.Machado LM, Castro R, Fontes B. Staining patterns in dry eye syndrome: rose bengal versus lissamine green. Cornea. 2009;28:732–4. doi: 10.1097/ICO.0b013e3181930c03. [DOI] [PubMed] [Google Scholar]
- 18.Marsh P, Pflugfelder SC. Topical nonpreserved methylprednisolone therapy for keratoconjunctivitis sicca in Sjögren syndrome. Ophthalmology. 1999;106:811–6. doi: 10.1016/S0161-6420(99)90171-9. [DOI] [PubMed] [Google Scholar]
- 19.Tauber J, Davitt WF, Bokosky JE, et al. Double-masked, placebo-controlled safety and efficacy trial of diquafosol tetrasodium (INS365) ophthalmic solution for the treatment of dry eye. Cornea. 2004;23:784–92. doi: 10.1097/01.ico.0000133993.14768.a9. [DOI] [PubMed] [Google Scholar]
- 20.Smith RE. The tear film complex: pathogenesis and emerging therapies for dry eyes. Cornea. 2005;24:1–7. doi: 10.1097/01.ico.0000141486.56931.9b. [DOI] [PubMed] [Google Scholar]
- 21.Perry H, Donnenfeld ED. Dry eye diagnosis and management in 2004. Curr Opin Ophthalmol. 2004;15:299–304. doi: 10.1097/00055735-200408000-00004. [DOI] [PubMed] [Google Scholar]
- 22.Yüksel B, Bozdag B, Acar M, et al. Evaluation of the effect of topical cyclosporine A with impression cytology in dry eye patients. Eur J Ophthalmol. 2010;20:675–9. doi: 10.1177/112067211002000405. [DOI] [PubMed] [Google Scholar]
- 23.Avni I, Garzozi HJ, Barequet IS, et al. Treatment of dry eye syndrome with orally administered CF101: data from a phase 2 clinical trial. Ophthalmology. 2010;117:1287–93. doi: 10.1016/j.ophtha.2009.11.029. [DOI] [PMC free article] [PubMed] [Google Scholar]
- 24.Nguyen P, Yiu SC. Ocular surface reconstruction: recent innovations, surgical candidate selection and postoperative management. Exp Rev Ophthalmol. 2008;3:567–84. [Google Scholar]
- 25.Yiu SC, Thomas PB, Nguyen P. Ocular surface reconstruction: recent advances and future outlook. Curr Opin Ophthalmol. 2007;18:509–14. doi: 10.1097/ICU.0b013e3282f0ab33. [DOI] [PubMed] [Google Scholar]
- 26.Huang D, Swanson EA, Lin CP, et al. Optical coherence tomography. Science. 1991;254:1178–81. doi: 10.1126/science.1957169. [DOI] [PMC free article] [PubMed] [Google Scholar]
- 27.Huang D, Izatt JA, Yasuno Y, et al. Future direction of anterior segment optical coherence tomography. In: Steinert RF, Huang D, editors. Anterior segment optical coherence tomography. SLACK Inc.; Thorofare, NJ: 2008. pp. 165–73. [Google Scholar]
- 28.Zhou S, Li Y, Lu A, et al. Reproducibility of tear meniscus measurement by Fourier-domain optical coherence tomography: a pilot study. Ophthalmic Surg Lasers Imaging. 2009;40:442–7. doi: 10.3928/15428877-20090901-01. [DOI] [PMC free article] [PubMed] [Google Scholar]
- 29.Wang J, Aquavella J, Palakuru J, et al. Relationships between central tear film thickness and tear menisci of the upper and lower eyelids. Invest Ophthalmol Vis Sci. 2006;47:4349–55. doi: 10.1167/iovs.05-1654. [DOI] [PubMed] [Google Scholar]
- 30.Shen M, Li J, Wang J, et al. Upper and lower tear menisci in the diagnosis of dry eye. Invest Ophthalmol Vis Sci. 2009;50:2722–6. doi: 10.1167/iovs.08-2704. [DOI] [PubMed] [Google Scholar]
- 31.Bitton E, Keech A, Simpson T, et al. Variability of the analysis of the tear meniscus height by optical coherence tomography. Optom Vis Sci. 2007;84:903–8. doi: 10.1097/OPX.0b013e3181560ba8. [DOI] [PubMed] [Google Scholar]
- 32.Savini G, Goto E, Carbonelli M, et al. Agreement between Stratus and Visante optical coherence tomography systems in tear meniscus measurements. Cornea. 2009;28:148–51. doi: 10.1097/ICO.0b013e31818526d0. [DOI] [PubMed] [Google Scholar]
- 33.Ibrahim OM, Dogru M, Takano Y, et al. Application of Visante optical coherence tomography tear meniscus height measurement in the diagnosis of dry eye disease. Ophthalmology. 2010;117:1923–9. doi: 10.1016/j.ophtha.2010.01.057. [DOI] [PubMed] [Google Scholar]
- 34.Johnson ME, Murphy PJ. The agreement and repeatability of tear meniscus height measurement methods. Optom Vis Sci. 2005;82:1030–7. doi: 10.1097/01.opx.0000192352.78935.e0. [DOI] [PubMed] [Google Scholar]
- 35.Savini G, Barboni P, Zanini M. Tear meniscus evaluation by optical coherence tomography. Ophthalmic Surg Lasers Imaging. 2006;37:112–8. [PubMed] [Google Scholar]
- 36.Nelson JD. In-office diagnostic tests for dry eye disease. In: Asbell PA, Lemp MA, editors. Dry eye disease: the clinician’s guide to diagnosis and treatment. Thieme; New York, NY: 2006. pp. 34–46. [Google Scholar]
- 37.Lin RC, Shure MA, Rollins AM, et al. Group index of the human cornea at 1.3-microm wavelength obtained in vitro by optical coherence domain reflectometry. Opt Lett. 2004;29:83–5. doi: 10.1364/ol.29.000083. [DOI] [PubMed] [Google Scholar]
- 38.Drexler W, Hitzenberger CK, Baumgartner A, et al. Investigation of dispersion effects in ocular media by multiple wavelength partial coherence interferometry. Exp Eye Res. 1998;66:25–33. doi: 10.1006/exer.1997.0401. [DOI] [PubMed] [Google Scholar]
- 39.Murdoch IE, Morris SS, Cousens SN. People and eyes: statistical approaches in ophthalmology. Br J Ophthalmol. 1998;82:971–3. doi: 10.1136/bjo.82.8.971. [DOI] [PMC free article] [PubMed] [Google Scholar]
- 40.Sakane Y, Yamaguchi M, Shiraishi A, et al. Evaluation of tear meniscus volume using the DR-1 tear specular scope [In Japanese] Nippon Ganka Gakkai Zasshi. 2010;114:512–9. [PubMed] [Google Scholar]
- 41.Kawai M, Yamada M, Kawashima M, et al. Quantitative evaluation of tear meniscus height from fluorescein photographs. Cornea. 2007;26:403–6. doi: 10.1097/ICO.0b013e318033c242. [DOI] [PubMed] [Google Scholar]
- 42.Oguz H, Yokoi N, Kinoshita S. The height and radius of the tear meniscus and methods for examining these parameters. Cornea. 2000;19:497–500. doi: 10.1097/00003226-200007000-00019. [DOI] [PubMed] [Google Scholar]
- 43.Yuan Y, Wang J, Chen Q, et al. Reduced tear meniscus dynamics in dry eye patients with aqueous tear deficiency. Am J Ophthalmol. 2010;149:932–8. doi: 10.1016/j.ajo.2010.01.004. [DOI] [PMC free article] [PubMed] [Google Scholar]
- 44.Wang J, Palakuru J, Aquavella JV. Correlations among upper and lower tear menisci, noninvasive tear break-up time and Schirmer test. Am J Ophthalmol. 2008;145:795–800. doi: 10.1016/j.ajo.2007.12.035. [DOI] [PMC free article] [PubMed] [Google Scholar]
- 45.Kim SE, Yoon JS, Lee SY. Tear measurement in prosthetic eye users with Fourier-domain optical coherence tomography. Am J Ophthalmol. 2010;149:602–7. doi: 10.1016/j.ajo.2009.10.023. [DOI] [PubMed] [Google Scholar]
- 46.Wang J, Aquavella J, Palakuru J, et al. Repeated measurements of dynamic tear distribution on the ocular surface after instillation of artificial tears. Invest Ophthalmol Vis Sci. 2006;47:3325–9. doi: 10.1167/iovs.06-0055. [DOI] [PMC free article] [PubMed] [Google Scholar]
- 47.Shen M, Wang J, Tao A, et al. Diurnal variation of upper and lower tear menisci. Am J Ophthalmol. 2008;145:801–6. doi: 10.1016/j.ajo.2007.12.024. [DOI] [PubMed] [Google Scholar]
- 48.Wang Y, Zhuang H, Xu J, et al. Dynamic changes in the lower tear meniscus after instillation of artificial tears. Cornea. 2010;29:404–8. doi: 10.1097/ICO.0b013e3181bd476c. [DOI] [PubMed] [Google Scholar]
- 49.Ibrahim OM, Dogru M, Takano Y, et al. Application of Visante Optical Coherence Tomography Tear Meniscus Height Measurement in the Diagnosis of Dry Eye Disease. Ophthalmology. 2010;117:1923–9. doi: 10.1016/j.ophtha.2010.01.057. [DOI] [PubMed] [Google Scholar]
- 50.Lemp MA. Clinical trials in dry eye in surgery for dry eye? Dev Ophthalmol. 2008;41:283–97. doi: 10.1159/000131096. [DOI] [PubMed] [Google Scholar]
- 51.Schiffman R, Christianson M, Jacobsen G, Hirsch J, Reis B. Reliability and Validity of the Ocular Surface Disease Index. Arch Ophthalmol. 2000;118:615–21. doi: 10.1001/archopht.118.5.615. [DOI] [PubMed] [Google Scholar]
- 52.Begley C, Caffery B, Chalmers R, Mitchell L. Use of the Dry Eye Questionnaire to Measure Symptoms of Ocular Irritation in Patients With Aqueous Tear Deficient Dry Eye. Cornea. 2002;21:664–70. doi: 10.1097/00003226-200210000-00007. [DOI] [PubMed] [Google Scholar]
- 53.Methodologies to diagnose and monitor dry eye disease: report of the Diagnostic Methodology Subcommittee of the International Dry Eye WorkShop (2007) Ocul Surf. 2007;5:108–52. doi: 10.1016/s1542-0124(12)70083-6. [DOI] [PubMed] [Google Scholar]
- 54.Federal Food, Drug, and Cosmetic Act – FD & C Act. [21 USC §355 section 505 (d)]