
Table 3.
Correlations among Measurements by Nonparametric Spearman’s (ρ)
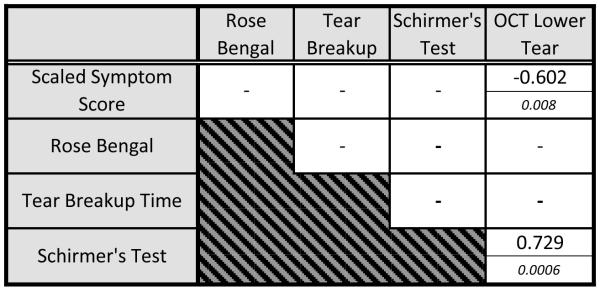 |
OCT= optical coherence tomography.
Note: For each cell, the top number represents Spearman’s coefficient ρ and the bottom italicized number denotes the P value. Nonsignificant correlations (P > 0.01) are not shown.