Abstract
Ras isoform-specific signaling from the plasma membrane appears to be regulated by interactions with distinct functional microdomains. We have developed protocols allowing the generation of 2-D spatial maps describing cell surface microdomain distributions. The combined electron microscopic (EM)-statistics approach provides nanometer scale resolution allowing both inner and outer leaflet domains to be visualized and cross-correlated with each other or with a protein of interest. In particular, the technique has allowed the interaction of Ras isoforms with signaling microdomains and proteins regulating these compartments to be screened. By allowing detailed monitoring of cell surface organization and compartmentalization the approach has widespread potential for studies of plasma membrane-dependent cell biology, including regulated signaling and membrane trafficking.
INTRODUCTION
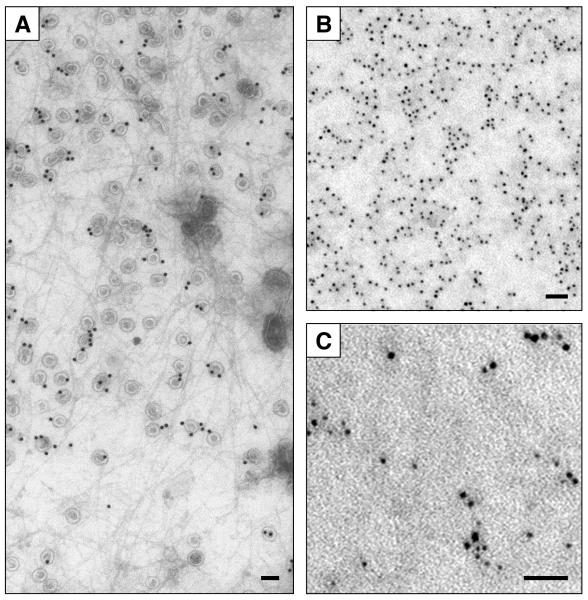
The cell surface is compartmentalized into a mosaic of functional microdomains facilitating processes such as cell signaling, adhesion and trafficking. Very few microdomains have been actually observed because in most cell types the majority of the cell surface where they reside is morphologically featureless. In contrast, microdomains such as caveolae, clathrin-coated vesicles and gap junctions have distinctive morphology (Fig. 1A), and as a consequence are far better understood. Current models predict that cell surface microdomains are small (5-50 nm diameter), and short lived. Since they are beyond the resolution of conventional light microscopy (<200nm diameter) most studies have been indirect and predominantly relied on subcellular fractionation or fluorescence-based techniques; this has led to some significant disparities in estimates of microdomain size, distribution, composition and longevity (1).
Figure 1. Plasma membrane heterogeneity.
Plasma membrane sheets provide an unrivalled high-resolution view of cell surface compartmentalization. The cell surface is highly organized, some microdomains such as caveolae (gold labeled) are readily recognized however most microdomains reside in the morphologically featureless areas (A). Immuno-gold labeling for a lipid raft marker protein reveals a clustered pattern (B). Double labeling is used score protein-protein and protein-microdomain association (C). Bars represent 100 nm (A) and 50 nm (B and C).
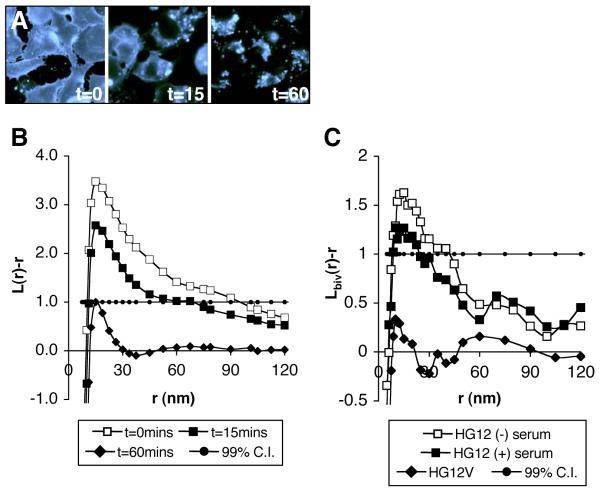
We have developed a combined immuno-EM-statistics approach to directly visualize morphologically featureless plasma membrane microdomains (Fig. 2A, Ref. (2)). Analysis of gold-labeled protein distributions reveals their relative organization within the cell surface (Figs. 1 and 2). The technique was used to characterize the dynamics of Ras isoform association with distinct signaling domains (3). Despite almost complete sequence homology or identity between the three main ubiquitously expressed Ras isoforms: H-Ras, K(B)-Ras and N-Ras, distinct biological functions have been characterized. These include different knock-out mouse phenotypes (4-6), effector activation profiles (7-9), and preferential oncogenic mutation of specific isoforms in particular types of cancer (10). An explanation for these differences lies in the C-terminal hypervariable region of Ras, responsible for membrane attachment and targeting (11). The EM-statistics approach revealed that activated H-Ras and K(B)-Ras occupy distinct signaling domains and that activation of H-Ras promotes translocation from lipid rafts to galectin-1 stabilized signaling domains (Fig. 2B and Ref. (3)). Further EM characterization with a complementary fluorescence-based approach revealed the role of the H-Ras hypervariable domain and N-terminal catalytic domain in regulating dynamic membrane and microdomain association (12).
Figure 2. Immuno-gold clustering is characterized by K-function analysis.
Methyl-β-cyclodextrin depletes cell surface cholesterol over time (filipin labeling; A). Cholesterol depletion disrupts lipid raft structure as seen by the progressive loss of clustering of a lipid raft marker protein (B). Values of L(r)-r above the 99% confidence interval indicate significant clustering within the defined x-axis radius values (r), below −1.0 indicates significant dispersal. Bivariate K-function analysis of double-labeled samples reveals the extent of colocalization of a pair of proteins (C). Co-localization of a lipid raft marker with inactive (G12 minus serum) and activated (G12V and serum-stimulated G12) H-Ras is scored. As H-Ras is progressively more activated association with lipid rafts decreases. Reproduced from The Journal of Cell Biology, 2003, 160: 165-70, by copyright permission of The Rockefeller University Press.
The technique can be used to examine the distribution of any surface-localized protein including proteins that are not found in morphologically identifiable regions of the plasma membrane. Analysis of single-labeled gold populations to determine the effects of stimuli or perturbation of membrane or protein function can be performed. Alternatively, comparing gold populations from double-labeled samples allows co-localization of the protein of interest with another protein or a microdomain marker to be assessed. We anticipate that this approach, particularly when used in combination with subcellular fractionation and fluorescence-based techniques, will allow a comprehensive picture of the spatio-temporal regulation of plasma membrane based signaling to be developed.
OVERVIEW OF THE EM-STATISTICS APPROACH
Cells on coverslips are rapidly processed to generate plasma membrane sheets on EM grids before fixation and labeling with gold-conjugated antibodies. Digitized EM images are processed to determine the (x, y) co-ordinates of all of the gold particles within a standard sized area. Ripley’s univariate K-function analysis uses the co-ordinates to determine whether the gold pattern is clustered, dispersed or random. For double-labeled samples, bivariate K-function analysis determines the extent of co-localization of two proteins by analyzing the extent that the two different sized gold populations are clustered with respect to each other. Calculating the Kfunction requires an accurate measurement of all pairs of inter-particle distances within the gold pattern. In essence, the analysis interrogates whether the gold density is higher (clustered), lower (dispersed) or the same as that expected if the distribution was random (i.e. equal to the overall density of the gold pattern) over a range of distances from each gold particle. The protocols described here will focus on how to generate samples and reagents; before giving a brief explanation of how the statistical analysis is performed and interpreted. For a more comprehensive account of the statistical theory behind the K-function the reader is directed to the methods and supplementary information of Ref. (3).
REAGENTS
Outlined below are reagents that need to be prepared in advance before plasma membrane sheets are generated. In addition, stock solutions of KOAc buffer (10x stock: 250mM Hepes pH 7.4 (KOH), 1.15M potassium acetate, 25mM MgCl2), 10% bovine serum albumin (BSA) and 10% fish skin gelatin (FSG) both in phosphate buffered saline (PBS) can be prepared, filter sterilized and stored at 4°C.
A. Antibody-conjugated colloidal gold
We found that gold larger than 5nm in diameter is unable to detect clustering, probably due to steric hindrance (3). Similarly, the gold must be directly conjugated to the antibody for efficient detection of antigen clustering. We prepared 2-3 nm and 4-5 nm gold according to the method of Slot and Geuze, 1985 (13). Briefly, 10 ml of reducing solution (0.2% trisodium citrate, 0.05% tannic acid, 1.25mM K2CO3 for 5nm gold or 0.2% trisodium citrate, 2.5% tannic acid, 6.25mM K2CO3 for 2-3 nm gold.) and 40 ml of gold solution (0.0125% HAuCl4) are prepared; the tannic acid should ideally be derived from Aleppo tannin (Mallinkrodt, 8835). The solutions are heated to 60°C before being added together, stirred vigorously and boiled for 1-2 min. Following cooling on ice and adjustment of the pH to 8.5, the gold is ready for antibody conjugation. At this point the colloidal gold can be conjugated to any antibody and many proteins. Typically 7-10μg of IgG/ml of gold is incubated for 10 minutes before stabilization of the colloidal gold by addition of BSA to a final concentration of 0.1%. The gold is concentrated and unbound antibody that would compete for antigen binding is washed away by ultracentrifugation (100,000g, 5 nm, 120,000g, 2-3 nm; 1 hour, 4°C). The loose part of the pellet is collected and washed again before use in single labeling experiments. 0.1% BSA is included in all wash steps to endure colloidal gold stability. Over time, the antibody can desorb and compete for antigen binding sites, repeating the wash step will refresh the antibody-gold conjugate for further use.
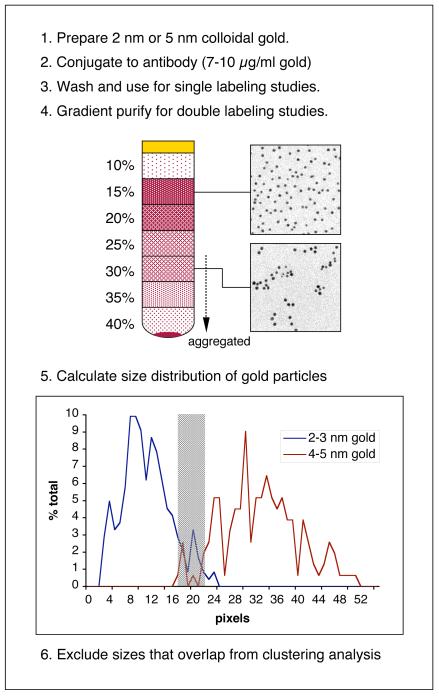
For double labeling there is too much size overlap between the 2-3 nm and 5 nm gold preparations unless further gradient-based fractionation is performed (Fig. 3). After centrifugation on a 10-40% glycerol gradient (0.1% BSA, PBS; 200,000g, 30 min, 4°C) fractions from the upper half of the gradient are collected and imaged in a transmission electron microscope to determine the gold size distributions. We incubate a coated grid with 5 μl of gold for 2 minutes before transferring the grid to 50 μl methyl cellulose and immediate loop drying as described below to reduce artifactual clustering induced by air-drying. The gold can be calibrated using image analysis software such as AnalySIS (Soft-Imaging System) or ImageJ (http://rsb.info.nih.gov/ij/). 200-500 particles are counted at the same final magnification used for clustering analysis (see below). The analysis needs to generate curves representing the distribution of pixels occupied by the gold population. Our most consistent calibrations were obtained when manually outlining every gold particle in the field and determining size distributions using ImageJ; however, other commercially available software packages provide sophisticated and less time-consuming alternatives. Even with careful selection of gradient fractions some size overlap is still evident (Fig. 3); introduction of a 5-6 pixel counting exclusion window where most overlap occurs reduces this problem so that <5% of small (2-3nm) or large (4-5nm) gold represents contamination of the other gold.
Figure 3. Preparation and sizing of gold fractions.
Gold fractions are quantified by measuring the number of pixels that they occupy. Glycerol gradient fractions still exhibit substantial size overlap. Inserting a counting window removes most of this overlap (shaded area on the graph); for example, 90% of 2-3 nm particles are ≤17 pixels whereas <1% of 4-5 nm particles are ≤17. At pixel values ≥22, 97% of 4-5 nm particles are found whereas only <2% of 2-3 nm particles are this size.
B. Uranyl acetate/methyl cellulose
3% uranyl acetate in de-ionized water is stored at 4°C; when removing aliquots, care is taken not to disturb the precipitate that can form over time. 2% methyl cellulose in de-ionized water is prepared by heating to 90°C and then cooling on ice whilst continuing stirring. The beaker is then sealed with Parafilm and stored for 72 hours at 4°C. Undissolved solids are removed by centrifugation (100,000g, 90 min) and the supernatant is decanted and stored at 4°C.
C. Poly-l-lysine coated grids
Plastic (pioloform or formvar) coated grids stabilized with carbon are available from electron microscopy suppliers; we typically prepare pioloform-carbon coated 200 mesh hexagonal copper grids. Coated grids are incubated in 1 mg/ml poly-l-lysine for 10 minutes, briefly rinsed in two washes of de-ionized water and drained before air drying and storing on filter paper in a dust-free environment such as a glass Petri dish.
EXPERIMENTAL OUTLINE
A. Preparing plasma membrane sheets
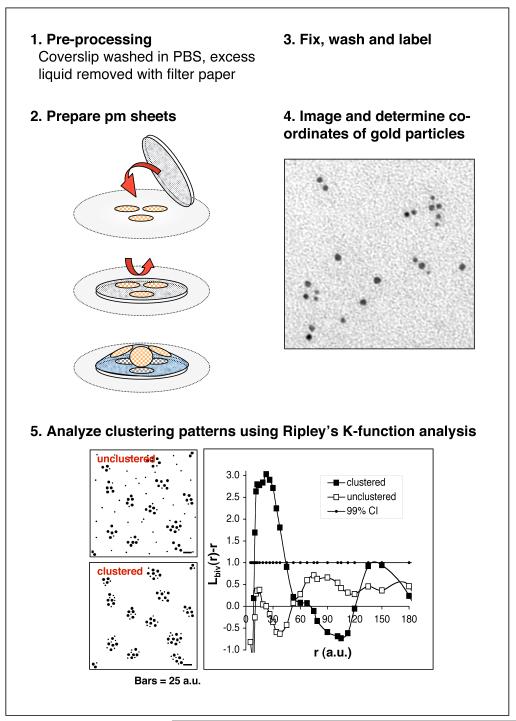
We have optimized the technique for producing plasma membrane sheets from adherent cells (Fig. 4); however, cells in suspension have also been successfully processed (14). We prepare cells on coverslips so that they are ideally 80-90% confluent when processing begins. Confluent cells can be used although this may reduce the recovery of membrane sheets. For suspension cells, allowing them to settle onto poly-l-lysine coated coverslips may aid the efficiency of membrane sheet preparation. EM grids are placed face up onto filter paper, we use two grids per sample, up to 6 grids can be used with a 10 mm coverslip. The coverslip is dipped into a PBS wash, briefly drained on filter paper, placed face down onto the grids and pressure exerted on top for 1-2 seconds with a cork or silicon bung. The coverslip is turned over and approximately 100 μl (more for >10 mm coverslips) of KOAc buffer (25mM Hepes pH 7.4 (KOH), 115mM potassium acetate, 2.5mM MgCl2) is added quickly around the grids; the surface tension causes the grids to pop up and float on the drop. Care must be taken not to wet the backs of the grids for this and all future steps. Subsequent steps, unless otherwise stated, are performed using 100 μl drops of solution per 2 grids on Parafilm. The grids are very briefly washed on a KOAc drop before fixing with 4% paraformaldehyde, 0.1% glutaraldehyde in KOAc for 15 minutes. The typical time taken from cells in media to sample fixation is 15-20 seconds for 2 grids. The fixative is quenched with three washes with 25mM glycine in PBS for 10 minutes in total. Non-specific antigenicity is blocked by 0.2% BSA, 0.2% FSG in PBS incubation for 10 minutes. During this period the gold-antibody conjugate is diluted in block solution and microfuged for 2 minutes before use. Antibody dilutions have to be empirically determined; the grids are incubated in 5 μl of antibody solution per grid for 30 minutes. Samples are washed (5×4 min) in blocking solution and then de-ionized water (5×2 min) to remove phosphate ions that will precipitate uranyl acetate. After incubation with 1.8% methyl cellulose, 0.3% uranyl acetate for 10 minutes on ice, the grids are individually picked up in 5 mm copper wire loops, excess mixture is drained on filter paper and the loops are left to dry for at least 10 minutes. The methyl cellulose forms a thin film that protects the samples from air drying artifacts and ensures and an even negative stain over the whole grid. Once dry the grids are removed from the loops, taking care to leave the film over the grid intact. The grids can be stored indefinitely in a dust free environment before viewing.
Figure 4. Protocol scheme.
Cells on coverslips are pressed onto coated grids and the grids lifted using a cytosolic buffer. After fixation and labeling, areas of plasma membrane can be visualized in a transmission electron microscope. The co-ordinates of the gold particles are identified and the extent of clustering and/or co-localization is determined using Ripley’s K-function analysis. Test patterns showing clustered and unclustered double labeling are illustrated; and can be clearly discriminated by bivariate K-function analysis. The analysis has correctly identified that most small and large spots are clustered within 20-40 a.u. of each other and has also detected the longrange regularity of the test pattern with a second peak approaching the 99% confidence interval at 150 a.u.
B. Imaging plasma membrane sheets
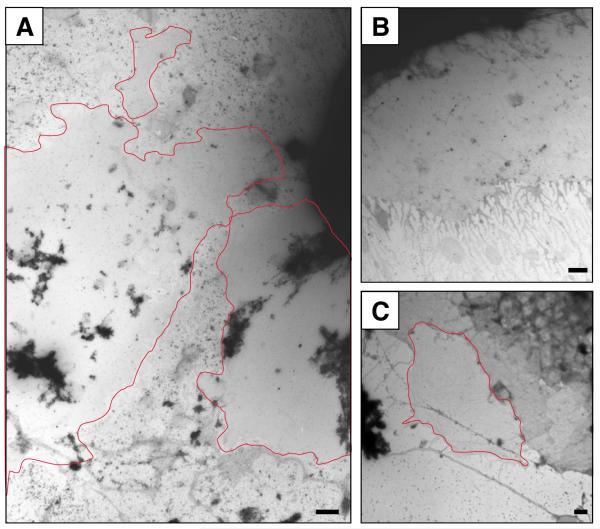
Grids are systematically scanned at 4-6000x magnification to identify possible membrane sheets. The grids are covered in cell debris including many whole cells therefore finding membrane sheets can be difficult. Illumination should be bright and the microscope set up to enhance contrast to give the best opportunity for identifying suitable areas against the similarly low contrasted background. Sheets can often be several microns in diameter with a well defined edge contrasted against the grid background (Fig. 5). Where lots of cell debris is present on the grid the membrane sheets often stand out as looking ‘clean’ against this cluttered background (Fig. 5A). A common place to find these areas is adjacent to semi-intact cells where the procedure has successfully disrupted a small section of the cell margin (Fig. 5B, C). Images are recorded at high magnification (40,000x for film cameras, or 100,000x for 1-2 megapixel digital cameras); the same magnification is used for every recorded image to simplify later image analysis. 10-20 images per sample are recorded where each image represents a membrane sheet from a different cell. Ultimately the images need to be in a digital format where there is enough resolution to clearly discriminate between 2-3 nm gold and 4-5 nm gold. When using film negatives we find that digital scanning to give a final resolution of 1500 dpi, where the final diameter of the scanned 8 cm × 10 cm EM negative measures 1 inch (2.54 cm), gives suitable resolution.
Figure 5. Identifying plasma membrane sheets.
Plasma membrane sheets can be hard to find due to their scarcity and low contrast, often they stand out by their smooth homogenous shading compared to the grainy background of grid (A). In many cases they can be found at the margins of cells (B) although cell margins can imitate the appearance of membrane sheets (C). Genuine membrane sheets appear paler (C) and specific antibody labeling will be present. Bars represent 1 μm.
C. Image analysis
Processing the images involves selecting standard sized areas and identifying the coordinates of the gold particles for subsequent analysis using Ripley’s K-function. Where double labeling has been carried out files describing the co-ordinates of small and big gold need to be generated. Macros written for commercially available software such as AnalySIS Pro have the capacity to accurately perform each of these functions however we have traditionally relied on a more basic and labor-intensive approach. Using Adobe Photoshop, an area is selected (e.g. 800 × 800 pixels is equivalent to 725 × 725 nm in negative of 40,000x magnification, or a 1000 × 1000 nm area from digital images of 100,000x magnification) and pasted into a new file. The background is removed using the Curves, Brightness/Contrast tools with remaining non-gold background deleted using the Brush tool set to white and the processed image is saved as a TIFF. Alternatively, the positions of each gold particle can be spotted on a new Layer using the Brush tool set so that each spot is equivalent in size to the average gold particle (e.g. 5 pixel diameter black spots). With this second approach the layer can be exported into a new TIFF file for subsequent analysis. For double-labeled areas, gold identification needs to be more precise; as with the original gold calibration, each gold particle is manually outlined before removing the background. The area is selected and each gold particle is outlined using the Lasso tool whilst depressing the Alt key, the background can then be removed using the Clear function or the Brush tool set to white.
We use ImageJ to identify gold particle co-ordinates. For double-labeled areas, predetermined values are required from the gold calibration to identify gold of the correct size. The Analyze Particles function allows the specific sizes of gold particles to be identified by gating the counts based on the number of pixels occupied by the particle. We found that for images photographed and digitized as described (40,000x mag., 1500 dpi), 2-75 pixels cover the entire size range from 2-5 nm. Inserting a 5 pixel counting exclusion window in the region of 15-20 pixels reduces most cross contamination to <5% whilst still allowing accurate identification of >85% of small or large gold (Fig. 3). Analyze Particles is set to locate the centre of mass of all gold particles within the required size range to 8-decimal places and the data file (two files for double labeling) are saved as a text file.
D. Ripley’s K-function analysis
Source code or Microsoft Excel Macros that carry out all of the analysis functions described in this section are freely available on request from the authors. The pixel (x, y) coordinates are converted from cm or inches into nanometers (the conversion factor needs to be determined from the scale bar or from EM calibrations). The converted values are pasted into a new file for subsequent univariate (single labeling) or bivariate (double labeling) K-function analysis (see Refs (3, 15-19) for detailed statistical information).
Briefly, the K-function (Eq 1) identifies systematic deviations of the immuno-gold pattern from complete spatial randomness at multiple length scales (we typical analyze a length range of 1-250nm). Data from replicated immuno-gold patterns are combined as a weighted mean K-function (Eq 2). The mean K-function is then best plotted as a linear transformation: L(r)-r (Eq 3), under this transformation the expected value of L(r)-r for a random pattern is 0 for all length scales. To interpret the statistical significance of positive or negative deviations from 0, indicating clustering or dispersal of the pattern respectively, it is necessary to generate a confidence interval (C.I.) for L(r)-r. This can be done using a large number of Monte Carlo simulations to generate random patterns of the same density as the mean K-function: alternatively an approximate 99% C.I. has been given by Ripley for values of r <1/4 of the length of the shortest axis (Eq 4). Once the C.I. is plotted, significant clustering or dispersal are readily identified where the L(r)-r plot leaves the C.I. The length at which maximal clustering occurs is related to the radius of the clusters in the pattern (20). Standardizing L(r)-r on the C.I facilitates a comparison of different data sets, the standardized L(r)-r function then has a 99% C.I. of ±1; values > 1.0, or < −1.0 indicate significant clustering or dispersal at the radius r, and no deviation outside the C.I. indicates a random pattern. For examples see Figs. 2 and 4.
More sophisticated analysis is also possible using bootstrap tests to formally evaluate whether two or more mean K-functions of replicated point patterns represent random variations of the same function or indicate that the underlying patterns are significantly different. A discussion of this type of test, which resembles that of a standard ANOVAR is beyond the scope of this article and readers are referred to the original papers (21). We have however written programs that carry out the bootstrap test and these are available on request.
The bivariate K-function (Eq. 5) is used to assess whether two populations of gold particles are randomly arrayed around each other or co-cluster. The calculation is similar to that of the univariate K-function in Eq. 1 except the inter-particle distances used to compute the function are those between small and large gold particles. As for the univariate function it is necessary to calculate a confidence interval using Monte Carlo simulations.
| (1) |
K(r) is the K function for a pattern of n points in an area A
||·|| is Euclidean distance
1(.) is the indicator function
wij−1 is the proportion of the circumference of the circle with center xi and radius ||xi-xj|| contained within A
| (2) |
Ki(r) is the ith K function with ni points
N is Σ ni
| (3) |
| (4) |
| (5) |
Kbiv(r) is the bivariate K function for a pattern of ni small gold and nj large gold particles
||·|| is Euclidean distance
1 (.) is the indicator function
wij −1 is the proportion of the circumference of the circle with center xi and radius ||xi-xj|| contained within A
wji −1 is the proportion of the circumference of the circle with center xj and radius ||xj-xi|| contained within A
POTENTIAL AND PITFALLS
Although it is now appreciated that cell surface exhibits complex lateral heterogeneity the techniques to probe this have until recently been limited. The technique outlined here, together with newly developed fluorescence-based and single particle tracking approaches (22), represent some of the best methods for analyzing cell surface function at high resolution. The fluorescence and single particle tracking approaches have the advantage of monitoring dynamic changes in protein distributions in vivo. However, the EM approach combines the best features of both by monitoring the distribution of protein populations on a nanometer scale, with the added advantage of being able to simultaneously compare proteins in both membrane leaflets. In addition, morphologically identifiable features such as caveolae, coated vesicles and cytoskeletal elements that are beyond the resolution of light microscopy can also be included in the analysis without having to specifically label for them. Ideally, a combinatorial approach is pursued using both biochemical and imaging techniques to build a consistent picture of spatial regulation of the cell biological processes under investigation.
A number of pitfalls can hamper success with this technique. Plasma membrane sheets can be difficult to find, optimally only 10-20 areas will be identified on an EM grid. Cell confluence can regulate success, <50% confluency produces very few areas whilst very confluent cells tend to peel off together without leaving isolated membrane fragments. Systematic screening of the whole grid at higher magnifications increases the chances of seeing the low contrast membrane sheets against the background. Access to suitable antibodies represents the biggest limiting factor, particularly when visualizing low abundance endogenous proteins. The requirement for 0.1% glutaraldehyde in the fixation step significantly reduces antigenicity for many antibodies. Antibodies presented a number of challenges for our Ras studies; we relied on GFP and pan-Ras (Y13-238) antibodies to analyze Ras isoform distributions with respect to microdomain markers (3). At the time of these experiments we could not directly compare Ras isoform distributions because Ras isoform-specific antibodies were not sensitive enough to provide EM labeling. Ras isoforms N-terminally tagged with HA- or myc epitopes also failed to produce specific labeling when the antibody was directly conjugated to gold probably due to steric hindrance (3). We have now characterized monomeric red fluorescent protein (23) as a suitable alternative large epitope tag for future experiments where similar problems arise.
For transfected proteins, the transfection efficiency needs to be >30% to have a reasonable chance of seeing labeling. Some antibodies present high non-specific labeling, controls to exclude this possibility must be performed. Similarly, centrifugation-induced nonspecific clustering of the gold can be a problem, to assess the quality of the gold preparation a Kfunction analysis of the gold can be performed. Gradient purification ensures a homogenous unclustered preparation although the presence of glycerol can reduce the efficiency of labeling.
CONCLUSION
We have described a powerful technique for analyzing protein distributions within the cell surface. Importantly, and unlike standard EM techniques very little expertise is required to perform the experiments; the most challenging steps are finding suitable antibodies and preparing homogenous gold-antibody conjugates. Finally, although it has primarily been used to analyze Ras isoform distributions, the approach can be applied to any system using the plasma membrane.
ACKNOWLEGEMENTS
We gratefully acknowledge support from the NIH, the NHMRC (JFH); the Wellcome Trust and the Royal Society (IAP).
REFERENCES
- 1.Laude AJ, Prior IA. Molecular Membrane Biology. 2004;21:193–205. doi: 10.1080/09687680410001700517. [DOI] [PMC free article] [PubMed] [Google Scholar]
- 2.Prior IA, Parton RG, Hancock JF. Science’s STKE. 2003;2003:p19. doi: 10.1126/stke.2003.177.pl9. [DOI] [PubMed] [Google Scholar]
- 3.Prior IA, Muncke C, Parton RG, Hancock JF. J. Cell Biol. 2003;160:165–170. doi: 10.1083/jcb.200209091. [DOI] [PMC free article] [PubMed] [Google Scholar]
- 4.Johnson L, Greenbaum D, Cichowski K, Mercer K, Murphy E, Schmitt E, Bronson RT, Umanoff H, Edelman W, Kucherlapati R, Jacks T. Genes and Dev. 1997;11:2468–2481. doi: 10.1101/gad.11.19.2468. [DOI] [PMC free article] [PubMed] [Google Scholar]
- 5.Koera K, Nakamura K, Nakao K, Miyoshi J, Toyoshima K, Hatta T, Otani H, Aiba A, Katsuki M. Oncogene. 1997;15:1151–1159. doi: 10.1038/sj.onc.1201284. [DOI] [PubMed] [Google Scholar]
- 6.Umanoff H, Edelmann W, Pellicer A, Kucherlapati R. Proc. Natl. Acad. Sci. USA. 1995;92:1709–1713. doi: 10.1073/pnas.92.5.1709. [DOI] [PMC free article] [PubMed] [Google Scholar]
- 7.Voice J, Klemke R, Le A, Jackson J. J. Biol. Chem. 1999;274:17164–17170. doi: 10.1074/jbc.274.24.17164. [DOI] [PubMed] [Google Scholar]
- 8.Walsh AB, Bar-Sagi D. J Biol Chem. 2001;276:15609–15615. doi: 10.1074/jbc.M010573200. [DOI] [PubMed] [Google Scholar]
- 9.Yan J, Roy S, Apolloni A, Lane A, Hancock JF. J. Biol. Chem. 1998;273:24052–24056. doi: 10.1074/jbc.273.37.24052. [DOI] [PubMed] [Google Scholar]
- 10.Bos JL. Cancer Res. 1989;49:4682–4689. [PubMed] [Google Scholar]
- 11.Prior IA, Harding A, Yan J, Sluimer J, Parton RG, Hancock JF. Nature Cell Biology. 2001;3:368–375. doi: 10.1038/35070050. [DOI] [PubMed] [Google Scholar]
- 12.Rotblat B, Prior IA, Muncke C, Parton RG, Kloog Y, Henis Y, Hancock JF. Mol. Cell Biol. 2004;24:6799–6810. doi: 10.1128/MCB.24.15.6799-6810.2004. [DOI] [PMC free article] [PubMed] [Google Scholar]
- 13.Slot JW, Geuze HJ. Eur. J. Cell Biol. 1985;38:87–93. [PubMed] [Google Scholar]
- 14.Wilson B, Pfeiffer J, Oliver J. J. Cell Biol. 2000;149:1131–1142. doi: 10.1083/jcb.149.5.1131. [DOI] [PMC free article] [PubMed] [Google Scholar]
- 15.Ripley RD. J. R. Statist. Soc. 1977;B39:172–192. [Google Scholar]
- 16.Ripley BD. J. R. Statist. Soc. 1979;B41:368–374. [Google Scholar]
- 17.Diggle PJ. J Neurosci Methods. 1986;18:115–125. doi: 10.1016/0165-0270(86)90115-9. [DOI] [PubMed] [Google Scholar]
- 18.Besag J, Diggle PJ. Appl. Statist. 1977;26:327–333. [Google Scholar]
- 19.Besag JE. J. R. Statist. Soc. 1977;B39:193–195. [Google Scholar]
- 20.Parton RG, Hancock JF. Trends in Cell Biology. 2004;14:141–147. doi: 10.1016/j.tcb.2004.02.001. [DOI] [PubMed] [Google Scholar]
- 21.Diggle PJ, Mateu J, Clough HE. Advances in Applied Probability. 2000;32:331–343. [Google Scholar]
- 22.Ritchie K, Iino R, Fujiwara T, Murase K, Kusumi A. Molecular Membrane Biology. 2003;20:13–18. doi: 10.1080/0968768021000055698. [DOI] [PubMed] [Google Scholar]
- 23.Campbell RE, Tour O, Palmer AE, Steinbach PA, Baird GS, Zacharias DA, Tsien RY. Proc. Natl. Acad. Sci. USA. 2002;99:7877–7882. doi: 10.1073/pnas.082243699. [DOI] [PMC free article] [PubMed] [Google Scholar]


