

Summary
The cerebellum (Cb) controls movement related physiology using a diverse array of morphologically and biochemically distinct neurons. During development, the Cb is derived from rhombomere 1 (r1), an embryonic compartment patterned by a signaling center referred to as the isthmus organizer. The secreted glycoprotein WNT1 is expressed in the midbrain primordia (mesencephalon, mes) and at the posterior limit of the mes, WNT1 plays a pivotal role in maintaining the isthmus organizer. Mutations in Wnt1 produce severe Cb defects that are generally attributed to aberrant organizer activity. Interestingly, Wnt1 is also expressed at the most posterior limit of dorsal r1, in a region known as the upper rhombic lip (URL). However, the distribution and molecular identity of Wnt1 expressing progenitors have not been carefully described in r1. We used Wnt1-Venus transgenic mice to generate a molecular map of Wnt1 expressing progenitors in relation to other well characterized Cb biomarkers such as MATH1 (ATOH1), LMX1a and OTX2. Our analysis validated Wnt1 expression in the URL and revealed molecularly-defined developmental zones in r1. We then used genetic inducible fate mapping (GIFM) to link transient Wnt1 expression in r1 to terminal cell fates in the mature Cb. Wnt1 expressing progenitors primarily contributed to deep cerebellar nuclei, granule cells, and unipolar brush cells in distinct but overlapping temporal windows and sparsely contributed to inhibitory neurons and Bergmann glia. We further demonstrate that the Wnt1 lineage does not follow a competency model of progressive lineage restriction to generate the Cb or the functionally related precerebellar system. Instead, progenitors initiate Wnt1 expression de novo to give rise to each Cb cell type and precerebellar nuclei. We then used GIFM to determine how the temporal control of Wnt1 expression is related to molecular identity and cell migration in Cb development. Our findings provide new insight into how lineage and timing establish cell diversity within the Cb system.
Keywords: Cerebellum, Wnt1, Genetic Inducible Fate Mapping, Lineage, Cell Fate, Mouse Genetics
Introduction
Wnt1 encodes a secreted glycoprotein that is expressed in spatially and temporally restricted domains during development and is important for patterning the mes and r1 (McMahon and Bradley, 1990). Wnt1 expressing progenitors in the mes, marked at different embryonic time points, give rise to distinct dorsal and ventral midbrain (Mb) structures (Zervas et al., 2004; Ellisor et al., 2009). Lineage boundaries prevent Wnt1 expressing progenitors in the mes from substantially populating r1 and r1 derivatives from contributing to dorsal Mb (Zervas et al., 2004; Sunmonu et al., 2011). At this boundary, Wnt1 participates in a complex genetic loop that maintains the isthmus organizer, a signaling center critical for patterning both the mes and r1 (Liu and Joyner, 2001). The functional requirement for Wnt1 is evident from Wnt1−/− mutant embryos which fail to develop a Mb and Cb and die perinatally (McMahon and Bradley, 1990). Similarly, mice with a naturally occurring point mutation in Wnt1 (Wnt1sw/sw) have severe Mb and Cb defects and only a small percentage escape lethality (Thomas et al., 1991). Currently, the Cb phenotypes of Wnt1 mutants are attributed to aberrant signaling at the isthmus organizer (McMahon et al., 1992; Danielian and McMahon, 1996) or a perturbation in the mes/r1 lineage boundary (Bally-Cuif et al., 1995). Interestingly, in situ hybridization (ISH) shows that Wnt1 is also expressed in the posterior domain of dorsal r1 beginning at E10.5 in the mouse (Wilkinson et al., 1987). This region, known as the URL, serves as a germinal zone for excitatory cell types of the Cb (Machold and Fishell, 2005; Wang et al., 2005). The presence of Wnt1 expression in the URL raises the possibility that Wnt1 shapes Cb development from within r1. Alternatively, Wnt1 expressing cells could serve as a transient signaling center and subsequent to their role in patterning simply die off, similar to Fgf8 expressing cells in the limb apical ectodermal ridge (Kimmel et al., 2000; Guo et al., 2003). Previous work indicated that the Wnt1 lineage marked at E10.5 makes a very small contribution to the Cb (Zervas et al., 2004). However, this contribution was considered an ancillary observation and not explored in detail or pursued by marking at later time points. Using marker analysis, we showed that Wnt1 is expressed in molecularly distinct domains in the URL from E10.5-E13.5 suggesting that Wnt1 expressing progenitors arising from this domain are poised to make a significant contribution to the Cb. Our GIFM analysis established that Wnt1 expressing progenitors in r1 do indeed contribute to an array of neuronal types in the Cb. Specifically, we observed a distinct rise, peak, and fall of the Wnt1 lineage contribution to each excitatory Cb cell type. By temporally dissecting this contribution and following the developmental progression of the Wnt1 lineage, we uncovered that Wnt1 expression is induced de novo in r1 progenitors and corresponds with the order in which each Cb cell type emerges from the URL. However, the developmental profile of the Wnt1 lineage demonstrated that the timing of Wnt1 expression does not dictate when progenitors within a particular cell class will migrate away from the germinal zone. Our fate mapping analysis also revealed that lower rhombic lip (LRL) progenitors express Wnt1 at similar embryonic stages as observed in the URL and differentially give rise to neurons of the precerebellar system, a major source of afferent projections to the Cb. Our genetic lineage tracing also reveals axons from Wnt1-derived neurons in the precerebellar system that innervate the Cb. The synchrony of Wnt1 expression in the URL and LRL may coordinate the development of these two functionally related systems. In this regard, our study produces important information about the competency and development of the Wnt1 lineage and the temporal windows in which Wnt1 expressing progenitors give rise to distinct cell types in the Cb and precerebellar system.
Materials and Methods
Animals
Wnt1-Venus transgenic mice were generously provided by A. Joyner. Briefly, they were generated by subcloning a cassette encoding yellow fluorescent protein (Venus) into a multi-cloning site between the translated and untranslated region of exon 1, which places Venus under the control of Wnt1 regulatory elements (See Brown et al., 2011). This same configuration was successfully used to control CreERT expression in Wnt1-CreERT transgenic mice (Zervas et al., 2004). The TOPGAL (DasGupta and Fuchs, 1999), Z/EG (tg(ACTB-lox-βGeo-lox-EGFP), (Novak et al., 2000)), and Rosa26tdTomato (Rosa26lox-STOP-lox-tdTomato, (Madisen et al., 2010)) reporter mice were purchased from Jackson Laboratories (stock # 004623, 003920, and 007908 respectively) and mGFP reporter mice (Taulox-STOP-lox-mGFP-IRES-NLS-LacZ-pA, (Hippenmeyer et al., 2005)) were generously provided by S. Arber. Mice were housed and handled in accordance with Brown University Institutional Animal Care and Use Committee guidelines. Genotyping was done as previously described (Ellisor et al., 2009; Brown et al., 2009, Jackson Laboratories website).
Wnt1-Venus Tissue Preparation
Wnt1-Venus transgenic mice were bred with Swiss Webster wildtype females (Taconic) to obtain litters at six different embryonic stages (E9.5-E14.5). Litters were dissected in PBS over ice and Wnt1-Venus embryos were identified by GFP fluorescence and confirmed by genotyping for GFP (Ellisor et al., 2009). Embryos were fixed in 4% PFA overnight at 4°C, cryoprotected, and embedded in OCT. Embryos (n=3 across two litters for each embryonic stage) were sectioned sagittally (12 μm) with a Leica cryostat and stored at −20°C.
Fate mapping Tissue Preparation
Fate mapping experiments were conducted by crossing Wnt1-CreERT;Rosa26tdTomato, Wnt1-CreERT;mGFP, or Wnt1-CreERT;Z/EG males with Swiss Webster wildtype females (Taconic). The morning (0900) of the day a vaginal plug was detected was designated as 0.5 days post-coitus. Tamoxifen was administered at a dose of 4 mg to timed pregnant females by oral gavage at 0900 (Brown et al., 2009; Ellisor and Zervas, 2010). Fate mapped tissue was collected at four endpoints (E14.5, E18.5, P7, P42) and tail samples were obtained from each mouse for genotyping. At E14.5 and E18.5, Wnt1-CreERT;Rosa26tdTomato fate mapped embryos were dissected, fixed, cryoprotected, embedded, and sectioned (12 μm and 20 μm respectively) as described above. At P7, Wnt1-CreERT;Rosa26tdTomato fate mapped mice were deeply anesthetized with Nembutal and intracardially perfused with 4% paraformaldehyde. Craniotomies were performed to extract the fate mapped brains, which were cryoprotected, embedded, and sectioned sagittally (20 μm) as previously described. At P42, Wnt1-CreERT;mGFP and Wnt1-CreERT;Z/EG mice were intracardially perfused as described for P7 mice. Craniotomies were performed to extract the fate mapped brains, which were then embedded in 3% agarose in PBS and sectioned sagittally (40 μm) with a Leica vibratome (Brown et al., 2009). Three fate mapped brains across two litters were processed for each marking and analysis stage.
In Situ Hybridization (ISH)
Both wildtype and Wnt1-Venus tissue sections were analyzed by ISH as previously described (Ellisor et al., 2009) with digoxigenin labeled probes for Wnt1, GFP, or Math1 mRNA. The Math1 mRNA probe was generously provided by S. Ahn. The GFP expression plasmid (pGFP) was generated by PCR amplifying a 600 bp fragment of GFP (using the GFP sense primer 5′-CTG GTC GAG CTG GAC GGC GAC G-3′ and anti-sense primer 5′-CAC GAA CTC CAG CAGGAC CAT G-3′) and sub-cloning this fragment into the pCR®II-TOPO® vector using a TA Cloning® Kit (Invitrogen, Cat # K2020-20). The anti-sense GFP ISH probe was made by digesting pGFP with SpeI and labeled with T7 polymerase and digoxigenin.
Immunocytochemistry (ICC)
Wnt1-Venus tissue sections from E10.5-E14.5 were analyzed by ICC with the following primary antibodies: anti-GFP (1:500, Nacalai Tesque Inc; Cat # GF090R), anti-OTX2 antibody (1:1000, gratefully obtained from S. Ang, NIMR, UK), anti-LMX1a antibody (1:1000, gratefully obtained from M. German, UCSF). The secondary antibodies, Alexa 555 (Invitrogen; Cat # A-31572; donkey anti-rabbit IgG) and Alexa 488 (Invitrogen; Cat # A-21208; donkey anti-rat IgG) were prepared at a concentration of 1:500. For fate mapping experiments, anti-β-galactosidase (β-gal, 1:500, Biogenesis, Cat # 4600-1409 and 1:500, Abcam, Cat # ab9361-250), anti-EGFP (1:600, Molecular Probes; Carlsbad, CA; Cat # A-11122 and 1:500, Nacalai Tesque Inc; Cat # GF090R), and anti-DsRed (1:500, Clontech, Cat # 632496) antibodies were used to identify Wnt1-derived cells. We also used anti-Calretinin (1:5000, Chemicon; Billerica, MA; Cat # AB1550), anti-Calbindin (1:1000, Swant, Cat # CB3a), anti-Parvalbumin (1:1000, Sigma, Cat # P3088-.2ML), and anti-Pax2 (1:50, Invitrogen, Cat # 71-6000) antibodies as biomarkers for different Cb cell types. The secondary antibodies, Alexa 555 (Invitrogen; Cat # A-31572, donkey anti-rabbit IgG; Cat # A21432, donkey anti-goat IgG), Dylight 549 (Jackson ImmunoResearch Laboratories; Cat # 703-505-155, donkey anti-chicken) and Alexa 488 (Invitrogen; Cat # A21208, donkey anti-rabbit IgG; Cat # A-21202 donkey anti-mouse IgG; Cat # A552222, donkey anti-goat IgG; Cat # A-21208; donkey anti-rat IgG) were prepared at 1:500. Rosa26tdTomato, mGFP, and Z/EG littermates were immunolabled (anti-DsRed, anti-β-gal, and anti-EGFP antibodies respectively) to demonstrate that the reporter alleles were not leaky in their expression. Likewise, Wnt1-CreERT;Rosa26tdTomato, Wnt1-CreERT;mGFP, and Wnt1-CreERT;Z/EG mice that received only corn oil (as control for tamoxifen activation) did not show recombination.
Microscopy
Data were collected with a Leica DM600B epifluorescent microscope using Volocity 5.1 imaging software (Improvision). Low magnification images were captured with 2.5× and 5× objectives and high magnification images were obtained using a motorized stage with 10×, 20×, or 40× objectives. True magnifications are indicated by scale bars. All images were pseudo colored live as part of the acquisition palettes. In the 3D module of Volocity 5.1, 3-dimensional renderings were generated from a z-stack of 1 μm optical sections followed by adjusting the density, brightness and contrast. Although the gamma value was unadjusted for routine data processing, gamma values were adjusted from the standard value of 1.0 specifically for 3D rendering. Imaging data sets were exported to Adobe Photoshop CS2 where montages of representative data were generated.
Cell Counting of Wnt1-derived Purkinje Cells
Wnt1-derived Purkinje cells were manually counted on twelve adult sagittal sections from Wnt1-CreERT;mGFP mice (n=3 across two litters for each fate mapping time point). The twelve sections were taken evenly across the full medial to lateral extent of the Cb and sequentially grouped into four categories: medial, medial-intermediate, lateral-intermediate, and lateral. The most lateral section from one fate mapped brain with marking at E13.5 was damaged and unable to be included in this analysis. Average cell counts per section were used to compare how Wnt1 expressing progenitors from distinct developmental stages differentially contribute to the Purkinje cells.
Results
Wnt1 expressing progenitors in r1 have a diverse molecular identity
We initially evaluated Wnt1 expression during Cb development by ISH. Wnt1 was most prominently expressed in the URL between E11.5 and E12.5 (Fig. 1A,E,I,M, arrows), but was also observed at E10.5 and E13.5 (data not shown) consistent with previous reports (Wilkinson et al., 1987). By ISH, we demonstrated that Wnt1 expression was largely complementary to Math1 expression. Specifically, Math1 expression was observed outside the URL in migrating progenitor cells while Wnt1 expression was strictly confined to the URL. Within the URL, Wnt1 overlapped slightly with Math1 anteriorly, but Wnt1 expression extended beyond the Math1 expression domain to delineate the posterior URL (Fig. 1A–B,E–F,I–J,M–N). We used the Wnt1-Venus transgenic line (Brown et al., 2011) to better define the URL. First, we showed that Wnt1-Venus expression largely recapitulated endogenous Wnt1 expression in r1 as shown by comparing ISH with labeled RNA probes for Wnt1 and GFP on adjacent sections from age-matched wildtype and Wnt1-Venus littermates (Fig. S1). ICC with an anti-GFP antibody and biomarkers were then used on sections from Wnt1-Venus transgenic embryos to further characterize the molecular identity of Wnt1 expressing progenitors in r1 (Fig. 1C–D,G–H,K–L,O–P). In particular, we used LMX1a as a marker for the posterior URL and roof plate and OTX2 to delineate the roof plate. At E11.5 and E12.5, a subset of Wnt1 expressing cells expressed LMX1a at the most posterior limit of the URL (Fig. 1C,G,K,O, white arrows). Wnt1 expression also extended into the roof plate where a WNT1+/LMX1a+/OTX2+ domain was observed (Fig. 1C–D,G–H,K–L,O–P, red arrows). In addition, Wnt1 expressing progenitors were positioned anterior to the LMX1a and OTX2 expression domains (Fig. 1C–D,G–H,K–L,O–P, white arrowheads). Collectively, our biomarker analysis revealed molecularly distinct subpopulations of Wnt1 expressing cells within the URL, which are listed from anterior to posterior, as follows: an anterior WNT1+/MATH1+/LMX1a−/OTX2− zone, an intermediate WNT1+/MATH1+/LMX1a+/OTX2−, and a posterior WNT1+/MATH1−/LMX1a+/OTX2− zone. Finally, the migratory stream in medial r1 did not contain any GFP+ cells by ISH or by ICC (Fig. 1A–H) further validating that Wnt1 expression is downregulated before Cb progenitors leave the germinal zone. In contrast, GFP+ cells detected by ICC, but not Wnt1 transcripts, were seen streaming away from the lateral URL at E11.5 and E12.5 (Fig. 1I–P, open arrowheads). The Wnt1 and GFP transcripts were never observed in the migratory stream implicating some GFP protein perdurance (Fig. S1I,L). We exploited this GFP perdurance as a short term lineage tracer and showed that once lateral URL progenitors downregulated Wnt1, they rapidly migrated along the Cb surface. The perdurance of GFP also labeled Wnt1 lineage cells that contributed to the choroid plexus.
Fig. 1. Wnt1 expression in r1.

(A–B,E–F,I–J,M–N) ISH revealed Wnt1 and Math1 expression in the URL (arrow) in wild type mice at E11.5 and E12.5. (C–D,G–H,K–L,O–P) ICC with an anti-GFP antibody and indicated biomarkers on sections from Wnt1-Venus embryos uncovered a population of Wnt1 expressing progenitors (green) coexpressing LMX1a (C,G,K,O red) in the posterior URL (white arrow) and OTX2 (D,H,L,P red) in the roof plate (red arrow). Wnt1 expressing progenitors in the anterior URL did not express either of these markers (solid arrowhead). GFP perdurance was used as a transient lineage tracer and reveals Wnt1-derived cells in the lateral migratory stream (open arrowheads). Scale bar: 61 μm.
The timing of Wnt1 expression in URL progenitors predicts the spatial distribution of the Wnt1 lineage in the adult Cb
The spatial and temporal fate map of the Wnt1 lineage in r1 has not been determined, but would resolve whether Wnt1 expressing cells function merely as a transient signaling center in the URL or if they contribute to Cb cell types. Therefore, we utilized GIFM (reviewed in Joyner and Zervas, 2006; Dymecki and Kim, 2007) with Wnt1-CreERT and conditional reporter mouse lines to permanently mark and track Wnt1 expressing progenitors and their descendants (Zervas et al., 2004; Ellisor et al., 2009; Brown et al., 2011). For this current study, we first verified that the Wnt1-CreERT transgene recapitulated endogenous Wnt1 expression in r1 by comparing ISH with labeled RNA probes for Wnt1 and Cre on adjacent sections (Fig. S2). Next, based on our characterization of Wnt1 and CreERT expression in r1 (Fig. 1,S2), we administered tamoxifen to Wnt1-CreERT;mGFP embryos at E10.5, E11.5, E12.5, or E13.5 to specifically mark and track the Wnt1 lineage derived from the URL.
During embryonic development, deep cerebellar neuron progenitors are the first cell type to emerge from the URL and therefore, we began our analysis by characterizing the Wnt1 contribution to DCN (plane of sectioning shown in Fig. S3). Wnt1 expressing progenitors in r1 marked at E10.5 gave rise to cells within all three DCN (Fig. 2A–C), but preferentially populated the intermediate and lateral DCN (the interpositus and dentate nuclei respectively). Few Wnt1-derived neurons were found within the medial fastigial nuclei. The fastigial nuclei primarily contained fate mapped cells with small nuclei (Fig. 2A, arrowhead) while the interpositus had larger fate mapped cells (Fig. 2B, arrow) and the dentate had a combination of both (Fig. 2C). Wnt1 expressing progenitors marked at E11.5 resulted in the greatest contribution to the DCN and produced both large and small cell types across all three nuclei (Fig. 2D–F). In striking contrast to E10.5 marking, the Wnt1 lineage marked at E12.5 primarily contributed to large neurons in the fastigial nuclei while the few Wnt1-derived cells in the more lateral DCN had smaller nuclei (Fig. 2G–I). Finally, late Wnt1 expressing progenitors (marked from E13.5 onward) did not contribute to the DCN (data not shown). Thus, Wnt1 expressing progenitors contributed to the DCN in a wave that began laterally at E10.5, peaked at E11.5 in all nuclei, and receded in a lateral to medial progression by E12.5. The size of Wnt1-derived DCN neurons also shifted with the extent of contribution.
Fig. 2. Wnt1 expressing progenitors temporally contributed to the DCN.

ICC on adult sagittal sections with antibodies that recognized β-gal (red) or GFP (green) revealed that Wnt1 expressing progenitors contributed to all three DCN. (A–C) The Wnt1 lineage marked at E10.5 preferentially populated the interpositus and dentate nuclei. The Wnt1-derived cells in these two nuclei have larger cell nuclei (arrows) than those in the fastigial nuclei (arrowheads). (D–F) The Wnt1 lineage marked at E11.5 represented the peak of DCN marking. Cells with both large (arrows) and small (arrowheads) nuclei are found across all three DCN. (G–I) The Wnt1 lineage marked at E12.5 preferentially populated the fastigial nuclei while the interpositus and dentate had fewer Wnt1-derived cells. The Wnt1-derived cells in the fastigial nuclei had large cell nuclei (arrows) while those in the lateral DCN had small nuclei (arrowheads). Scale bars: 120 μm (A–I), 30 μm (insets).
The temporal contribution of the Wnt1 lineage to granule cells and unipolar brush cells in the adult Cb
In contrast to early Wnt1 expressing progenitors which substantially contributed to the DCN, the Wnt1 lineage marked later in development predominantly gave rise to granule cells in the adult Cb cortex (Figs 3,4, plane of sectioning shown in Fig. S3). Tamoxifen administration and marking at E11.5 revealed that posterior folia VIII–X of the medial Cb (vermis) were heavily populated with Wnt1-derived granule neurons (Fig. 3A,D) while anterior folia I–V of the vermis had relatively fewer fate mapped cells (Fig. 3A,C). In contrast, Wnt1-derived granule neurons were evenly distributed across all folia in the Cb hemispheres when marked at E11.5 (Fig. 3B,E–F). Tamoxifen administration at E12.5 produced the peak of Wnt1 contribution to granule neurons. Wnt1-derived granule neurons were located in all Cb folia with only a slight posterior bias at the midline (Fig. 4A,C,D). We bracketed these two major marking stages (E11.5 and E12.5) by fate mapping at E10.5 and E13.5 (Fig. 5). We observed only a small cohort of Wnt1-derived granule neurons in the most posterior vermis with marking at E10.5 (Fig. 5A), which increased with marking at E11.5 and E12.5 (Fig. 5B,C), and receded again at E13.5 (Fig. 5D). Thus, Wnt1 expressing progenitors contributed to granule cells in a wave that arose at E10.5 with a medial posterior bias, peaked at E12.5, and diminished by E13.5.
Fig. 3. The Wnt1 lineage marked at E11.5 primarily contributed to the medial-posterior Cb cortex.

ICC on adult sagittal sections with antibodies against β-gal (red) or GFP (green) revealed that Wnt1 expressing cells at E11.5 gave rise to cells in the granular layer. (A,C,D) Medially, Wnt1-derived cells populated every folia, but a substantially greater contribution was seen in folia IX and X. (B,E,F) Laterally, fate mapped cells were evenly distributed across all folia and were less densely populated in the posterior Cb. Scale bars: 1.0 mm (A,B) 61 μm (C–F).
Fig. 4. The Wnt1 lineage marked at E12.5 contributed to the entire Cb cortex.

(A–F) ICC on adult sagittal sections with antibodies against β-gal (red) or GFP (green) revealed that Wnt1 expressing cells at E12.5 populated the granular layer of every folia and represented the peak contribution to this region. Wnt1-derived Purkinje cells were also observed (C,D arrows). Scale bars: 1.0 mm (A,B) 61 μm (C–F).
Fig. 5. Unipolar brush cells are derived from the Wnt1 lineage.

(A–D) ICC on adult sagittal sections with antibodies against β-gal (red) or Calretinin (CALR, green) uncovered that Wnt1 expressing progenitor cells (red) contributed to unipolar brush cells (green) in the granular layer of folia IX and X (arrows). The Wnt1 lineage from E12.5 (C) made the most substantial contribution. Scale bar: 30 μm.
Our GIFM experiments also uncovered Wnt1-derived cells within the granular layer of the posterior vermis that did not have the classic morphology of granule neurons. Since unipolar brush cells reside exclusively in this region (folia IX and X), we assessed these neurons for the expression of calretinin (CALR), a calcium binding protein expressed in a subpopulation of unipolar brush cells (Englund et al., 2006). The Wnt1 lineage contributed moderately to CALR+ unipolar brush cells with marking at E10.5, E11.5, and E13.5 (Fig. 5A,B,D) while marking at E12.5 produced the peak contribution (Fig. 5C). Thus, URL progenitors expressing Wnt1 at E10.5 initiated the contribution to unipolar brush cells and the Wnt1 lineage continued to give rise to unipolar brush cells until E13.5. At each marking stage, β-Gal+/CALR− cells with relatively large nuclei were also seen in the granular layer. Based on their size, these cells were not granule cells and may represent another subpopulation of unipolar brush cells (CALR−) (Englund et al., 2006). Alternatively, these cells may be inhibitory interneurons.
The Wnt1 lineage and ventricular zone derivatives
Surprisingly, the Wnt1 lineage also contributed to neurons within the Purkinje cell layer and molecular layer that are typically derived from the ventricular zone. We used cell-type specific biomarkers in conjunction with anti-β-gal antibodies to determine the cellular identity of these Wnt1-derivatives (Fig. 6). Specifically, Wnt1-derived Purkinje cells were identified by their distinct morphology and the expression of the calcium binding protein, calbindin (CALB, Fig. 6A–C). We took advantage of the sparsity and clarity of labeling and quantified the temporal contribution of the Wnt1 lineage to Purkinje cells (Fig. S4). The Wnt1 lineage produced very few Purkinje cells scattered throughout the entire Cb cortex when marked at marked at E9.5 and E10.5 (0.97 ± 2.02/section and 0.75 ± 1.00/section, respectively) (Fig. S4). A notable increase in Wnt1-derived Purkinje cells was observed by marking at E11.5 (6.89 ± 4.28/section). This wave of Wnt1 contribution to Purkinje cells peaked with tamoxifen administration at E12.5 (16.08 ± 7.64/section) and declined with marking at E13.5 (6.89 ± 7.67/section). Purkinje cells derived from Wnt1 expressing progenitors were evenly distributed in each folia across the medial to lateral extent of the adult Cb (Fig. S4). We also observed a general trend when marking at E11.5 and E12.5 whereby the Wnt1 lineage contributed less to the medial versus intermediate and lateral Cb (Fig. S4). In an independent experiment using the Z/EG reporter (Novak et al., 2000), we identified Wnt1-derived cells located in close apposition to CALB+ Purkinje cells (Fig. 6C,D) that were not seen with the neuron specific mGFP reporter line (Fig. 6A,B). Based on these observations and the cell morphology, we identified these Wnt1-derived cells as Bergmann glia. The neuron specific mGFP reporter also revealed sparse colabeling between the β-gal lineage tracer and inhibitory interneuron markers (PAX2 or Parvalbumin (PARV)) (Fig. 6E–F). Collectively, our biomarker analysis demonstrated that Wnt1 expressing progenitors in r1 contribute to a small cohort of neurons and glia known to be derived from the Cb ventricular zone (Yamada and Watanabe, 2002; Carletti and Rossi, 2008).
Fig. 6. Molecular analysis of the Wnt1 lineage in the adult Cb cortex.

ICC on adult sagittal sections with antibodies recognizing either β-gal or EGFP and cell type specific biomarkers. (A) Three dimensional rendering of a Wnt1-derived neuron marked at E11.5 (using the mGFP reporter) demonstrated the distinct morphology of a Purkinje cell with both nuclear β-gal (red) and membrane bound GFP (green) immunolabeling. (B) The contribution of the Wnt1 lineage to scattered Purkinje cells was confirmed by Calbindin (CALB, green) labeling. (C) Wnt1 fate mapping with the Z/EG reporter revealed that the Wnt1 lineage (green) marked at E11.5 also contributed to Bergmann glia, identified based on their cell morphology and position between Purkinje cells (CALB, red). (D) Three dimensional rendering of the Wnt1-derived Bergmann glia viewed in the XZ plane showed their close apposition with Purkinje cells. (E–F) Antibody labeling against PAX2 (E, green) or PARV (F, green) showed that the Wnt1 lineage marked at E12.5 contributed to a small population of inhibitory interneurons of the granular layer and molecular layer. Scale bar: 30 μm.
Epochs of Wnt1 expression guide the spatial distribution and molecular identity of the Wnt1 lineage in the developing Cb
By conditionally deleting β-catenin in the Wnt1 expression domain, a previous study clearly indicated that secreted WNT1 and the resultant WNT signaling cascade in the mes is vitally important for maintaining the isthmus organizer and patterning the Cb primordia (Brault et al., 2001). Our adult fate mapping results have demonstrated that Wnt1 expressing cells within r1 do not merely constitute a transient signaling center, but rather are true progenitors that contribute to the Cb. These findings suggested that Wnt1 expression within Cb progenitors might cell autonomously instruct the Wnt1 lineage to exhibit specific cell behaviors during development. Therefore, we determined the developmental progression of the Wnt1 lineage using GIFM to link transient Wnt1 expression in r1 progenitors with cell migration, differentiation, and terminal cell fate. In these developmental fate mapping experiments, we used the Rosa26tdTomato (Madisen et al., 2010) to trace the Wnt1 lineage because the mGFP reporter line does not label neuronal progenitors at embryonic stages. We administered tamoxifen to Wnt1-CreERT;Rosa26tdTomato at E10.5, E11.5, E12.5, or E13.5 and analyzed the migratory progress and molecular identity of the Wnt1 lineage at E14.5, E18.5 and P7. We observed that progenitors expressing Wnt1 at specific embryonic stages differentially populate the embryonic and early postnatal Cb (Figs. 7–9).
Fig. 7. Wnt1 expressing progenitors.

ICC with an antibody against tdTomato (DsRed, red) to detect the Wnt1 lineage marked at the indicated stages and analyzed on E14.5 sagittal sections. (A,B,C) The Wnt1 lineage marked at E10.5 was located in the posterior URL (arrowheads), along the surface of the Cb primordia, and within the anterior extent of the intermediate (B) and lateral (C) Cb (arrows). (C,D,E) The Wnt1 lineage marked at E12.5 was positioned throughout the URL (arrowheads) and along the surface of the Cb primordia. However, progenitors expressing Wnt1 at E12.5 did not populate the anterior Cb. In addition, a few fate mapped cells were seen above the ventricular zone with marking at E12.5 (open arrowheads). choroid plexus (cp), midbrain (mb). Scale bar: 120 μm.
Fig. 9. Wnt1 expressing progenitors distinctively contributed to the developing Cb at P7.

ICC with an antibody against tdTomato (DsRed, red) on P7 fate mapped sagittal sections. (A,B) The Wnt1 lineage marked at E10.5 primarily contributed to the Cb core, posterior EGL, and posterior IGL. Wnt1-derived projections (arrowheads) were preferentially located in folia VI–VII and the hemispheres at P7 (C,D) The Wnt1 lineage marked at E11.5 had a similar distribution, but the extent of labeling was increased from marking at E10.5. Wnt1-derived cells populated every folia, but a greater contribution was seen in the posterior vermis. (E,F) The Wnt1 lineage from E12.5 constituted the peak of Cb marking and produced cells within the DCN and Cb cortex. (G,H) The Wnt1 lineage marked at E13.5 contributed substantially to the EGL and Cb cortex with a posterior bias. choroid plexus (cp), midbrain (mb). Scale bar: 250 μm
In short term fate mapping experiments, the Wnt1 lineage marked at E10.5 was located in the posterior URL (arrowheads), along the surface of the Cb primordia, and within the anterior extent of the intermediate and lateral Cb by E14.5 (Fig. 7A–C). In contrast, the Wnt1 lineage marked at E12.5 was positioned throughout the anterior to posterior extent of the URL and more densely packed along the surface of the Cb primordia at E14.5 (Fig. 7D–F). In addition, progenitors with a history of Wnt1 expression at E12.5 only sparsely populate the anterior Cb (Fig. 7D–F). Interestingly, a few fate mapped cells were seen above the ventricular zone with marking at E12.5 and may be the source of the Wnt1-derived inhibitory interneurons (Fig. 7C–E, open arrowheads, insets).
Our intermediate stage lineage analysis showed that by late embryogenesis (E18.5) the Wnt1 lineage marked at E10.5 gave rise to sporadically distributed cells located within the core of the developing Cb and very few cells in the medial URL (Fig. 8A; inset) and posterior external granular layer (EGL) (Fig. 8A, open arrowheads). Notably, no Wnt1-derived cells were found in the lateral URL or EGL at E18.5 (Fig. 8B; inset). With marking at E11.5, the Wnt1 lineage had a similar spatial distribution when analyzed at E18.5 compared to marking a day earlier. However, the contribution to the Cb core, URL, and posterior EGL was greater (Fig. 8C,D). The Wnt1 lineage marked at E12.5 generated cells in the Cb core at E18.5, but the contribution was diminished compared to marking a day earlier (Fig. 8E–F). At this marking stage, the Wnt1 lineage contributed more substantially to the URL and EGL. Similarly, the Wnt1 lineage marked at E13.5 still contributed to the URL and EGL with a posterior bias, but no longer gave rise to cells in the Cb core (Fig. 8G–H). Interestingly, the Wnt1 lineage marked at E12.5 and more so at E13.5 began to delineate the initial sites of foliation at E18.5.
Fig. 8. Wnt1 expressing progenitors differentially migrate away from the URL by E18.5.

ICC with an antibody against tdTomato (DsRed, red) to detect the Wnt1 lineage marked at the indicated stages and analyzed on E18.5 sagittal sections. (A,B) The Wnt1 lineage marked at E10.5 was sparsely scattered within the Cb core, anterior URL (arrows, inset shows higher magnification of the URL), and posterior EGL (open arrowheads). Wnt1-derived projections (arrowheads) ran longitudinally in the lateral Cb and transversely in the medial Cb (projections are shown in more detail in Figure S6). (C,D) The Wnt1 lineage marked at E11.5 had a similar distribution, but the extent of labeling was increased versus marking at E10.5. (E,F) The Wnt1 lineage marked at E12.5 constituted the peak of Cb marking and produced an abundance of labeled cells within the URL, Cb core, and EGL at E18.5. (G,H) The Wnt1 lineage marked at E13.5 contributed substantially to the EGL with a posterior bias. choroid plexus (cp), midbrain (mb). Scale bar: 120 μm.
By P7, the Wnt1 lineage marked at E10.5 sparsely populated the DCN, EGL, and internal granular layer (IGL) of the posterior vermis (Figs. 9A,S5A–C) whilst a more substantial contribution was observed in the EGL and IGL of the hemispheres (Fig. 9B). The Wnt1-derived contribution to the DCN and Cb cortex notably increased with marking at E11.5 (Figs. 9C–D,S5D–F). The Wnt1 lineage substantially populated the posterior vermis, but was more sparsely and evenly distributed in the hemispheres (Fig. 9C–D). The Wnt1 lineage marked at E12.5 generated cells in the DCN, but the contribution was diminished compared to marking a day earlier (Figs. 9E–F,S5G–I). With marking at E12.5, the Wnt1 lineage contribution to the IGL and EGL was strikingly increased from previous fate mapping stages, but continued to exhibit a posterior bias medially, which was not detected laterally (Fig. 9E–F). Finally, the Wnt1 lineage marked at E13.5 still contributed substantially to the IGL and EGL with a posterior bias but no longer gave rise to cells in the DCN at P7 (Fig. 9G–H).
As postnatal development proceeds, Cb precursors settle into their final location, differentiate, and acquire the molecular identity of mature Cb cell types. Therefore, we used a panel of cell-type specific biomarkers in conjunction with anti-DsRed ICC to confirm when Wnt1 expressing progenitors acquired their mature molecular identity. (Fig. 10). As with our adult fate mapping experiments, we used CALR as a marker of unipolar brush cells (Englund et al., 2006), PAX2 as a marker for inhibitory interneurons of the granular layer, and PARV as a marker for Purkinje cells and inhibitory interneurons of the molecular layer. In our P7 analysis, we determined that Wnt1 expressing progenitors substantially contributed to CALR+ unipolar brush cells (Fig. 10A,B,E,F), but only sparsely gave rise to PAX2+ inhibitory interneurons (Fig. 10C,D,G,H), PARV+ Purkinje cells (Fig. 10I,J,M,N), and Bergmann glia (Fig. 10K,L,O,P). These results coincide with the molecular profile of the Wnt1 lineage in the adult and indicate that Wnt1 expressing progenitors differentiate in a time course that is typical for each Cb cell types.
Fig. 10. Molecular analysis of the Wnt1 lineage in the developing Cb cortex.

(A,B,E,F) ICC with antibodies that recognized tdTomato (DsRed, red) or Calretinin (CALR, green) on P7 sagittal sections uncovered that Wnt1 expressing progenitors (red) contributed to unipolar brush cells (green) in folia IX and X. (C,D,G,H) Antibody labeling against PAX2 (green) showed that the Wnt1 lineage gave rise to inhibitory interneurons of the granular layer. (I–P) ICC with Parvalbumin (PARV, green) revealed that the Wnt1 lineage contributed to scattered Purkinje cells (arrows) and Bergmann glia (arrowheads). Scale bar, 61 μm.
The temporal dissection of the Wnt1-derived contribution to the precerebellar system
In our developmental analysis, prominent Wnt1-derived axonal projections from the inferior cerebellar peduncle were observed innervating the lateral Cb with marking at E10.5-E12.5 (Figs. 8,9, arrowheads, and S6). Based on these findings, we further examined how the timing of Wnt1 expression in extra-cerebellar domains was related to the emergence of Wnt1-derived projections within the Cb. Analysis at E18.5 revealed that longitudinally oriented projections entered the Cb laterally, turned perpendicularly, and coursed medially as evidenced by the round appearance of these fascicles in cross section (Figs. 8A–F,S6A–C). At P7, axonal projections from Wnt1-derived neurons marked at E10.5–E12.5 preferentially innervated the central vermis (folia VI–VIII) and lateral hemispheres (Figs. 9A–F,S6D–I). With marking at E13.5, axonal projections innervating the Cb were no longer derived from the Wnt1 lineage (Figs. 8G–H,9G–H).
A group of six hindbrain nuclei known as the precerebellar system, provide the primary source of input to the Cb. Previous cumulative fate mapping studies demonstrated that Wnt1 expressing progenitors in the LRL give rise to cells in the precerebellar system (Rodriguez and Dymecki, 2000; Zervas et al., 2004; Landsberg et al., 2005). With the temporal control of our GIFM system, we built upon this previous work and systematically determined how progenitors expressing Wnt1 at particular developmental stages contribute to each precerebellar nucleus in the adult. Wnt1 expressing progenitors marked at E8.5, E9.5, E10.5, E11.5, E12.5, or E13.5 gave rise to cells in each of the six precerebellar nuclei. Interestingly, the Wnt1 contribution to each nuclei shifted substantially over the course of development (Fig. 11). Specifically, the greatest marking in the vestibular nuclei (VN) occurred with fate mapping at E9.5 (Fig. 11A,B) while peak marking in the lateral reticular nuclei (LRN) was produced by marking at E10.5 and E11.5 (Fig. 11I,J). The external cuneate nuclei (ECN), reticulotegmental nuclei (RTN), and pontine nuclei (PGN) received a more substantial and prolonged contribution from the Wnt1 lineage with a peak from E10.5 to E13.5 (Fig. 11C,D,G,H,K,L). In contrast, the inferior olivary nuclei (ION) contained only a small population of fate mapped cells marked at E10.5 and E11.5 (Fig. 11E,F). Despite the temporal shift in the fate of Wnt1 expressing progenitors, we did not observe any differences in the spatial distribution of Wnt1-derived cells within each nucleus.
Fig. 11. The temporal dissection of the Wnt1 lineage contribution to the precerebellar system.
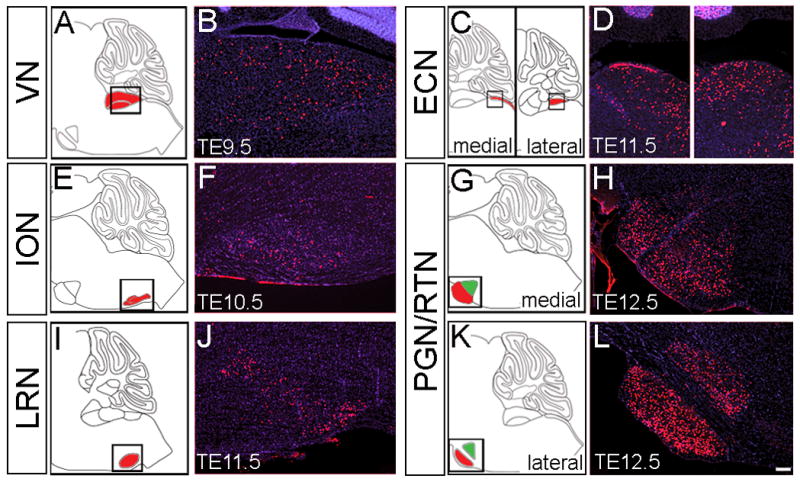
(A,C,E,G,I,K) Sagittal schematics illustrate the section plane used to analyze each precerebellar nuclei. The VN (A), ECN (C), ION (E), PGN (G,K) and LRN (I) are depicted in red and the RTN (G,K) in green. The imaging frame is delineated by the box. (B,D,F,H,J,L) ICC on adult sagittal sections with antibodies against β-gal (red) revealed that Wnt1 expressing progenitors (red) contributed to all six precerebellar nuclei and the magnitude of this contribution shifted across development. (A,B) In the VN, the onset of Wnt1 contribution was at E8.5 with peak marking from E9.5-E11.5; E9.5 is shown. (C,D) In the ECN, the onset of Wnt1 contribution was at E8.5 with a broad peak in marking from E9.5-E13.5; E11.5 marking is shown. (E,F) In the ION, Wnt1-derived neurons were observed with marking at E10.5 and E11.5. (G,H) The PGN had a peak contribution from the Wnt1 lineage marked at E12.5. (I,J) In the LRN, the onset of Wnt1 contribution was at E9.5 with peak marking from E10.5-E13.5. (K,L) The peak contribution to the lateral PGN and RTN was at E12.5. Scale bar: 120 μm.
Discussion
The dynamic nature of Wnt1 expression in the Cb primordia obfuscates how progenitors expressing this gene contribute to the mature Cb. Therefore, we used GIFM to overcome this limitation. GIFM reveals that Wnt1 expressing cells in the URL do not merely comprise a transient signaling center, but rather give rise to spatially and molecularly distinct Cb subpopulations at different embryonic stages. Through the study of other developmental systems, two primary models for cell fate determination have emerged: the progressive lineage restriction model and the competence model. In the progressive lineage restriction model, progenitors are initially able to give rise to all cell classes of a particular tissue, but as development proceeds, their potential becomes progressively limited to fewer and fewer cell types. Alternatively, in the competency model, progenitors pass through multiple waves of competence in which they are able to produce only a subset of cell types (Livesey and Cepko, 2001). Based on these criteria, the Wnt1 lineage is not progressively restricted in its contribution to the Cb and a competency model more appropriately describes how Wnt1 expressing progenitors generate the diverse array of Cb cell types. Moreover, the distinct rise, peak, and fall of marking across different temporal windows indicates that Wnt1 expression is induced de novo in the URL as development progresses. Specifically, early Wnt1 expressing progenitors in r1 primarily contribute to the DCN (E10.5–E12.5) while later Wnt1 expressing progenitors shift to a predominantly granule cell fate (E11.5–E13.5). The contribution of the Wnt1 lineage corresponds well with the migratory profile of these two cell types. For example, at E12.5, granule cell progenitors are just starting to emerge from the URL while DCN progenitors have already completed their migration away from the germinal zone (Fink et al., 2006; Carletti and Rossi, 2008). In contrast, Wnt1 expressing progenitors allocated toward a unipolar brush cell fate express Wnt1 well before these cells migrate away from the URL during late embryogenesis (Englund et al., 2006). These results suggest that Wnt1-derived unipolar brush cell progenitors express Wnt1 relatively early in their cellular development (E10.5-E13.5) and subsequently extinguish Wnt1 expression long before they emerge from the URL. Interestingly, our developmental analysis revealed that early Wnt1 expressing progenitors also ir migration from the URL while later Wnt1 expressing progenitors transition away from the germinal zone. For example, the first granule cells to emerge from the URL normally populate the anterior EGL/IGL while granule cells migrating away from the URL later in embryogenesis fill in behind to inhabit the posterior EGL/IGL (Altman and Bayer, 1997). However, granule cell precursors derived from the Wnt1 lineage marked at E11.5 remain relatively confined to the posterior-most EGL while the Wnt1 lineage marked at E13.5 extends into the anterior EGL at E18.5 and P7. Based on these results, the induction and termination of Wnt1 expression does not regulate when the Wnt1 lineage emerges from the URL. Rather, early Wnt1 expression may be linked to early granule cell differentiation. For example, granule cells derived from the Wnt1 lineage marked at E10.5 and E11.5 are predominantly located in the differentiated EGL by P7 while Wnt1-derived granule cells marked at E12.5 and E13.5 are distributed in both the differentiated EGL and undifferentiated IGL.
Our GIFM experiments reveal a spatial bias of Wnt1 lineage contribution to the Cb. For example, Wnt1-derived neurons populate the lateral DCN before the medial DCN. In contrast, Wnt1-derived granule neurons marked across all time points preferentially reside in the posterior vermis. Interestingly, this posterior bias is not be observed laterally, possibly because the sparsely labeled anterior lobe (lobules I–V) is not contiguous with the Cb hemispheres (Altman and Bayer, 1997). These spatial biases may also reflect the distinct morphogenic movements that establish the location of cell types within the mature Cb. In particular, some granule cells from the lateral URL migrate medially during postnatal development to populate the posterior folia of the vermis (Sgaier et al., 2005). Therefore, the preponderance of Wnt1-derived granule cells in the posterior folia of the medial Cb may be a consequence of this medial migration. Moreover, the spatial differences could indicate a role for Wnt1 in a combinatorial and temporally regulated genetic code that determines cell fate within the URL.
Currently, the URL and ventricular zone are viewed as separate Cb germinal zones that broadly compartmentalize neurogenesis into excitatory and inhibitory progenitor populations (Hoshino et al., 2005; Machold and Fishell, 2005; Wang et al., 2005). Surprisingly, Wnt1 expressing progenitors produce ventricular zone derivatives including inhibitory interneurons and Bergmann glia. Small cohorts of Wnt1-derived inhibitory interneurons are observed at each fate mapping stage and Wnt1 expressing progenitors contribute to Purkinje cells in a distinct temporal wave. If neurogenesis is truly segregated into two germinal zones, our results suggest that cells with a history of Wnt1 expression may extend from the URL into the posterior limit of the ventricular zone. In this regard, Wnt1 expression is primarily restricted to the URL but a promiscuous interface between the URL and ventricular zone allows some cells at the interface to enter the adjacent domain. Our short term fate mapping analysis identified sparse Wnt1-derived cells near the ventricular zone at E14.5, which may serve as the source for our Wnt1-derived inhibitory interneurons. Alternatively, faint expression of CreERT beyond the URL in some sections from our Wnt1-CreERT transgenic line could account for the ventricular zone derivatives observed in this fate mapping study (Fig S2). However, this explanation is unlikely because CreERT in situ labeling outside the URL is similar to background levels. More importantly, our Wnt1 fate mapping results are supported by earlier studies using β-gal perdurance in Wnt1-LacZ transgenic mice (Nichols and Bruce, 2006) and GFP perdurance in wnt1-GVP-UG transgenic zebrafish (Volkmann et al., 2010) to transiently follow progenitors with a history of Wnt1 expression. Furthermore, Wnt1 has a comparable expression domain to Wnt3a in the URL and the Wnt3a lineage gives rise to similar Cb cell types as the Wnt1 lineage (Louvi et al., 2007). Therefore, the most parsimonious explanation for our results is that the interface between the URL and the ventricular zone is not a rigid partition and although the Wnt1 lineage produces some ventricular zone derivatives, Wnt1 expressing progenitors primarily contribute to the DCN, granule cells, and unipolar brush cells.
Within each germinal zone, Cb progenitors are subdivided based on their molecular identity (Morales and Hatten, 2006; Zordan et al., 2008; Liu et al., 2010). Our characterization of Wnt1 expression in URL demonstrates an increasingly complex molecular heterogeneity in this dynamic germinal zone. Previous studies describing Math1 and Lmx1a expression in the URL showed that the posterior limit of Math1 intermingles with the Lmx1a expression domain (Akazawa et al., 1995; Chizhikov et al., 2010). Our findings show that Wnt1 expression bridges the Otx2, Lmx1a, and Math1 domains. Therefore, Wnt1 expressing progenitors in URL can be partitioned into three molecularly distinct rostral to caudal zones: 1. WNT1+/MATH1+/LMX1a−, 2. WNT1+/MATH1+/LMX1a+, and 3. WNT1+/MATH1−/LMX1a+. By integrating our Wnt1 GIFM results with Math1 and Lmx1a fate mapping, we can construct a basic model for how combinatorial gene expression patterns in the URL are translated into cell fate during development. Both Wnt1 and Math1 fate mapping experiments reveal that DCN neurons are derived from marking at E10.5-E12.5 (Machold and Fishell, 2005). In contrast, the Lmx1a lineage does not produce DCN neurons (Chizhikov et al., 2010). Therefore, a cohort of DCN progenitors are Wnt1+/Math1+/Lmx1a−, consistent with URL zone 1. Granule cells are differentially derived from the Wnt1 lineage (marking at E10.5-E13.5) versus Math1 lineage (marking at E12.5 through postnatal stages) (Machold and Fishell, 2005). The Lmx1a lineage also gives rise to granule cells (Chizhikov et al., 2010). These findings suggest that Wnt1 expressing progenitors migrate from URL zone 3 to zone 1 coincident with the upregulation of Math1 and subsequent downregulation of Lmx1a. This transition is consistent with the role of Math1 in initiating the migration of progenitors away from the URL (Machold and Fishell, 2005) and the proposed role of Lmx1a in repressing Math1 expression to prevent premature migration of URL progenitors (Chizhikov et al., 2010).
The precise molecular interactions between LMX1a, WNT1 and MATH1 in the URL remain unresolved. However, Wnt1−/− mutants display decreased Math1 expression in the LRL (Ikeya et al., 1997). Moreover, β-catenin, a downstream component of canonical WNT signaling, binds to the Math1 enhancer and promotes Math1 expression (Shi et al., 2010). These findings suggest that Wnt1 signaling promotes Math1 expression in the URL. To test whether β-catenin is active in the URL, we assessed embryos expressing TOPGAL, a reporter for canonical WNT signaling (DasGupta and Fuchs, 1999). We rarely detected WNT responding cells in the URL although responsive cells were detected in other locations (Fig. S7, data not shown). Therefore, Wnt1 may act through non-canonical pathways (Spinsanti et al., 2008) to regulate Math1 expression in the URL. Alternatively, canonical WNT signaling in the URL might be below the particular threshold required for detection by the TOPGAL reporter. Finally, Wnt1 expression is downregulated before Cb progenitors migrate away from URL zone 3 suggesting that WNT1 is not required for the continued maintenance of Math1 expression outside of the URL.
Cumulative and intersectional fate mapping approaches have spatially dissected the LRL and linked molecularly distinct progenitor domains to cell fate in the precerebellar system (Rodriguez and Dymecki, 2000; Landsberg et al., 2005; Wang et al., 2005; Yamada and Watanabe, 2002; Ray and Dymecki, 2009). Moreover, previous work determined that Wnt1 expressing progenitors contribute to the precerebellar nuclei (Zervas et al., 2004; Landsberg et al., 2005). Our GIFM study expands upon those results by providing detailed temporal resolution to the Wnt1 fate map in the precerebellar system. We found that the marking stages that generated the peak Wnt1 contribution to each precerebellar nuclei correspond to the birthdate of that particular nucleus (Altman and Bayer, 1997). In addition, the Wnt1 lineage gives rise to the precerebellar system at the same developmental stages in which Wnt1 expressing progenitors in the URL establish the cytoarchitecture of the Cb. Finally, Wnt1-derived axonal projections from the precerebellar system innervate regions populated by Cb descendants of the Wnt1 lineage. Perhaps Wnt1 expression facilitates a molecular matching between the precerebellar nuclei with their Cb targets. In this regard, the spatial and temporal regulation of Wnt1 has the potential to form an entirely Wnt1 derived neural circuit in the Cb.
Conclusions
In summary, this study successfully used a novel transgenic reporter allele, Wnt1-Venus, to molecularly dissect the URL and uncovered three molecularly distinct developmental zones based on the expression of Wnt1, Math1, and Lmx1a. By fate mapping the Wnt1 lineage, we determined that Wnt1 expressing cells in the URL are not merely a transient signaling center, but serve as true Cb progenitors. In particular, the Wnt1 lineage gives rise to many excitatory Cb cell types as well as sparse inhibitory neurons and Bergmann glia. More importantly, the temporal dissection of the Wnt1 lineage revealed that Wnt1 expressing progenitors produce each Cb cell type in a distinct wave of contribution demonstrating that Wnt1 expression is induced de novo in URL progenitors. In general, the temporal fate map of the Wnt1 lineage in both the Cb and precerebellar system corresponded well with the birth order of each cell type. However, within each Cb cell class, early Wnt1 expression did not necessarily translate into early migration from the URL. In this regard, Wnt1 expressing cells are a valuable progenitor pool for the Cb and precerebellar system, but the specific role for Wnt1 in the rhombic lip remains unknown.
Supplementary Material
(A–L) ISH revealed Wnt1 and GFP expression in the URL (arrow) in wildtype (A,D,G,J; same as Fig. 1) and Wnt1-Venus (B–C,E–F,H–I,K–L) embryos at E11.5 and E12.5. Arrows indicate the URL; open arrowheads indicate absence of Wnt1 in migrating cells. Scale bar: 61 μm
Fig. S2. Validation of theWnt1-CreERT transgenic line in r1
(A–F) ISH with RNA probes for CreERT and Wnt1 revealed that CreERT expression in Wnt1-CreERT mice mimics endogenous Wnt1 expression in the URL. Scale bar: 61 μm.
(A) Whole mount schematic of adult brain sections illustrating the location of sagittal tissue sections. (B–F) Medial (B,C), intermediate (D) and lateral (E) planes of section used to analyze the Wnt1 lineage in the DCN (Fig 2) and Cb cortex (Figs 3,4).
The bar graph depicts the average number of Wnt1-derived Purkinje cells per section in the medial (blue), medial intermediate (green), lateral intermediate (yellow), and lateral (red) Cb for each fate mapping stage.
ICC on P7 sagittal sections with an antibody against tdTomato (DsRed, red) revealed that Wnt1 expressing progenitors contributed to all three DCN. (A–C) The Wnt1 lineage marked at E10.5 moderately populated each nuclei. (D–F) The Wnt1 lineage marked at E11.5 represented the peak contribution to the DCN. (G–I) The Wnt1 lineage marked at E12.5 preferentially populated the fastigial nuclei while the interpositus and dentate nuclei had fewer Wnt1-derived cells. Scale bar: 61 μm.
ICC on sagittal sections with an antibody against tdTomato (DsRed, red) revealed Wnt1-derived circuitry in the Cb. (A–C) At, E18.5, Wnt1-derived axonal projections ran longitudinally in the lateral Cb. (D–I) At P7, the Wnt1-derived projections preferentially populated the central and posterior vermis and the lateral hemispheres. Scale bar: 61 μm (A–C), 250 μm (D–I).
ICC with antibodies that recognize β-gal (red) and GFP (green) on sagittal sections from Wnt1-Venus;TOPGAL embryos at E12.5 revealed β-catenin (red) and Wnt1 (green) expression (URL, arrows). Scale bar: 61 μm.
Acknowledgments
We are grateful to S. Arber for the mGFP mice, to A. Joyner for the Wnt1-Venus mice, and to members of the Zervas lab who critically read the paper and provided technical assistance. N. Hagan was supported by an NINDS training grant (1T32NS062443, Brown University Department of Neuroscience) and by a Brain Science Program Graduate Research Award, through the Brain Science Program Reisman Fund. This research was also funded by startup research funds (MZ).
References
- Akazawa C, Ishibashi M, Shimizu C, Nakanishi S, Kageyama R. A mammalian helix-loop-helix factor structurally related to the product of Drosophila proneural gene atonal is a positive transcriptional regulator expressed in the developing nervous system. J Biol Chem. 1995;270:8730–8738. doi: 10.1074/jbc.270.15.8730. [DOI] [PubMed] [Google Scholar]
- Altman J, Bayer S. Development of the cerebellar system in relation to its evolution, structure, and function. CRC Press; Boca Raton, FL: 1997. [Google Scholar]
- Bally-Cuif L, Cholley B, Wassef M. Involvement of Wnt-1 in the formation of the mes/metencephalic boundary. Mech Dev. 1995;53:23–34. doi: 10.1016/0925-4773(95)00421-1. [DOI] [PubMed] [Google Scholar]
- Brault V, Moore R, Kutsch S, Ishibashi M, Rowitch DH, McMahon AP, Sommer L, Boussadia O, Kemler R. Inactivation of the beta-catenin gene by Wnt1-Cre-mediated deletion results in dramatic brain malformation and failure of craniofacial development. Development. 2001;128:1253–1264. doi: 10.1242/dev.128.8.1253. [DOI] [PubMed] [Google Scholar]
- Brown A, Brown S, Ellisor D, Hagan N, Normand E, Zervas M. A Practical Approach to Genetic Inducible Fate Mapping: A Visual Guide to Mark and Track Cells In Vivo. J Vis Exp. 2009;43:1687. doi: 10.3791/1687. pii. [DOI] [PMC free article] [PubMed] [Google Scholar]
- Brown A, Machan JT, Zervas M. Molecular organization and timing of Wnt1 expression define cohorts of midbrain dopamine neuron progenitors in vivo. J Comp Neurol. 2011;519:2978–3000. doi: 10.1002/cne.22710. [DOI] [PMC free article] [PubMed] [Google Scholar]
- Carletti B, Rossi F. Neurogenesis in the cerebellum. Neuroscientist. 2008;14:91–100. doi: 10.1177/1073858407304629. [DOI] [PubMed] [Google Scholar]
- Chizhikov VV, Lindgren AG, Mishima Y, Roberts RW, Aldinger KA, Miesegaes GR, Currle DS, Monuki ES, Millen KJ. Lmx1a regulates fates and location of cells originating from the cerebellar rhombic lip and telencephalic cortical hem. Proc Natl Acad Sci U S A. 2010;107:10725–10730. doi: 10.1073/pnas.0910786107. [DOI] [PMC free article] [PubMed] [Google Scholar]
- Danielian PS, McMahon AP. Engrailed-1 as a target of the Wnt-1 signalling pathway in vertebrate midbrain development. Nature. 1996;383:332–334. doi: 10.1038/383332a0. [DOI] [PubMed] [Google Scholar]
- DasGupta R, Fuchs E. Multiple roles for activated LEF/TCF transcription complexes during hair follicle development and differentiation. Development. 1999;126:4557–4568. doi: 10.1242/dev.126.20.4557. [DOI] [PubMed] [Google Scholar]
- Dymecki SM, Kim JC. Molecular neuroanatomy’s “Three Gs”: a primer. Neuron. 2007;54:17–34. doi: 10.1016/j.neuron.2007.03.009. [DOI] [PMC free article] [PubMed] [Google Scholar]
- Ellisor D, Koveal D, Hagan N, Brown A, Zervas M. Comparative analysis of conditional reporter alleles in the developing embryo and embryonic nervous system. Gene Expr Patterns. 2009;9:475–489. doi: 10.1016/j.gep.2009.07.007. [DOI] [PMC free article] [PubMed] [Google Scholar]
- Ellisor D, Zervas M. Tamoxifen dose response and conditional cell marking: is there control? Mol Cell Neurosci. 2010;45:132–138. doi: 10.1016/j.mcn.2010.06.004. [DOI] [PubMed] [Google Scholar]
- Englund C, Kowalczyk T, Daza RA, Dagan A, Lau C, Rose MF, Hevner RF. Unipolar brush cells of the cerebellum are produced in the rhombic lip and migrate through developing white matter. J Neurosci. 2006;26:9184–9195. doi: 10.1523/JNEUROSCI.1610-06.2006. [DOI] [PMC free article] [PubMed] [Google Scholar]
- Fink AJ, Englund C, Daza RA, Pham D, Lau C, Nivison M, Kowalczyk T, Hevner RF. Development of the deep cerebellar nuclei: transcription factors and cell migration from the rhombic lip. J Neurosci. 2006;26:3066–3076. doi: 10.1523/JNEUROSCI.5203-05.2006. [DOI] [PMC free article] [PubMed] [Google Scholar]
- Guo Q, Loomis C, Joyner AL. Fate map of mouse ventral limb ectoderm and the apical ectodermal ridge. Dev Biol. 2003;264:166–178. doi: 10.1016/j.ydbio.2003.08.012. [DOI] [PubMed] [Google Scholar]
- Hippenmeyer S, Vrieseling E, Sigrist M, Portmann T, Laengle C, Ladle DR, Arber S. A developmental switch in the response of DRG neurons to ETS transcription factor signaling. PLoS Biol. 2005;3:e159. doi: 10.1371/journal.pbio.0030159. [DOI] [PMC free article] [PubMed] [Google Scholar]
- Hoshino M, Nakamura S, Mori K, Kawauchi T, Terao M, Nishimura YV, Fukuda A, Fuse T, Matsuo N, Sone M, Watanabe M, Bito H, Terashima T, Wright CV, Kawaguchi Y, Nakao K, Nabeshima Y. Ptf1a, a bHLH transcriptional gene, defines GABAergic neuronal fates in cerebellum. Neuron. 2005;47:201–213. doi: 10.1016/j.neuron.2005.06.007. [DOI] [PubMed] [Google Scholar]
- Ikeya M, Lee SM, Johnson JE, McMahon AP, Takada S. Wnt signalling required for expansion of neural crest and CNS progenitors. Nature. 1997;389:966–970. doi: 10.1038/40146. [DOI] [PubMed] [Google Scholar]
- Joyner AL, Zervas M. Genetic inducible fate mapping in mouse: establishing genetic lineages and defining genetic neuroanatomy in the nervous system. Dev Dyn. 2006;235:2376–2385. doi: 10.1002/dvdy.20884. [DOI] [PubMed] [Google Scholar]
- Kimmel RA, Turnbull DH, Blanquet V, Wurst W, Loomis CA, Joyner AL. Two lineage boundaries coordinate vertebrate apical ectodermal ridge formation. Genes Dev. 2000;14:1377–1389. [PMC free article] [PubMed] [Google Scholar]
- Landsberg RL, Awatramani RB, Hunter NL, Farago AF, DiPietrantonio HJ, Rodriguez CI, Dymecki SM. Hindbrain rhombic lip is comprised of discrete progenitor cell populations allocated by Pax6. Neuron. 2005;48:933–947. doi: 10.1016/j.neuron.2005.11.031. [DOI] [PubMed] [Google Scholar]
- Liu A, Joyner AL. Early anterior/posterior patterning of the midbrain and cerebellum. Annu Rev Neurosci. 2001;24:869–896. doi: 10.1146/annurev.neuro.24.1.869. [DOI] [PubMed] [Google Scholar]
- Liu ZR, Shi M, Hu ZL, Zheng MH, Du F, Zhao G, Ding YQ. A refined map of early gene expression in the dorsal rhombomere 1 of mouse embryos. Brain Res Bull. 2010;82:74–82. doi: 10.1016/j.brainresbull.2010.02.010. [DOI] [PubMed] [Google Scholar]
- Livesey FJ, Cepko CL. Vertebrate neural cell-fate determination: lessons from the retina. Nat Rev Neurosci. 2001;2:109–118. doi: 10.1038/35053522. [DOI] [PubMed] [Google Scholar]
- Louvi A, Yoshida M, Grove EA. The derivatives of the Wnt3a lineage in the central nervous system. J Comp Neurol. 2007;504:550–569. doi: 10.1002/cne.21461. [DOI] [PubMed] [Google Scholar]
- Machold R, Fishell G. Math1 is expressed in temporally discrete pools of cerebellar rhombic-lip neural progenitors. Neuron. 2005;48:17–24. doi: 10.1016/j.neuron.2005.08.028. [DOI] [PubMed] [Google Scholar]
- Madisen L, Zwingman TA, Sunkin SM, Oh SW, Zariwala HA, Gu H, Ng LL, Palmiter RD, Hawrylycz MJ, Jones AR, Lein ES, Zeng H. A robust and high-throughput Cre reporting and characterization system for the whole mouse brain. Nat Neurosci. 2010;13:133–140. doi: 10.1038/nn.2467. [DOI] [PMC free article] [PubMed] [Google Scholar]
- McMahon AP, Bradley A. The Wnt-1 (int-1) proto-oncogene is required for development of a large region of the mouse brain. Cell. 1990;62:1073–1085. doi: 10.1016/0092-8674(90)90385-r. [DOI] [PubMed] [Google Scholar]
- McMahon AP, Joyner AL, Bradley A, McMahon JA. The midbrain-hindbrain phenotype of Wnt-1-/Wnt-1- mice results from stepwise deletion of engrailed-expressing cells by 9.5 days postcoitum. Cell. 1992;69:581–595. doi: 10.1016/0092-8674(92)90222-x. [DOI] [PubMed] [Google Scholar]
- Morales D, Hatten ME. Molecular markers of neuronal progenitors in the embryonic cerebellar anlage. J Neurosci. 2006;26:12226–12236. doi: 10.1523/JNEUROSCI.3493-06.2006. [DOI] [PMC free article] [PubMed] [Google Scholar]
- Nichols DH, Bruce LL. Migratory routes and fates of cells transcribing the Wnt-1 gene in the murine hindbrain. Dev Dyn. 2006;235:285–300. doi: 10.1002/dvdy.20611. [DOI] [PubMed] [Google Scholar]
- Novak A, Guo C, Yang W, Nagy A, Lobe CG. Z/EG, a double reporter mouse line that expresses enhanced green fluorescent protein upon Cre-mediated excision. Genesis. 2000;28:147–155. [PubMed] [Google Scholar]
- Ray RS, Dymecki SM. Rautenlippe Redux -- toward a unified view of the precerebellar rhombic lip. Curr Opin Cell Biol. 2009;21:741–747. doi: 10.1016/j.ceb.2009.10.003. [DOI] [PMC free article] [PubMed] [Google Scholar]
- Rodriguez CI, Dymecki SM. Origin of the precerebellar system. Neuron. 2000;27:475–486. doi: 10.1016/s0896-6273(00)00059-3. [DOI] [PubMed] [Google Scholar]
- Sgaier SK, Millet S, Villanueva MP, Berenshteyn F, Song C, Joyner AL. Morphogenetic and cellular movements that shape the mouse cerebellum; insights from genetic fate mapping. Neuron. 2005;45:27–40. doi: 10.1016/j.neuron.2004.12.021. [DOI] [PubMed] [Google Scholar]
- Shi F, Cheng YF, Wang XL, Edge AS. Beta-catenin up-regulates Atoh1 expression in neural progenitor cells by interaction with an Atoh1 3′ enhancer. J Biol Chem. 2010;285:392–400. doi: 10.1074/jbc.M109.059055. [DOI] [PMC free article] [PubMed] [Google Scholar]
- Spinsanti P, De Vita T, Caruso A, Melchiorri D, Misasi R, Caricasole A, Nicoletti F. Differential activation of the calcium/protein kinase C and the canonical beta-catenin pathway by Wnt1 and Wnt7a produces opposite effects on cell proliferation in PC12 cells. J Neurochem. 2008;104:1588–1598. doi: 10.1111/j.1471-4159.2007.05111.x. [DOI] [PubMed] [Google Scholar]
- Sunmonu NA, Li K, Guo Q, Li JY. Gbx2 and Fgf8 are sequentially required for formation of the midbrain-hindbrain compartment boundary. Development. 2011;138:725–34. doi: 10.1242/dev.055665. [DOI] [PMC free article] [PubMed] [Google Scholar]
- Thomas KR, Musci TS, Neumann PE, Capecchi MR. Swaying is a mutant allele of the proto-oncogene Wnt-1. Cell. 1991;67:969–976. doi: 10.1016/0092-8674(91)90369-a. [DOI] [PubMed] [Google Scholar]
- Volkmann K, Chen YY, Harris MP, Wullimann MF, Köster RW. The zebrafish cerebellar upper rhombic lip generates tegmental hindbrain nuclei by long-distance migration in an evolutionary conserved manner. J Comp Neurol. 2010;518:2794–2817. doi: 10.1002/cne.22364. [DOI] [PubMed] [Google Scholar]
- Wang VY, Rose MF, Zoghbi HY. Math1 expression redefines the rhombic lip derivatives and reveals novel lineages within the brainstem and cerebellum. Neuron. 2005;48:31–43. doi: 10.1016/j.neuron.2005.08.024. [DOI] [PubMed] [Google Scholar]
- Wilkinson DG, Bailes JA, McMahon AP. Expression of the proto-oncogene int-1 is restricted to specific neural cells in the developing mouse embryo. Cell. 1987;50:79–88. doi: 10.1016/0092-8674(87)90664-7. [DOI] [PubMed] [Google Scholar]
- Yamada K, Watanabe M. Cytodifferentiation of Bergmann glia and its relationship with Purkinje cells. Anat Sci Int. 2002;77:94–108. doi: 10.1046/j.0022-7722.2002.00021.x. [DOI] [PubMed] [Google Scholar]
- Zervas M, Millet S, Ahn S, Joyner AL. Cell behaviors and genetic lineages of the mesencephalon and rhombomere 1. Neuron. 2004;43:345–357. doi: 10.1016/j.neuron.2004.07.010. [DOI] [PubMed] [Google Scholar]
- Zordan P, Croci L, Hawkes R, Consalez GG. Comparative analysis of proneural gene expression in the embryonic cerebellum. Dev Dyn. 2008;237:1726–1735. doi: 10.1002/dvdy.21571. [DOI] [PubMed] [Google Scholar]
Associated Data
This section collects any data citations, data availability statements, or supplementary materials included in this article.
Supplementary Materials
(A–L) ISH revealed Wnt1 and GFP expression in the URL (arrow) in wildtype (A,D,G,J; same as Fig. 1) and Wnt1-Venus (B–C,E–F,H–I,K–L) embryos at E11.5 and E12.5. Arrows indicate the URL; open arrowheads indicate absence of Wnt1 in migrating cells. Scale bar: 61 μm
Fig. S2. Validation of theWnt1-CreERT transgenic line in r1
(A–F) ISH with RNA probes for CreERT and Wnt1 revealed that CreERT expression in Wnt1-CreERT mice mimics endogenous Wnt1 expression in the URL. Scale bar: 61 μm.
(A) Whole mount schematic of adult brain sections illustrating the location of sagittal tissue sections. (B–F) Medial (B,C), intermediate (D) and lateral (E) planes of section used to analyze the Wnt1 lineage in the DCN (Fig 2) and Cb cortex (Figs 3,4).
The bar graph depicts the average number of Wnt1-derived Purkinje cells per section in the medial (blue), medial intermediate (green), lateral intermediate (yellow), and lateral (red) Cb for each fate mapping stage.
ICC on P7 sagittal sections with an antibody against tdTomato (DsRed, red) revealed that Wnt1 expressing progenitors contributed to all three DCN. (A–C) The Wnt1 lineage marked at E10.5 moderately populated each nuclei. (D–F) The Wnt1 lineage marked at E11.5 represented the peak contribution to the DCN. (G–I) The Wnt1 lineage marked at E12.5 preferentially populated the fastigial nuclei while the interpositus and dentate nuclei had fewer Wnt1-derived cells. Scale bar: 61 μm.
ICC on sagittal sections with an antibody against tdTomato (DsRed, red) revealed Wnt1-derived circuitry in the Cb. (A–C) At, E18.5, Wnt1-derived axonal projections ran longitudinally in the lateral Cb. (D–I) At P7, the Wnt1-derived projections preferentially populated the central and posterior vermis and the lateral hemispheres. Scale bar: 61 μm (A–C), 250 μm (D–I).
ICC with antibodies that recognize β-gal (red) and GFP (green) on sagittal sections from Wnt1-Venus;TOPGAL embryos at E12.5 revealed β-catenin (red) and Wnt1 (green) expression (URL, arrows). Scale bar: 61 μm.