Abstract
Thanks to the confluence of genome sequencing and bioinformatics, the number of metabolic databases has expanded from a handful in the mid 1990s to several thousand today. These databases lie within distinct families that have common ancestry and common attributes. The main families are the MetaCyc, KEGG, Reactome, Model SEED, and BiGG families. We survey these database families, as well as important individual metabolic databases, including multiple human metabolic databases. The MetaCyc family is described in particular detail. It contains well over 1,000 databases, including highly curated databases for Escherichia coli, Saccharamyces cerevisiae, Mus musculus, and Arabidopsis thaliana. These databases are available through a number of web sites that offer a range of software tools for querying and visualizing metabolic networks. These web sites also provide multiple tools for analysis of gene expression and metabolomics data, including visualization of those datasets on metabolic network diagrams, and overrepresentation analysis of gene sets and metabolite sets.
Introduction
A large number of metabolic databases have been developed during the last two decades to describe the known and predicted metabolism of a wide variety of organisms. Initially small in number, thousands of databases are now available, and constitute an important resource for researchers in toxicology, metabolic engineering, drug discovery, and many other disciplines. This article surveys metabolic databases with an emphasis on the MetaCyc family.
It is the confluence of genome sequencing and bioinformatics that has yielded this large number of metabolic databases. Genome sequencing efforts have produced complete genome sequences for more than one thousand organisms to date, and the pace of sequencing is accelerating. Bioinformaticists have developed computational methods for predicting the locations and functions of genes in a sequenced genome, and the field of pathway bioinformatics has developed algorithms for predicting the presence of metabolic pathways in a sequenced genome. Methods for predicting gene functions and pathways take similar approaches: gene functions are predicted by programs that detect similarity between the sequences of newly sequenced genes and previously sequenced genes of known function. Analogously, computational pathway prediction methods recognize previously elucidated pathways based on the set of enzymes present in a genome.
Survey of Metabolic Databases
We classify metabolic databases into major families that reflect their lineage and similar properties. The first four database (DB) families in Table 1 have a shared lineage in that each one uses its own reference pathway database to computationally predict the pathways present in a sequenced organism. For example, each organism-specific DB in the MetaCyc family is derived from MetaCyc, and each organism-specific database in the KEGG family is derived from the KEGG reference pathway database. Note that many singleton DBs containing valuable information exist outside the families listed in Table 1.
Table 1. The main families of metabolic databases and their properties.
Curation means manual entry of detailed information from the biomedical literature, supported by citations to the literature. Genome means availability of genome sequence and map information. Proteome means availability of properties of metabolic enzymes such as subunit structure, inhibitors, and cofactors. Metabolites means availability of chemical data on metabolites. Pathways means availability of pathway-related data and diagrams.
| Database family | MetaCyc | KEGG | Model SEED | Reactome | BiGG |
|---|---|---|---|---|---|
| web address | biocyc.org | www.genome.jp/kegg/ | www.theseed.org/models | www.reactome.org | bigg.ucsd.edu |
| curation | + | − | − | + | + |
| number of organisms | >1000 | >1000 | >200 | 21 | 6 |
| genome | + | + | + | − | − |
| proteome | + | + | + | + | − |
| reactions | + | + | + | + | + |
| metabolites | + | + | + | + | + |
| pathways | + | + | + | + | − |
| registration required | −a | − | −a | − | + |
(registration is required for building models, but not for viewing existing models)
The databases within each of the DB families listed in Table 1 have common properties. They share a common DB schema and the same set of software tools is used to query and manipulate the DBs in each family. DBs in each family also tend to share common methodologies, such as the approach to curation. The DBs in the BiGG family were not computationally derived from a common reference DB —- each DB was created through a manual process. But these DBs do share a common lineage in that all were created bythe group of Dr. B. Palsson at the University of California San Diego (Schellenberger et al. 2010). The DBs in the Model SEED family (Henry et al. 2010) were created by the SEED team using a custom pipeline that involves a combination of automated and manual steps. In contrast, DBs within the KEGG (Kanehisa et al. 2010) and MetaCyc (Caspi et al. 2010) families [and Reactome, to a smaller degree (Croft et al. 2010)], were created by many different research groups that made use of the KEGG or MetaCyc reference DBs, and the KEGG or MetaCyc software tools. The KEGG and MetaCyc families each contain more than one thousand organisms from all domains of life.
Metabolic DBs differ along a number of other dimensions in addition to their family membership. We consider the following additional dimensions: the types of data they contain, and the amount of manual curation they have received.
Types of data available
The MetaCyc, KEGG, and Model SEED families provide genome data in conjunction with their metabolic data, such as genome map viewers and access to nucleotide and amino-acid sequence data. Reactome and BiGG do not provide genome data. These tools allow users to view the chromosomal organization of genes coding for a given pathway. In addition, some databases within the MetaCyc family provide extensive regulatory data (e.g., EcoCyc).
KEGG and MetaCyc each provide approximately 9,000 biochemical reactions. Reactome provides 3,800 reactions for its human database, and the remaining databases are probably subsets of those 3,800 reactions since Reactome uses its human database as the reference for predicting reactions and pathways in other organisms.
The KEGG and MetaCyc families are based on fairly different notions of biological pathways (Green and Karp 2006). KEGG reference pathways are typically mosaics of related pathways and reactions from multiple species. KEGG pathways are typically 3 to 4 times larger than are MetaCyc pathways because MetaCyc pathways attempt to model individual biological pathways from individual organisms. For example, the KEGG pathway called “methionine metabolism” combines pathways for the biosynthesis of methionine, charging of methionyl-tRNA, and conversion of methionine to other compounds such as N-formyl-methionine. MetaCyc defines pathways that correspond to a single biological function, are regulated as a unit, and are conserved through evolution.
Databases in the BiGG and Model SEED families differ from the other families in containing constraint-based equilibrium models of the metabolic networks of each organism. The models in BiGG were manually constructed, whereas those in Model SEED were constructed computationally. These models can be used to predict essential metabolic genes and to predict growth media for an organism. Similar models will be available for the MetaCyc family in the near future.
Curation level
The different families have different approaches to curation, meaning manual incorporation of information from the biomedical literature into their databases. All the families undergo some amount of manual curation. For the KEGG family, the majority of curation occurs for reference pathways only, and includes only the basic pathway structure, reactions, and compounds. BiGG goes a bit further, sometimes including short commentary and literature references. Curated MetaCyc and Reactome family databases include multi-paragraph minireviews for proteins and pathways, and include extensive literature citations – this information helps explain the biological role of a pathway or an enzyme, and clearly identifies the source of information. Curated MetaCyc family databases go still further in extracting many additional data from publications including enzyme cofactors, activators, inhibitors, subunit composition, and kinetic constants, along with citations to the source of each datum.
Table 2 lists individual metabolic DBs that focus on a narrower range of data content than the DB families previously considered. The BRENDA DB contains extremely comprehensive information on individual enzymes, including reactions and compounds. It covers more than 79,000 individual reactions from 10,500 organisms, and the information in BRENDA is distilled from more than 100,000 references (Scheer et al. 2010). The ExplorEnz (McDonald et al. 2009) and ENZYME DBs (Bairoch 2000) describe the enzymes and enzyme-catalyzed reactions that have been classified by the enzyme nomenclature committee of the International Union of Biochemistry and Molecular Biology (the EC enzyme classification system). The RHEA database describes the EC classification system plus many additional enzyme-catalyzed reactions. UniPathway is a metabolic pathway database that uses RHEA reactions, and is primarily designed to provide a structured controlled vocabulary for use in UniProt to describe the role of proteins in metabolic pathways.
Table 2.
Additional metabolic databases
| Database | Web address | Description |
|---|---|---|
| BRENDA | www.brenda-enzymes.info | Large collection of enzyme functional data |
| ENZYME | ||
| ExplorEnz | enzyme-database.org | Official database of the International Union of Biochemistry and Molecular Biology (IUBMB) Enzyme Nomenclature List |
| RHEA | www.ebi.ac.uk/rhea/ | Manually annotated database of biochemical reactions |
| UniPathway | www.grenoble.prabi.fr/obiwarehouse/unipathway/ | Curated resource of metabolic pathways for the UniProtKB/Swiss-Prot knowledge base |
Table 3 describes the query, visualization, and analysis tools available through the web sites of each database family.
Table 3. Analysis and display tools in the main metabolic databases.
Terms used in the table include Enrichment analysis: a tool for computing statistical enrichment of data sets, e.g., is a given set of genes enriched for known genes categories or for pathways. Choke point analysis: a tool for computing locations of metabolic choke points, which may identify potential drug targets. Metabolite Tracing: visual tracing of metabolites through metabolic network. Path Search: a tool that finds paths in the network that connect two user-specified metabolites. Reachability analysis: a tool that determines if the network can produce specified products from specified input compounds.
| MetaCyc | KEGG | Model SEED | Reactome | BiGG | |
|---|---|---|---|---|---|
| Genome Browser | YES | YES | |||
| Regulatory Network Browser | YES | ||||
| Full Metabolic Map Browser | YES | YES | YES | YES1 | YES |
| Zoomable Metabolic Map | YES | YES | YES | ||
| Paint Data onto Metabolic Map | YES | YES | YES1 | ||
| Pathway Diagrams | YES | YES | YES | YES | |
| Paint Data onto Pathway Diagram | YES | YES | YES | ||
| Automatic Pathway Layout | YES | ||||
| Pathway Diagrams Include Metabolite Structures |
YES | YES | |||
| Gene/Protein Page | YES | YES | YES | YES | |
| Metabolite Page | YES | YES | YES | YES | |
| Reaction Page | YES | YES | YES | YES | |
| Operon Page | YES | ||||
| Enrichment Analysis | YES | YES | |||
| Flux Balance Analysis | YES | YES | YES | ||
| Choke Point Analysis | YES | ||||
| Dead-End Metabolite Analysis | YES | ||||
| Metabolite Tracing Tool | YES | ||||
| Path Search Tool | YES | YES | YES | ||
| Reachability Analysis Tool | YES | YES | |||
| Pathway MultiSearch | YES | YES | |||
| Compound MultiSearch | YES | YES | YES | ||
| Substructure Search | YES | YES | |||
| Gene/Protein MultiSearch | YES | YES | |||
| Reaction MultiSearch | YES | YES | YES | ||
| Advanced Search | YES | YES | |||
| Comparative Analysis | YES | YES | YES |
This tool is being phased out.
Table 4 lists several human metabolic pathway databases, and a curated metabolic pathway database for the mouse. Each of the human databases has a somewhat different focus, and none can claim to be comprehensive. Reactome (Croft et al. 2010) is a curated database that emphasizes human signaling pathways, and contains some metabolic pathways. The Ingenuity Knowledge Base is a curated commercial database that spans signaling pathways, metabolic pathways, and protein interactions. Human Metabolome Database (HMDB) (Wishart et al. 2009) describes compounds found in humans. KEGG (Kanehisa et al. 2010) contains human pathway maps, but is not curated. GenMapp (Salomonis et al. 2007) contains diagrams of human pathways. Recon 1 (Duarte et al. 2007) is a constraint-based model of human metabolism. The Edinburgh Human Metabolic Network (Ma et al. 2007) and HumanCyc (Romero et al. 2004) are both DBs describing human metabolic pathways, enzymes, reactions, and compounds.
Table 4.
Human metabolic pathway databases (we also note the existence of the MouseCyc metabolic pathway database for the laboratory mouse).
| Database | Web address | Description |
|---|---|---|
| Edinburgh Human Metabolic Network |
www.ehmn.bioinformatics.ed.ac.uk | Manually curated, compartmentalized database of human reactions and pathways. Requires registration. |
| Human Metabolome Database (HMDB) |
www.hmdb.ca | Database of small molecule metabolites found in the human body |
| HumanCyc | humancyc.org | Manually curated PGDB of known and predicted metabolic pathways |
| Ingenuity Knowledge Base |
www.ingenuity.com/products/pathways_knowledge.html | Curated commercial database that spans signaling pathways, metabolic pathways, and protein interactions. Requires subscription. |
| Recon 1 | bigg.ucsd.edu | Manually curated global reconstruction of the human metabolic network. Requires registration. |
| Reactome | www.reactome.org | Manually curated, peer-reviewed pathway database |
| KEGG | www.genome.jp/kegg/pathway | Contains reference pathways for metabolism, genetic and environmental information processing, cellular processes, organismal systems and human diseases. None of these has been curated specifically for human genes and proteins |
| GenMapp | www.genmapp.org | Contains an archive of human pathways, in MAPP format |
| MouseCyc | mousecyc.jax.org | Tier 2 manually curated PGDB of both known and predicted metabolic pathways for the laboratory mouse |
The MetaCyc Family of Metabolic Databases
In conjunction with its role as a general reference on metabolism, the MetaCyc DB can be used as a reference DB for the PathoLogic component of the Pathway Tools software, which computationally predicts the metabolic network of any organism having a sequenced and annotated genome (Dale et al. 2010). In this automated process, a predicted metabolic network is created in the form of a Pathway/Genome Database (PGDB). MetaCyc has been used by SRI to create more than one thousand PGDBs (as of November 2010), which are available through the BioCyc website at BioCyc.org. In addition, MetaCyc has been used by other scientists to create hundreds of additional PGDBs, many of which are available to the general public through the scientists’ own websites. Since PGDBs created in this fashion share many properties, we refer to them in this manuscript as the MetaCyc family of databases.
Common attributes of DBs within the MetaCyc family are as follows. (1) They share a common lineage in that all were initially derived from MetaCyc through computational prediction of their metabolic pathways with reference to the pathways in MetaCyc. Some of the databases have undergone subsequent curation to add additional pathways and other information. (2) Databases in the MetaCyc family share a common database schema (the underlying database structure used to organize each database). (3) MetaCyc-family DBs were created, updated, and are queried using a common software environment called the Pathway Tools software (Karp et al. 2010). As a result, databases within this family share a large degree of standardization and compatibility. For example, comparative pathway analysis tools within Pathway Tools can be used to compare any DBs within the MetaCyc family.
It is important to realize that MetaCyc is different from virtually all other PGDBs within the MetaCyc family in that MetaCyc is a multiorganism PGDB, whereas all other PGDBs within the family describe a single organism (the exception is PlantCyc [(Zhang et al. 2010), a multiorganism PGDB that contains only plant information). More specifically, MetaCyc contains metabolic pathways and enzymes from more than 2000 organisms that have been curated from the experimental literature. MetaCyc contains only experimentally elucidated pathways, so as to provide a solid foundation for predicting the metabolic pathways of other organisms. In contrast, organism-specific PGDBs contain a mixture of computationally predicted pathways and (depending on the degree of curation) experimentally elucidated pathways, and attempt to model the metabolic network of that organism as accurately as possible. For example, 67 experimentally elucidated pathways in MetaCyc (version 14.6) list Bacillus subtilis as a taxon known to possess the pathway. In contrast, the BioCyc PGDB for that organism, BsubCyc (version 1.4), contains 219 pathways as well as the complete genome for that organism. Unlike MetaCyc, which does not contain sequence information, the organism-specific databases of the MetaCyc family include the full genome sequence, and provide an excellent platform for the integration of genome information with many other types of data regarding metabolism, regulation, and genetics.
We assign to PGDBs a rating of Tier 1, Tier 2, or Tier 3 to reflect the amount of manual curation that has been applied to that PGDB. Tier 3 PGDBs result from computational predictions only, and underwent no manual curation. Tier 2 PGDBs have undergone less than one year of manual curation, and Tier 1 PGDBs have undergone more than one year of curation. Currently, there are only four Tier 1 databases – MetaCyc, EcoCyc, AraCyc and YeastCyc.
More than 80 groups have used Pathway Tools to create PGDBs for their organisms of interest, including important model organisms such as Saccharomyces cerevisiae (Christie et al. 2004), Arabidopsis thaliana (Mueller et al. 2003), Oryza sativa (Liang et al. 2008), Mus musculus (Evsikov et al. 2009), Bos taurus (Seo and Lewin 2009), Medicago truncatula (Urbanczyk-Wochniak and Sumner 2007), Dictyostelium discoideum (Fey et al. 2009), Leishmania major (Doyle et al. 2009), Chlamydomonas reinhardtii (May et al. 2009), several Solanaceae species (Mazourek et al. 2009), and many pathogenic bacteria (Snyder et al. 2007) (see http://biocyc.org/otherpgdbs.shtml for a more complete list). Web server software included in Pathway Tools enables the publishing of PGDBs through either the Internet (Table 5) or an internal network, making it easy for users to disseminate the databases they create via a website. In addition, a utility called the PGDB Registry, which is included in Pathway Tools, enables users to share their databases with other Pathway Tools users in a manner similar to file sharing utilities such as Napster™.
Table 5.
PGDBs curated by external groups that are available on the Internet
| ApiCyc |
Cryptosporidium hominis TU502 Cyrptosporidium parvum IOWA Plasmodium berghei ANKA Plasmodium chadaudi AS Plasomodium falsiparum 3D7 Plasmodium vivax Sal-1 Plasomodium yoelii 17XNL Toxoplasma gondii ME49 |
EuPathDB (Eukaryotic Pathogens Database Resources), USA |
|---|---|---|
| AcypiCyc | Acyrthosiphon pisum | Universite de Lyon, France |
| AraCyc | Arabidopsis thaliana | Carnegie Institution, USA |
| BeoCyc | 33 BioEnergy organisms | BioEnergy Science Center, USA |
| CalbiCyc | Candida albicans | Department of Genetics, Stanford U., USA |
| ChlamyCyc | Chlamydomonas reinhardtii | GoFORSYS, Germany |
| DictyCyc | Dictyostelium discoideum | dictyBase, Northwestern U., USA |
| FungiCyc | PGDBs for 23 organisms | Broad Institute, USA |
| LeishCyc | Leishmania major Friedlin | Bio21 Institute, University of Melbourne, Australia |
| MedicCyc | Medicago truncatula | Samuel Roberts Noble Foundation, USA |
| MicroScope | PGDBs for 484 organisms | Genoscope, France |
| MpCyc | Moniliophthora perniciosa | Laboratorio de Genomica e Expressao, Brazil |
| PseudoCyc | Pseudomonas aeruginosa | Pseudomonas Genome Project, Simon Fraser U., Canada |
| RetliDB | Rhizobium etli | Center for Genomic Sciences, Mexico |
| RiceCyc | Oryza sativa Sorghum bicolor | Gramene curators, Cornell U. and CSHL, USA |
| ScoCyc | Streptomyces coelicolor A3(2) | John Innes Centre, UK |
| ShewCyc | 18 Shewanella genomes | Marine Biological Laboratory, USA |
| SolCyc |
Solanum lycopersicum Solanum tuberosum Solanum melongena Petunia hybrida Capsicum anuum Coffee caniphora |
Sol Genomics Network, USA |
| SoyCyc | Glycine max | Integrated Genetics and Molecular Biology for Soybean Researchers, USA |
| TBestDB | Taxonomically broad EST database | TBestDB Group, Canada |
| TBCyc | Mycobacterium tuberculosis H37Rv | TB Database, Stanford U., USA |
| YeastCyc | Saccharomyces cerevisiae | Stanford U., USA |
BioCyc
BioCyc is a collection of more than 1000 organism- specific PGDBs that is available from SRI via BioCyc.org. Most of these PGDBs were generated by SRI, although some were created by other groups and are hosted by SRI.
Interested scientists may adopt and curate existing PGDBs through the BioCyc website (biocyc.org/intro.shtml#adoption). To adopt a PGDB is to assume ongoing responsibility for updating and improving its content.
The MetaCyc Database
MetaCyc (MetaCyc.org) is a highly curated multiorganism database of small-molecule metabolism. MetaCyc is unique among metabolic pathway databases in that it only contains data that has been experimentally demonstrated in the scientific literature (Caspi et al. 2010). The experimentally determined pathways and enzymes are tightly integrated with references, making MetaCyc a valuable resource in the field of metabolism, used by researchers from many disciplines, including biochemistry, molecular biology, biotechnology, bioinformatics, metabolic engineering, toxicology, and systems biology (Valdes et al. 2003; Kim et al. 2007; Aanensen et al. 2007; Bernal et al. 2009). The data in MetaCyc is derived from organisms representing all domains of life, with a particular emphasis on microbial and plant metabolism, and is backed by evidence codes and extensive commentary, which include citations of the original literature.
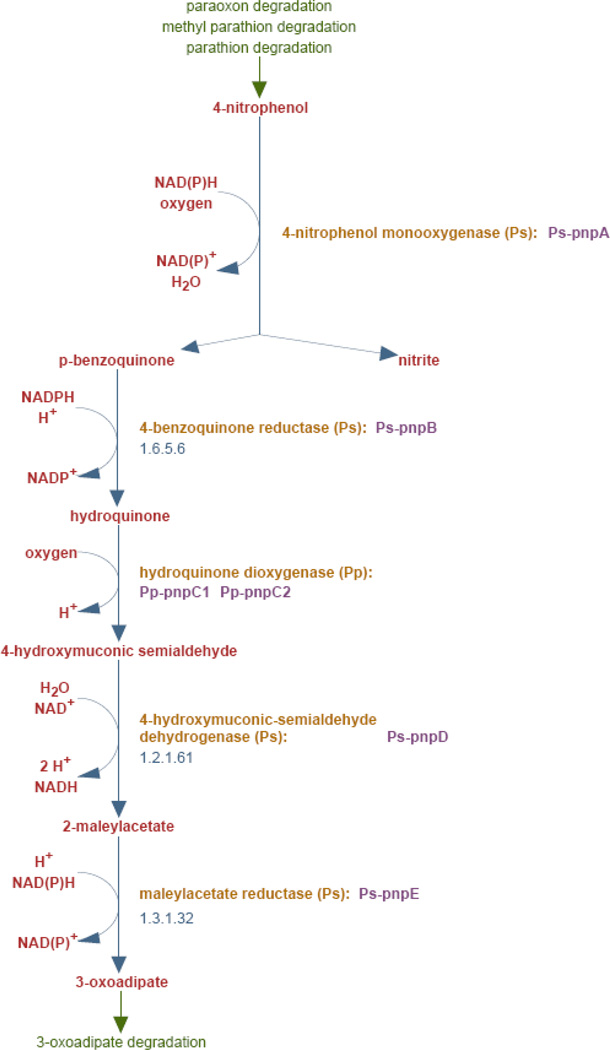
MetaCyc contains a rich array of data content for metabolic pathways, reactions, compounds, enzymes, and genes (Figure 1). This section surveys that content in more detail. Most of the same types of data are available for other curated PGDBs.
Figure 1.
A typical MetaCyc pathway diagram. Commentary and other data that is included in the pathway page are not shown.
MetaCyc utilizes several ontologies, some of which were developed internally (for example, the pathway and cell component ontologies) and some developed externally (such as the NCBI organism taxonomy ontology). MetaCyc data is obtained from several sources. Most of the data has been manually curated from 26,800 publications (since the start of the MetaCyc project in 1997). In addition, other curated PGDBs periodically submit data to MetaCyc, for example, curated pathways and enzymes for E. coli and yeast are obtained periodically from EcoCyc and YeastCyc. MetaCyc also directly imports some data from other DBs: reactions assigned by the Enzyme Commission are imported from the ENZYME DB (Bairoch 2000) and from the ExplorEnz DB (McDonald et al. 2009), and some proteins (those that were imported from EcoCyc) contain protein feature data that was imported from UniProt.
Pathways
MetaCyc version 14.6 contains 1,642 metabolic pathways. The MetaCyc Pathway Ontology classifies these pathways according to their biological roles as shown in Table 6. When the MetaCyc curators enter new pathways nto the DB they record one or more organisms in which the pathway has been studied experimentally. Table 7 shows the number of MetaCyc pathways occurring in the major taxonomic groups. Other information that curators enter for each pathway includes synonyms for the name of the pathway, the reactions and enzymes that compose the pathway, and a minireview summary describing the pathway. To facilitate use of MetaCyc to predict pathways in other organisms, curators also estimate which taxonomic groups are likely to contain the pathway, and designate key reactions that the pathway predictor can use to differentiate this pathway from similar pathways. These similar pathways are called pathway variants within MetaCyc. MetaCyc often captures related forms of a given pathway that differ according to one or more reactions. It is differences at the reaction level that lead to the creation of new pathway variants since differences at the enzyme level are of course inevitable across different organisms. Variant pathways are indicated using Roman numerals, e.g., “L-lysine degradation I”
Table 6.
The MetaCyc Pathway Ontology, a hierarchical classification system for metabolic pathways. The left column lists master classes in the ontology; the right column lists subclasses. Numbers indicate the number of MetaCyc pathways in each class. For example, MetaCyc contains 411 pathways describing biosynthesis of secondary metabolites. The subclasses are listed in order of decreasing pathway number.
| Biosynthesis (1057) | Secondary Metabolites Biosynthesis (411) Cofactors, Prosthetic Groups, Electron Carriers Biosynthesis (179) Fatty Acids and Lipids Biosynthesis (115) Amino Acids Biosynthesis (109) Carbohydrates Biosynthesis (87) Cell structures Biosynthesis (45) Amines and Polyamines Biosynthesis (36) Hormones Biosynthesis (43) Nucleosides and Nucleotides Biosynthesis (28) Aromatic Compounds Biosynthesis (24) Other Biosynthesis (19) Siderophore Biosynthesis (17) Metabolic Regulators Biosynthesis (5) Aminoacyl-tRNA Charging (4) |
| Degradation/Utilization/Assimilation (737) | Amino Acids Degradation (165) Aromatic Compounds Degradation (152) Inorganic Nutrients Metabolism (86) Secondary Metabolites Degradation (78) Carbohydrates Degradation (57) Amines and Polyamines Degradation (48) Chlorinated Compounds Degradation (39) Carboxylates Degradation (35) C1 Compounds Utilization and Assimilation (26) Degradation/Utilization/Assimilation - Other (25) Nucleosides and Nucleotides Degradation (25) Hormones Degradation (23) Fatty Acids and Lipids Degradation (20) Alcohols Degradation (16) Aldehyde Degradation (12) Polymeric Compounds Degradation (10) Cofactors, Prosthetic Groups, Electron Carriers Degradation (3) Protein Degradation (3) |
|
Generation of precursor metabolites and energy (141) |
Fermentation (45) Respiration (27) Chemoautotrophic Energy Metabolism (15) Electron Transfer (12) Methanogenesis (12) TCA cycle (8) Glycolysis (6) Photosynthesis (6) Other (5) Pentose Phosphate Pathways (4) |
| Detoxification (26) | Methylglyoxal Detoxification (8) Arsenate Detoxification (4) Antibiotic Resistance (4) Acid Resistance (2) Mercury Detoxification (1) |
| Superpathways (266) |
Table 7.
Distribution of pathways in MetaCyc based on the taxonomic classification of associated species. Taxonomic groups (phyla for Bacteria and Archaea, kingdoms for Eukarya) are grouped by domain and are ordered within each domain based on the number of pathways (number following taxon name) associated with the taxon. Euglenozoa are listed separately as this group does not belong to any of the other eukaryotic kingdoms. A pathway may be associated with multiple organisms.
| Bacteria | 1478 | Eukarya | 1227 | Archaea | 141 |
|---|---|---|---|---|---|
| Proteobacteria | 856 | Viridiplantae | 733 | Euryarchaeota | 107 |
| Firmicutes | 234 | Fungi | 243 | Crenarchaeota | 34 |
| Actinobacteria | 205 | Metazoa | 232 | ||
| Bacteroidetes/Chlorobi | 55 | Euglenozoa | 19 | ||
| Cyanobacteria | 46 | ||||
| Deinococcus-Thermus | 23 | ||||
| Thermotogae | 15 | ||||
| Aquificae | 11 | ||||
| Spirochaetes | 10 | ||||
| Chlamydiae -Verrucomicrobia | 5 | ||||
| Planctomycetes | 5 | ||||
| Chloroflexi | 4 | ||||
| Fusobacteria | 4 | ||||
| Nitrospirae | 2 | ||||
| Thermodesulfobacteria | 2 | ||||
| Chrysiogenetes | 1 |
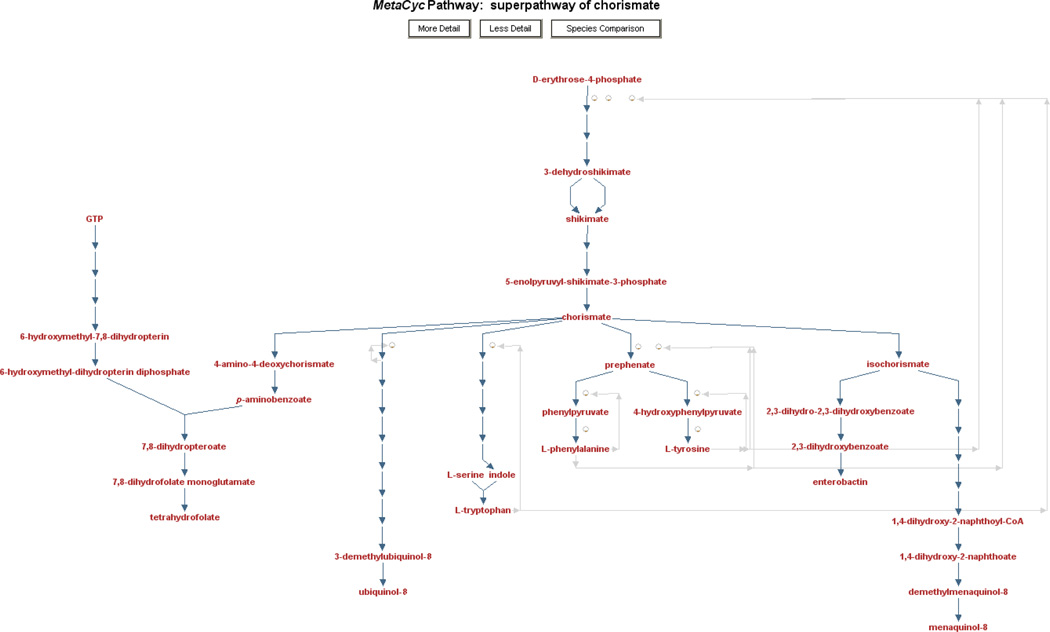
MetaCyc also includes superpathways, which are aggregations of multiple base pathways to illustrate how pathways connect to form larger units. An example superpathway is shown in Figure 2.
Figure 2.
A MetaCyc superpathway. Superpathways are composed of several smaller pathways and are used to provide a more comprehensive view of a metabolic process. In this example, multiple pathways that relate to chorismate metabolism (e.g., chorismate biosynthesis, tetrahydrofolate biosynthesis, enterobactin biosynthesis) are integrated into a single diagram. Since superpathways can be very large, Pathway Tools automatically displays them at a lower detail level, trying to fit the full diagram on the screen. In this example, enzymes, genes, and even some of the metabolite intermediates are not displayed. The user can click the “More Detail” button at the top to increase the detail level incrementally, adding all intermediates, enzymes, and finally metabolite structures to the display.
Reactions
MetaCyc version 14.6 contains 8,983 metabolic reactions. 5,446 of these reactions are assigned to metabolic pathways; the remaining reactions are not components of any pathway. Reactions may or may not have enzymes associated with them. Each reaction refers to its substrates as links to the corresponding compound entries in MetaCyc. Thus each substrate is captured one time in MetaCyc and is referenced in every reaction using the same name and chemical structure. This basic principle of DB normalization ensures that MetaCyc does not contain duplicate information about the same compound, and ensures that every compound will always have the same name and chemical structure in every reaction in which it appears.
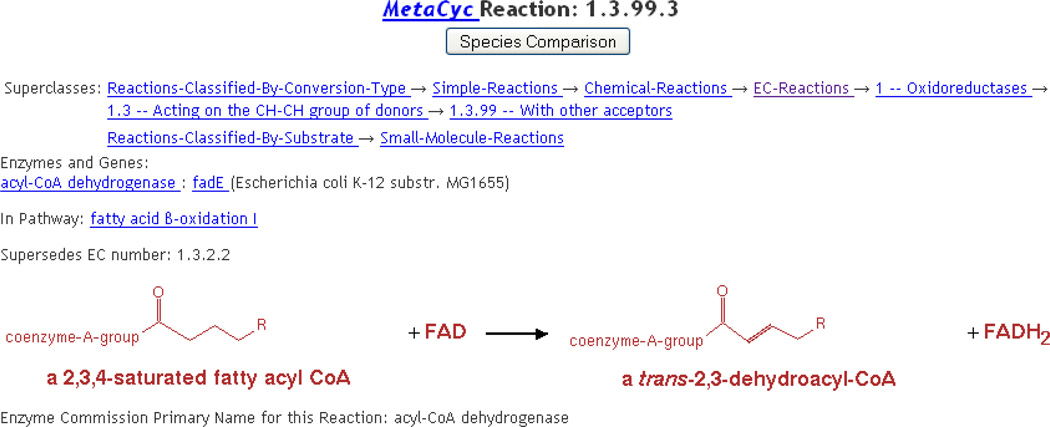
Although typically the substrates of a reaction are all specific metabolic compounds, in many cases it is desirable to describe a family of reactions that occur on a family of related substrates in a single reaction. This situation is handled by creating reactions whose substrates include compound classes. For example, the pathway “fatty acid β-oxidation I” includes the reaction (ACYLCOADEHYDROG-RXN) shown in Figure 3, which involves two different compound classes. MetaCyc enumerates many or all of the instances of each compound class, i.e., if the user clicks on “a 2,3,4-saturated fatty acyl CoA,” the resulting page lists several specific compounds that are instances of this class. MetaCyc reactions are computationally checked for proper element balance, including proton balance.
Figure 3.
A reaction that involves compound classes.
Enzymes
MetaCyc 14.6 contains 6,912 enzymes. MetaCyc curators attempt to capture the following information for each enzyme, although not all of this information is available for each enzyme in the literature. MetaCyc encodes the subunit structure of each enzyme (e.g., homodimer, heterotrimer), and the genes encoding each subunit. It captures the reaction(s) catalyzed by the enzyme, its cofactors, activators, and inhibitors, and distinguishes the mechanism of activation or inhibition, as well as indicating which activators and inhibitors are thought to act in vivo. Kinetic constants are captured when available, as are molecular weight and pI. Web links to other biological DBs such as UniProt are provided.
Compounds
MetaCyc 14.6 contains 8,869 compounds. The vast majority of compounds in MetaCyc include chemical structures. All MetaCyc structures have been protonated to pH 7.3, to represent a consistent and biologically relevant protonation state.
Releases of MetaCyc occur four times per year. On each release MetaCyc is subject to a large number of computational validation checks including searching for duplicate reactions and duplicate compounds, and searching for unbalanced reactions.
Uses of the MetaCyc Family of PGDBs
When combined with the Pathway Tool software, PGDBs offer sophisticated tools for query, navigation, and analysis. In this section we will cover a few of those tools.
Searching a PGDB
The main objects that users query for in a metabolic database are compounds, reactions, pathways, genes and proteins. Querying PGDBs can be performed at different levels and by different mechanisms.
Quick search
For simple searches, a “quick search” box is available at the upper right hand corner of every web page. This type of search queries all object types simultaneously, and is useful if you know the name (or part of the name) or database identifier of the object for which you are searching.
The quick search box can be used to search for genes, proteins, compounds, RNAs, reactions, pathways, operons, and GO terms. If the query string matches a single object, the page for that object will be displayed immediately. If there are multiple matches, the full list of matches will be shown, organized by the type of object. When users enter long text strings in the box, the search will return all objects that contain the text rather than match it exactly. To limit the results to exact matches, users can add the special flag search:exact at the end of the input string. For example, the search “D-glucose search:exact” will return the compound D-glucose, while the search “D-glucose” will return many results, for example, “abscisic acid glucose ester biosynthesis”.
Intermediate-level searches
For intermediate searches, Pathway Tools provides specialized search pages for the main objects for which users may search – Compounds, Genes/Proteins/RNAs, Reactions and Pathways, available under the Search menu. While designing these pages, we tried to accommodate common search criteria that we estimated users may wish to search for, making such searches simple and user-friendly. Each such page contains options for searching using a number of different criteria, either individually or in combination.
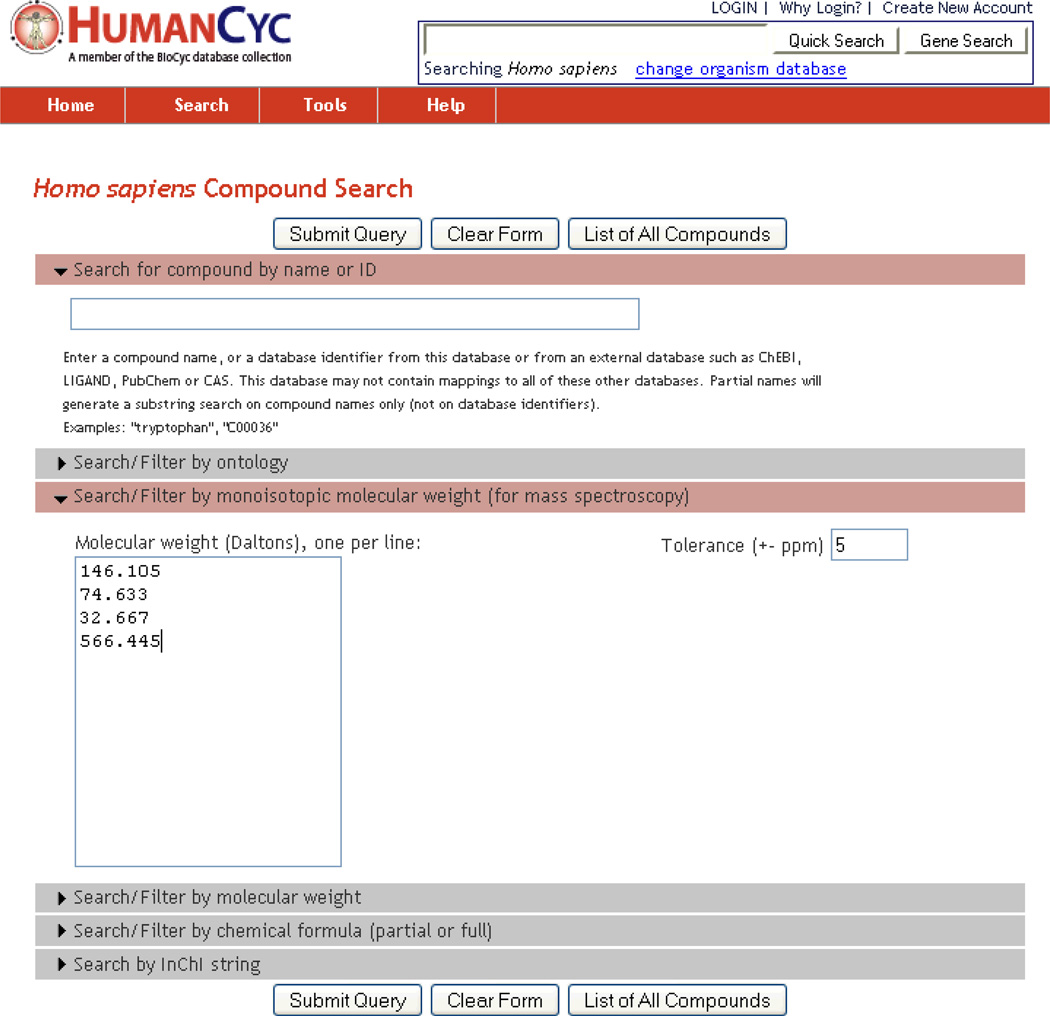
Compounds can be searched by name or ID, ontology (e.g., all compounds classified as alipid), molecular weight, monoisotopic molecular weight (for mass spectroscopy), partial or full chemical formula, and by InChI strings. For example, searching HumanCyc compounds for the molecular mass 146.105 with 5% tolerance returns the two compounds L-lysine and D-lysine (see Figure 4).
Figure 4.
Searching HumanCyc for several monoisotopic molecular weights, with specified tolerance of 5 ppm. This type of search is useful for analysis of compounds identified by mass spectroscopy, enabling the researchers to find candidate compounds known to exist in the organism, and to learn about their roles in the metabolic network.
The Genes/Proteins/RNAs search page has many search options, including searching by name, database identifier, or the protein’s EC number; by sequence length, replicon and/or gene map position; by a protein’s molecular weight, pI, or small molecule regulator, cofactor, substrate or ligand; by evidence code, cellular location, GO term, MultiFun term, or by organism (when searching MetaCyc or other multiorganism PGDBs). It is also possible to search by publication, using a PubMed ID, author name, or an article title. For example, searching HumanCyc for publications by author “Wilson PJ” returns two articles, associated with the products of the IDS and TSC2 genes.
Reactions can be searched by EC number or name, substrates or products, and by ontology.
Pathways can be searched by name, ontology, number of reactions, compounds that participate in the pathway, evidence code, organism (for multiorganism PGDBs), expected taxonomic range, and publication. For example, searching HumanCyc for pathways that contain the substrate L-lysine returns three pathways – two L-lysine degradation pathways and one tRNA charging pathway.
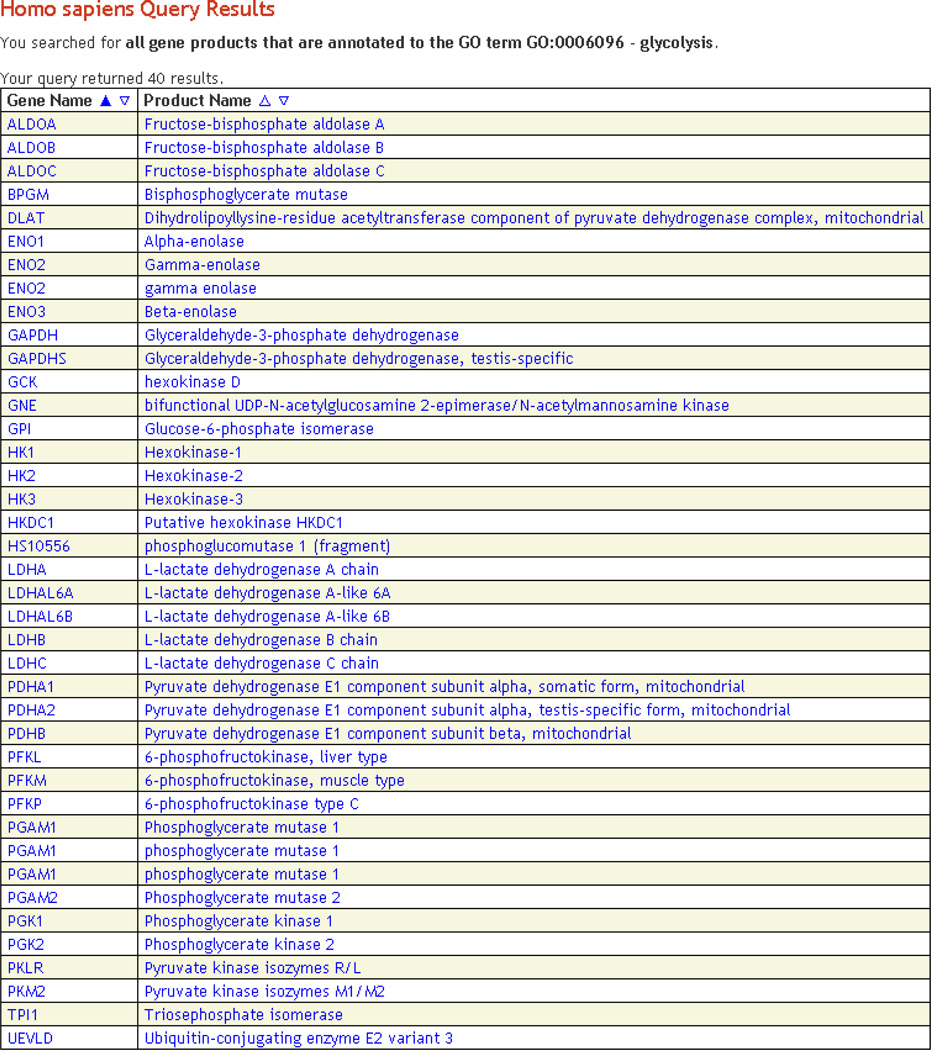
The results of all object searches are returned in the form of a table that contains the names of all objects that satisfy the search, with hyperlinks to their corresponding data pages, along with any additional columns relevant to the particular search. The results table can be sorted by any column, in either ascending or descending order (Figure 5).
Figure 5.
Query results. This figure shows the results of a search of the HumanCyc PGDB for proteins curated with the GO term 0006096 – glycolysis. The results are returned in a table, where each result is a hyperlink to the actual object. By clicking the triangles next to each column heading it is possible to sort the table according to the data in that column, in either ascending or descending order.
Other types of simple searches
Pathway Tools offers several additional search options under the search menu, including the search of the full website for a text string using Google Search (available only for websites that have been indexed by Google), browsing the different ontologies, and performing sequence searches using BLAST (currently not available in MetaCyc).
Advanced Queries
For more complex searches, users can use the Advanced Search tool, which permits writing queries that combine data from multiple organisms or multiple types of objects. To enable this powerful query tool, a dedicated query language, named BioVelo, has been developed (Latendresse and Karp 2010).
The Structured Advanced Query Page (SAQP) enables the user to compose complex queries by selecting options from pull-down menus and combining them with simple text strings entered into text boxes. This interface enables the user to formulate a query without knowing the underlying query language. While not representing the full capabilities of the BioVelo language, this interface provides a simple way to construct a powerful range of queries.
In addition to composing the query, a user can specify the exact output format for the results by specifying any number of output columns and assigning the desired data fields to each column. Users can also select between HTML output, which permits viewing the results immediately in the web browser, and a text tabulated file that can be imported into spreadsheet programs. For example, searching HumanCyc for proteins curated with GO terms that contain the word “lysine” returns a list of 25 proteins that meet these criteria.
Navigation within PGDBs
A key feature of PGDBs served by Pathway Tools is connectivity among data objects. Almost all object displays are clickable, making it easy to navigate from one object to a related object. For example, in addition to displaying a chemical structure, links to other databases, and other compound-related data, the compound pages in PGDBs also include a list of all the reactions in the database in which the compound participates, as well as the pathways that include these reactions. Both the reactions and the pathway names are clickable, making it very easy to navigate from the compound page to the pathways that include that compound. Similarly, reaction pages list all the enzymes known to catalyze the reaction, the genes that encode those enzymes, and the pathways that include the reaction. Gene pages include the transcription units that contain the gene as well as a diagram of the gene local content, the enzyme encoded by the gene, the reactions catalyzed by the enzyme, relevant pathways, and buttons that allow the user to display the organism’s genome browser centered around the gene, display sequence information, compare orthologs from multiple organisms, and align orthologous genes in a multigenome browser.
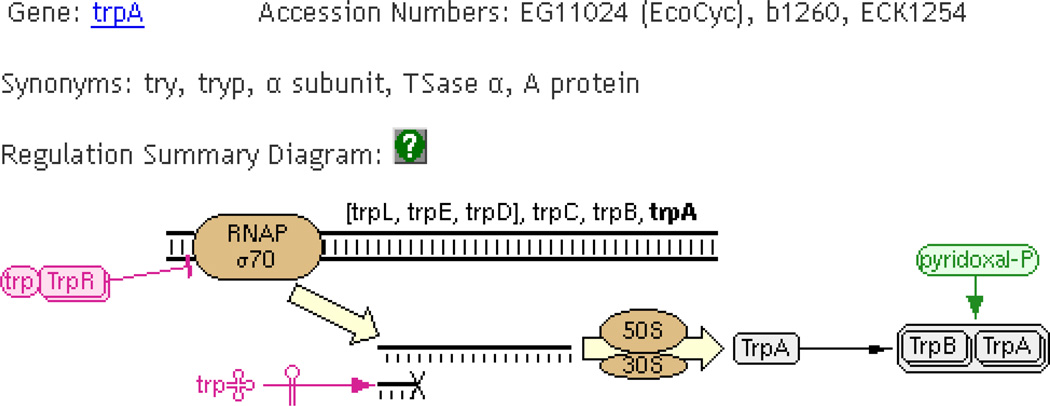
To make browsing and navigating even easier, the Pathway Tools pages include several diagrams that link objects in a graphical way. For example, gene-reaction schematics integrate genes, gene products, protein complexes, and the reaction(s) catalyzed by them. Again, each component of the diagram is a clickable hyperlink. A regulation summary diagram, displayed on every protein page in databases that contain regulatory information, integrates all available information about regulators of the gene and gene product, including transcriptional, translational, and post-translational regulation (Figure 6).
Figure 6.
The Regulation Summary Diagram, which includes elements such as other genes in the same transcription unit, the sigma factor involved in transcription, the gene product and complexes formed by it, and different regulators that control transcription, translation, and activity. This example, which describes the trpA gene of Escherichia coli, includes the TrpR transcriptional regulator and the compound tryptophan (which also functions as a transcription regulator), a small RNA molecule that regulates translation of the mRNA, and the compound pyridoxal phosphate that activates the enzyme.
Analysis and Display Tools
Pathway Tools provides a plethora of data analysis and visualization capabilities to the MetaCyc family of PGDBs, including overview diagrams, ChIP-chip data visualization, omics viewers, enrichment analysis, comparative analysis of different organisms, and dead-end metabolite analysis.
The Genome Browser
The genetic elements (replicons) of the organism can be viewed by a dedicated viewer called the Genome Browser that is built into the Pathway Tools software, and can be invoked using the web menu bar command Tools → Genome Browser (this tool is available for all PGDBs with the exception of MetaCyc, since the latter does not contain genome information). The user can specify the region of the element to be viewed, using either exact coordinates, or through zooming and lateral translation navigational controls at the upper left. The browser distinguishes between protein-coding genes, RNA genes and Open Reading Frames and indicates the transcription direction of the genes. Depending on the level of detail, the browser can show additional information. For example, at the “operons” level the browser depicts the transcription units (a different color indicates whether the transcription unit is based on computational prediction or experimental evidence). At the “genes” level the browser adds transcription start sites and terminator binding sites. The user can display positional data (such as predicted promoters) by using the tracks feature (see Data Tracks Visualization below).
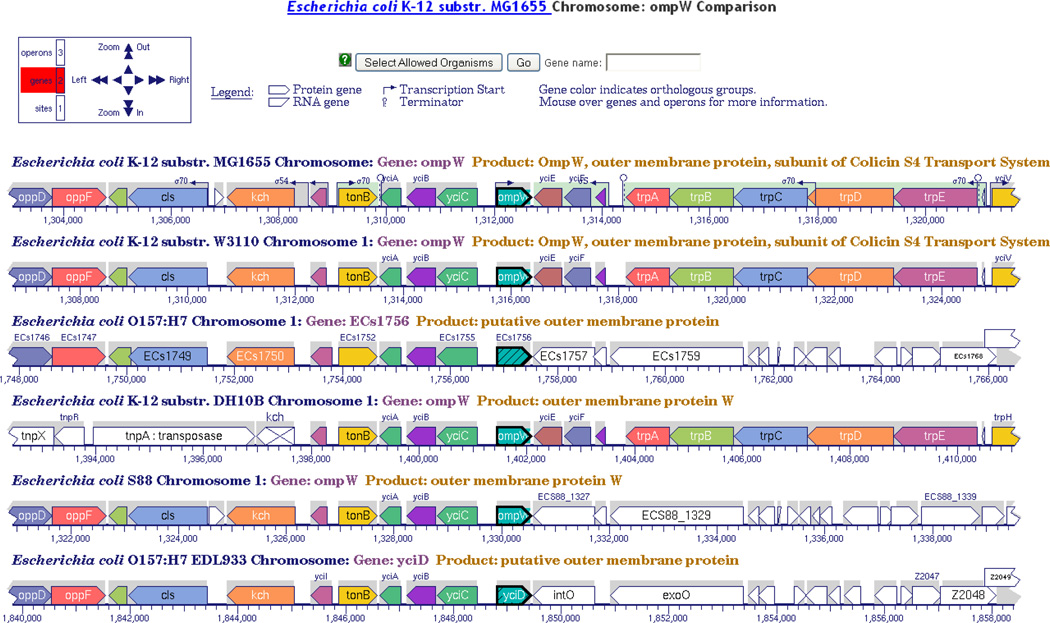
The Comparative Genome Browser (accessible from a gene page by the “Align in Multi-Genome Browser” button) is a different implementation of the Genome Browser with which the user can compare several replicons simultaneously side by side, allowing easy visual comparison of related organisms to observe similarities and differences in their gene arrangements (Figure 7).
Figure 7.
The Multi-Genome Browser makes it easy to notice even small differences among related genomic regions. In this example the genomic regions surrounding the ompW genes of several Escherichia coli strains are aligned.
Overview diagrams
The overview diagrams integrate information to provide system-level views of molecular machinery in a single diagram. Three such diagrams are available – a cellular overview, a regulatory overview, and a genome overview. Again, these tools are not available for MetaCyc since it does not describe a single organism.
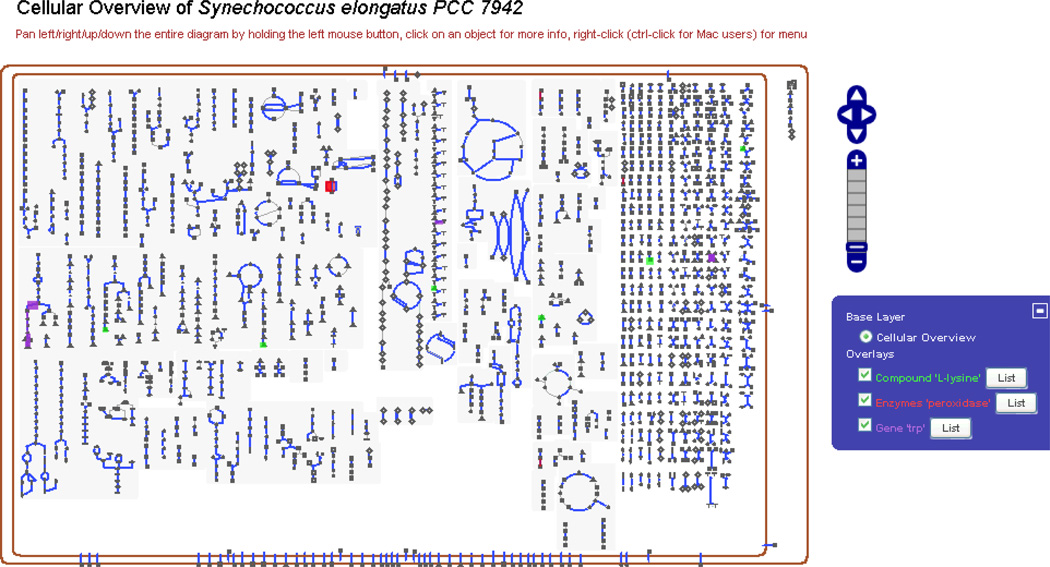
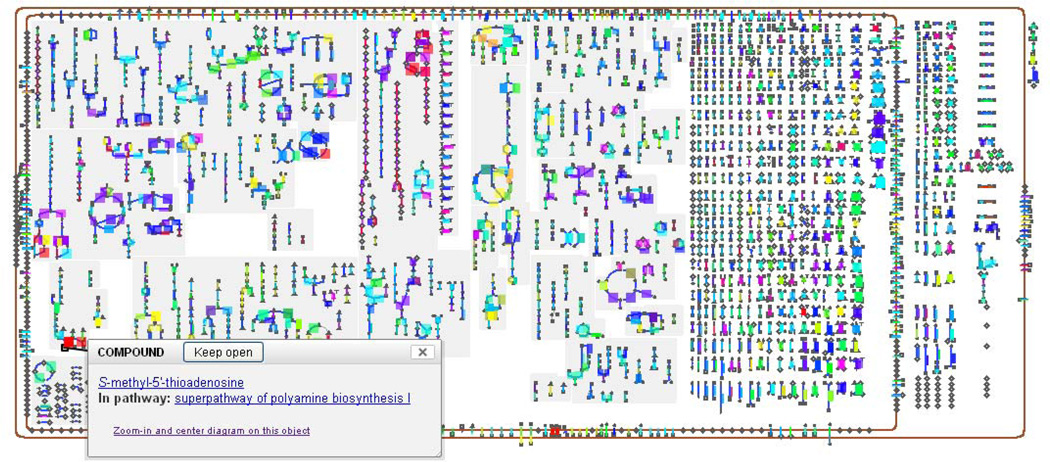
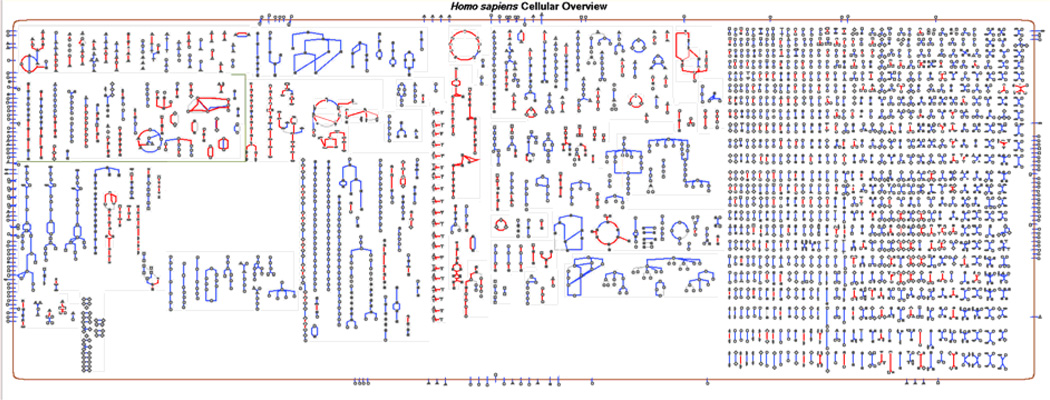
The Cellular Overview diagram (Figure 8) depicts the biochemical machinery of the organism, and is invoked using Tools → Cellular Overview. It displays all the metabolic pathways in the PGDB, along with transporters and enzymatic reactions that are not included in pathways. Each node in the diagram represents a single compound, and each line represents a single reaction. The border drawn around the Overview depicts the cytoplasmic membrane, and contains embedded transport proteins. Where possible, transporters are positioned in the membrane so as to be near some of the metabolic reactions into which their substrates feed. In the overview for Gram-negative bacteria both the inner and outer membranes are shown. Periplasmic reactions and proteins are depicted in the space between the two membranes at the right of the diagram.
Figure 8.
The Cellular Overview. The figure shows the Cellular Overview for the cyanobacterium Synechococcus elongatus PCC 7942. Detailed description of the diagram is provided in the text. Several items have been highlighted on this diagram – the compound L-lysine (in green), peroxidase enzymes (in red), and genes whose name contain the substring “trp” (purple). The switchboard, to the right of the image, enables turning the individual highlighting operations on and off.
The diagram can be magnified using the zoom ladder at the upper left. The diagram can be interrogated in many ways, allowing users to highlight sets of data according to their specifications, with the commands under the Cellular Overview menu.
The Regulatory Overview diagram enables the user to visually analyze the regulatory relationships between genes (Tools → Regulatory Overview). Each node represents a gene, and arrows represent a regulatory interaction between the product of one gene and the transcription of another. Since regulatory information cannot be predicted computationally in an accurate manner, this functionality is available only in PGDBs where such information has been entered manually.
The Genome Overview diagram describes the full genome in a compact diagram (Tools → Genome Overview).
The Omics Viewers
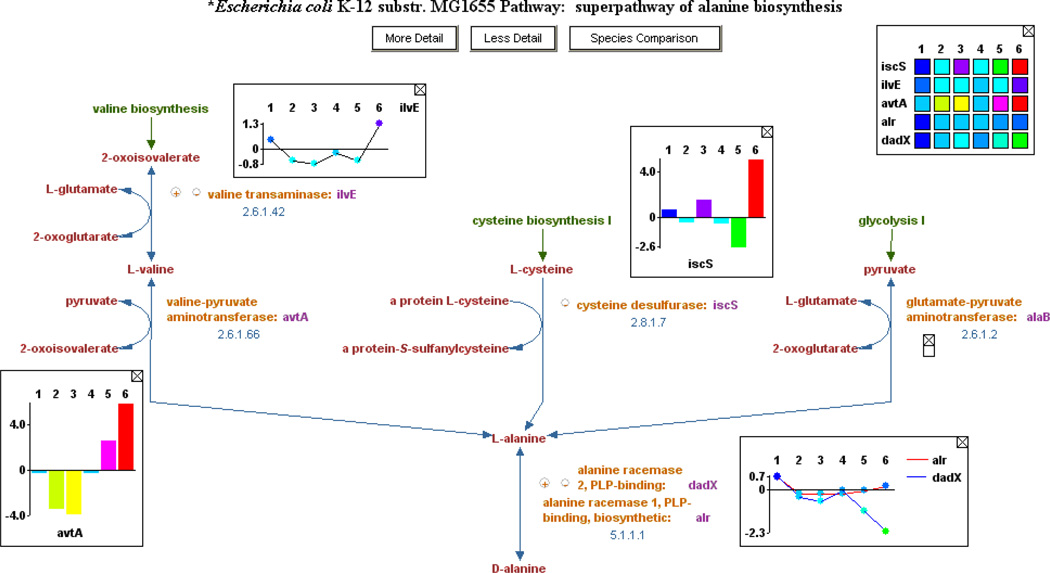
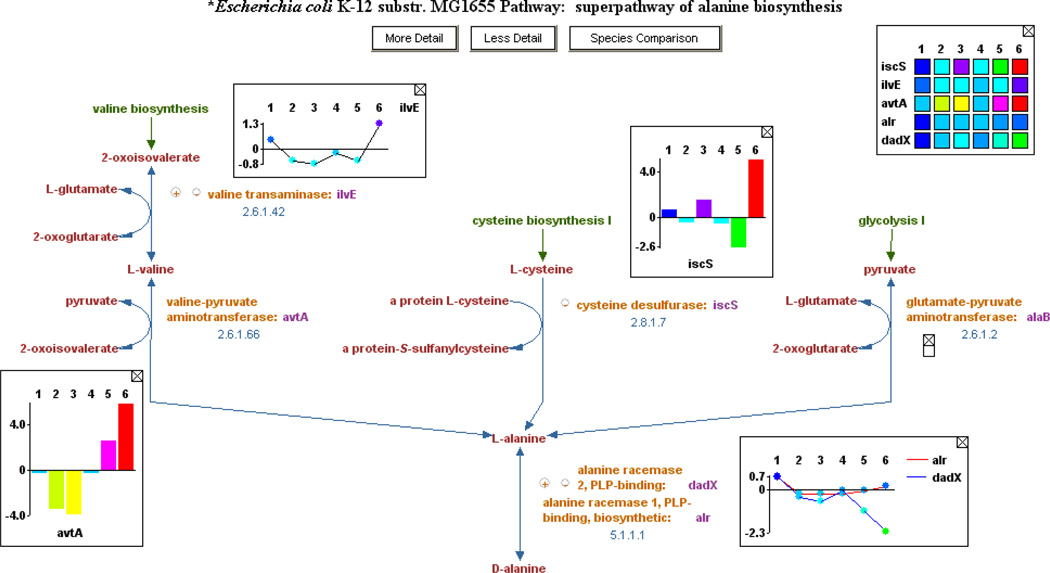
The Cellular Omics Viewer (Cellular Overview → Overlay Experimental Data) builds on the overview diagrams by adding the ability to paint omics data on top of them (Figure 9). Omics data from multiple types of assays, such as microarray expression, proteomics, metabolomics, and reaction flux data can be superimposed on the overview diagrams. Numeric values associated with the data are mapped to a spectrum of colors, and the color of either nodes or edges in the diagrams is displayed accordingly. The Omics Viewer can show absolute data values (such as the concentration of a metabolite or protein, or the absolute expression level of a gene), or it can be used to compare two sets of experimental data by computing a ratio and mapping the ratios onto a color spectrum. Multiple sets of experimental data can be animated to show, for example, how gene expression levels of enzymes change with time over the course of an experiment. In addition, the omics data can be displayed on a single pathway diagram, and the user can select from several display formats (Figure 10).
Figure 9.
The Cellular Omics Viewer. This figure, showing a Cellular Omics Viewer for the bacterium Escherichia coli, depicts the overlay of a gene transcription dataset (Tao et al. 1999). The level of transcription is indicated by the color of the reactions that are catalyzed by the enzymes which are encoded by the specific genes. The legend for mapping colors to data values is not shown in the figure. By hovering the mouse cursor over a compound or a reaction the user can trigger pop-ups that provide information and enable navigation to the relevant compound page, or to a pathway display that retains the omics information (see Figure 10).
Figure 10.
Omics data displayed on a pathway diagram. Several display options are shown, including an X-Y plot, histogram, and heat map.
Data Tracks Visualization
Using the tracks feature (accessible from the Genome Browser), it is possible to display any type of information with numeric values that correspond to positions on a genetic element, such as ChIP-chip data. The data needs to be stored in GFF format (for more information about this format, see http://www.sanger.ac.uk/resources/software/gff/). Any number of additional tracks can be added. Once a data track has been added, it is possible to toggle its display on and off by checking the appropriate check box under “External Annotation Tracks”.
Object Groups and Enrichment analysis
Experimental protocols often yield a set of genes of interest, but the relationships among these genes are not always clear. This tool was designed to help answer the question “What do groups of genes have in common?” Enrichment analysis enables users to evaluate over- or under-representation of certain qualities or traits within an object group – for example, determining which genes out of a specified gene group are involved in one or more biological processes. To enable this type of analysis, Pathway Tools includes two functions – a flexible interface that permits the user to define and manipulate object groups, and a statistical analysis engine. Users can create groups of objects in several ways (see Groups menu in desktop software) – they can import objects from text files (e.g., a list of gene names) or omics data sets, they can search the database and convert the search results to a group (e.g., a group of all the lysine biosynthetic pathways), or they can simply type in the names of the objects that want to include. Once a group has been created, it is extremely easy to automatically transform it to a different type of group. For example, the user can convert a group of pathways to a group of the genes that re involved in these pathways, or convert a group of genes to a group of GO terms, to the enzymes encoded by those genes, to the pathways in which those enzymes participate, or to the compounds that are included in those pathways.
It is even possible with a few mouse clicks to combine groups or to filter them, and to display the contents of groups on any of the overview diagrams. This last option enables users to instantaneously answer questions such as “do the genes in my list tend to cluster on the chromosome?” or “do the genes in my list tend to share a regulation scheme?” (by highlighting the genes on the Genome Overview and Regulatory Overview, respectively).
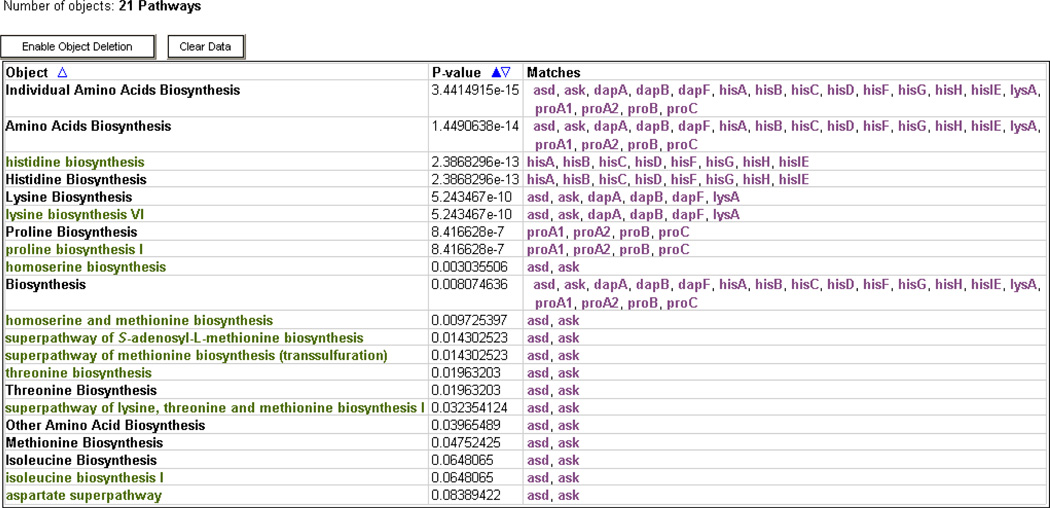
To answer this type of question mathematically, certain groups can be analyzed by statistical methods for enrichment or depletion of relevant traits. Currently available modes allow analyzing gene groups for enrichment of GO terms, transcriptional regulators, or metabolic pathways (Figure 11), and analyzing compound groups for participation in pathways. Statistical methods include several flavors of the Fisher-exact test (Rivals et al. 2007), and several options for corrections, including Bonferroni, Benjamini-Hochberg, and Benjamini-Yekutieli procedures (Grossmann et al. 2007).
Figure 11.
Enrichment Analysis. In this example a group of genes was analyzed for enrichment for pathways. The results show that this group of genes was highly enriched for amino acids biosynthesis pathways, and specifically those for the biosynthesis of histidine, lysine, and proline.
Comparative Analyses
Comparative analyses allow users to compare data and statistics between PGDBs and generate summaries of individual PGDBs. Currently, Pathway Tools supports comparative analysis of reactions, pathways, compounds, proteins, orthologs, transporters, and transcription units. Once users invoke this type of analysis by selecting Tools → Comparative Analysis, they can select the types of objects to be compared and specify the organisms they would like to compare. The system will generate comparison tables that include hyperlinks for most of the included objects. These tools can also be used to generate statistical analysis for a single organism.
A different way to compare organisms is achieved via the Cellular Overview diagrams. When displaying the cellular overview of an organism it is possible to highlight all reactions of the Overview that are either shared or not shared with any or all members of a user-specified group of PGDBs. This highlighting allows the user to easily visualize the similarities or differences of the metabolic networks of several organisms. For example, to facilitate developing antimicrobial drugs, these kinds of analyses provide a convenient means of computationally predicting targets that are present in the microbial pathogens but absent from a mammalian host. A diagram showing the intersection of the metabolic networks of Escherichia coli and Homo sapiens is provided in Figure 12.
Figure 12.
Species comparison between Homo sapiens and Escherichia coli. Reactions shared by both organisms are highlighted in red.
Modes and Platforms of the Pathway Tools Software
The Pathway Tools software can run as either a desktop application or as a web server. An example for the latter is the BioCyc.Org website and many other websites around the world, where users can access PGDBs via the Internet. However, users can also download and install Pathway Tools on their own computers (Windows, Macintosh and Linux versions are available) and run it in desktop mode.
Although the software shares most of its functionality between these two modes of operation, some functionality is available in only one mode or the other. Thus, installing Pathway Tools locally provides access to operations that are not available through the BioCyc.org website. In addition, local installation is likely to speed up many operations because it eliminates network delays and the sharing of computer resources with other users. The main options that are available only via the desktop mode are Pathologic (enabling the creation of new PGDBs) and editing of PGDBs. In addition, a number of operations, including some Omics analysis tools, are available only in desktop mode. On the other hand, some comparative genomics tools, the Advanced Query pages, and BLAST searching are available only via the web server. Future versions of Pathway Tools will include more functionality in web server mode. A full comparison of current differences can be found at http://biocyc.org/desktop-vs-web-mode.shtml.
How to Learn More about the MetaCyc Family
Publications describing new releases of MetaCyc, BioCyc, and EcoCyc occur every other year in the Nucleic Acids Research database issue (Caspi et al. 2010; Keseler et al. 2009). In addition, the web-based guides for MetaCyc, BioCyc, and EcoCyc provide more detailed information about the databases (Guide to the MetaCyc Database; Guide to the BioCyc database collection; Guide to the EcoCyc Database). A survey of Pathway Tools capabilities is available (Karp et al. 2010), as is a guide to using the Pathway Tools based websites (How to Use a Pathway Tools Website). Tutorial videos on how to use the MetaCyc family of databases and Pathway Tools based web-sites can be downloaded from our website (BioCyc webinars).
Summary
Recent years have seen a dramatic increase in the number of publicly available metabolic databases, from a handful in the mid 1990s to several thousand today. Many of these databases are generated automatically via software pipelines, resulting in distinct families of databases. The main families are MetaCyc, KEGG, Model SEED, Reactome, and BiGG. The different database families offer different functionalities - for example, the ability to annotate or curate the databases, the availability of different query and analysis options, or the ability to create new custom databases. In this review we focused on the MetaCyc family, which contains well over one thousand databases, including highly curated model organism databases for Escherichia coli, Saccharomyces cerevisiae, Mus musculus, and Arabidopsis thaliana. Many of the databases in the MetaCyc family were created by scientists, rather than by the SRI developers of the software. The Pathway Tools software, which supports these databases, offers a range of software tools for querying and visualizing metabolic networks, as well as for analysis of gene expression and metabolomics data, including visualization of those datasets on metabolic network diagrams, and analysis of over-representation of gene and metabolite sets. The MetaCyc family databases are available through a number of websites around the world, including a collection of more than 1,000 databases at BioCyc.org.
Acknowledgments
The projects described were supported by award numbers GM75742 and GM080746 from the National Institute of General Medical Sciences. The content is solely the responsibility of the authors and does not necessarily represent the official views of the National Institute of General Medical Sciences or the National Institutes of Health.
Bibliography
- Aanensen DM, Mavroidi A, Bentley SD, Reeves PR, Spratt BG. Predicted functions and linkage specificities of the products of the Streptococcus pneumoniae capsular biosynthetic loci. J Bacteriol. 2007;189(21):7856–7876. doi: 10.1128/JB.00837-07. [DOI] [PMC free article] [PubMed] [Google Scholar]
- Bairoch A. The ENZYME database in 2000. Nucleic Acids Res. 2000;28(1):304–305. doi: 10.1093/nar/28.1.304. [DOI] [PMC free article] [PubMed] [Google Scholar]
- Bernal V, Carinhas N, Yokomizo AY, Carrondo MJ, Alves PM. Cell density effect in the baculovirus-insect cells system: a quantitative analysis of energetic metabolism. Biotechnol Bioeng. 2009;104(1):162–180. doi: 10.1002/bit.22364. [DOI] [PubMed] [Google Scholar]
- BioCyc webinars. SRI International; http://biocyc.org/webinar.shtml, [Google Scholar]
- Caspi R, Altman T, Dale JM, Dreher K, Fulcher CA, Gilham F, Kaipa P, Karthikeyan AS, Kothari A, Krummenacker M, Latendresse M, Mueller LA, Paley S, Popescu L, Pujar A, Shearer AG, Zhang P, Karp PD. The MetaCyc database of metabolic pathways and enzymes and the BioCyc collection of pathway/genome databases. Nucleic Acids Res. 2010;38(Database issue):D473–D479. doi: 10.1093/nar/gkp875. [DOI] [PMC free article] [PubMed] [Google Scholar]
- Christie KR, Weng S, Balakrishnan R, Costanzo MC, Dolinski K, Dwight SS, Engel SR, Feierbach B, Fisk DG, Hirschman JE, Hong EL, Issel-Tarver L, Nash R, Sethuraman A, Starr B, Theesfeld CL, Andrada R, Binkley G, Dong Q, Lane C, Schroeder M, Botstein D, Cherry JM. Saccharomyces Genome Database(SGD) provides tools to identify and analyze sequences from Saccharomyces cerevisiae and related sequences from other organisms. Nucleic Acids Res. 2004;32(Database issue):D311–D314. doi: 10.1093/nar/gkh033. [DOI] [PMC free article] [PubMed] [Google Scholar]
- Croft D, O'Kelly G, Wu G, Haw R, Gillespie M, Matthews L, Caudy M, Garapati P, Gopinath G, Jassal B, Jupe S, Kataskaya I, Mahajan S, May B, Ndegwa N, Schmidt E, Shamovsky V, Yung C, Birney E, Hermjakob H, D'Eustachio P, Stein L. Reactome: a database of reactions, pathways and biological processes. Nucleic Acids Res. 2010 doi: 10.1093/nar/gkq1018. In Press. [DOI] [PMC free article] [PubMed] [Google Scholar]
- Dale JM, Popescu L, Karp PD. Machine learning methods for metabolic pathway prediction. BMC Bioinformatics. 2010;11:15. doi: 10.1186/1471-2105-11-15. [DOI] [PMC free article] [PubMed] [Google Scholar]
- Doyle MA, MacRae JI, De Souza DP, Saunders EC, McConville MJ, Likic VA. LeishCyc: a biochemical pathways database for Leishmania major. BMC Syst Biol. 2009;3:57. doi: 10.1186/1752-0509-3-57. [DOI] [PMC free article] [PubMed] [Google Scholar]
- Duarte NC, Becker SA, Jamshidi N, Thiele I, Mo ML, Vo TD, Srivas R, Palsson BO. Global reconstruction of the human metabolic network based on genomic and bibliomic data. Proc Natl Acad Sci U S A. 2007;104(6):1777–1782. doi: 10.1073/pnas.0610772104. [DOI] [PMC free article] [PubMed] [Google Scholar]
- Evsikov AV, Dolan ME, Genrich MP, Patek E, Bult CJ. MouseCyc: a curated biochemical pathways database for the laboratory mouse. Genome Biol. 2009;10(8):R84. doi: 10.1186/gb-2009-10-8-r84. [DOI] [PMC free article] [PubMed] [Google Scholar]
- Fey P, Gaudet P, Curk T, Zupan B, Just EM, Basu S, Merchant SN, Bushmanova YA, Shaulsky G, Kibbe WA, Chisholm RL. dictyBase--a Dictyostelium bioinformatics resource update. Nucleic Acids Res. 2009;37(Database issue):D515–D519. doi: 10.1093/nar/gkn844. [DOI] [PMC free article] [PubMed] [Google Scholar]
- Green ML, Karp PD. The outcomes of pathway database computations depend on pathway ontology. Nucleic Acids Res. 2006;34(13):3687–3697. doi: 10.1093/nar/gkl438. [DOI] [PMC free article] [PubMed] [Google Scholar]
- Grossmann S, Bauer S, Robinson PN, Vingron M. Improved detection of overrepresentation of Gene-Ontology annotations with parent child analysis. Bioinformatics. 2007;23(22):3024–3031. doi: 10.1093/bioinformatics/btm440. [DOI] [PubMed] [Google Scholar]
- Guide to the BioCyc database collection. SRI International; http://biocyc.org/BioCycUserGuide.shtml, [Google Scholar]
- Guide to the EcoCyc Database. SRI International; http://biocyc.org/ecocyc/EcoCycUserGuide.shtml, [Google Scholar]
- Guide to the MetaCyc Database. SRI International; http://www.metacyc.org/MetaCycUserGuide.shtml, [Google Scholar]
- Henry CS, DeJongh M, Best AA, Frybarger PM, Linsay B, Stevens RL. High-throughput generation, optimization and analysis of genome-scale metabolic models. Nat Biotechnol. 2010;28(9):977–982. doi: 10.1038/nbt.1672. [DOI] [PubMed] [Google Scholar]
- How to Use a Pathway Tools Website. SRI International; http://biocyc.org/PToolsWebsiteHowto.shtml, [Google Scholar]
- Kanehisa M, Goto S, Furumichi M, Tanabe M, Hirakawa M. KEGG for representation and analysis of molecular networks involving diseases and drugs. Nucleic Acids Res. 2010;38(Database issue):D355–D360. doi: 10.1093/nar/gkp896. [DOI] [PMC free article] [PubMed] [Google Scholar]
- Karp PD, Paley SM, Krummenacker M, Latendresse M, Dale JM, Lee TJ, Kaipa P, Gilham F, Spaulding A, Popescu L, Altman T, Paulsen I, Keseler IM, Caspi R. Pathway Tools version 13.0: integrated software for pathway/genome informatics and systems biology. Brief Bioinform. 2010;11(1):40–79. doi: 10.1093/bib/bbp043. [DOI] [PMC free article] [PubMed] [Google Scholar]
- Keseler IM, Bonavides-Martinez C, Collado-Vides J, Gama-Castro S, Gunsalus RP, Johnson DA, Krummenacker M, Nolan LM, Paley S, Paulsen IT, Peralta-Gil M, Santos-Zavaleta A, Shearer AG, Karp PD. EcoCyc: a comprehensive view of Escherichia coli biology. Nucleic Acids Res. 2009;37(Database issue):D464–D470. doi: 10.1093/nar/gkn751. [DOI] [PMC free article] [PubMed] [Google Scholar]
- Kim TY, Kim HU, Park JM, Song H, Kim JS, Lee SY. Genome-scale analysis of Mannheimia succiniciproducens metabolism. Biotechnol Bioeng. 2007;97(4):657–671. doi: 10.1002/bit.21433. [DOI] [PubMed] [Google Scholar]
- Latendresse M, Karp PD. An advanced web query interface for biological databases. Database(Oxford) 2010;2010 doi: 10.1093/database/baq006. baq006. [DOI] [PMC free article] [PubMed] [Google Scholar]
- Liang C, Jaiswal P, Hebbard C, Avraham S, Buckler ES, Casstevens T, Hurwitz B, McCouch S, Ni J, Pujar A, Ravenscroft D, Ren L, Spooner W, Tecle I, Thomason J, Tung CW, Wei X, Yap I, Youens-Clark K, Ware D, Stein L. Gramene: a growing plant comparative genomics resource. Nucleic Acids Res. 2008;36(Database issue):D947–D953. doi: 10.1093/nar/gkm968. [DOI] [PMC free article] [PubMed] [Google Scholar]
- Ma H, Sorokin A, Mazein A, Selkov A, Selkov E, Demin O, Goryanin I. The Edinburgh human metabolic network reconstruction and its functional analysis. Mol Syst Biol. 2007;3:135. doi: 10.1038/msb4100177. [DOI] [PMC free article] [PubMed] [Google Scholar]
- May P, Christian JO, Kempa S, Walther D. ChlamyCyc: an integrative systems biology database and web-portal for Chlamydomonas reinhardtii. BMC Genomics. 2009;10:209. doi: 10.1186/1471-2164-10-209. [DOI] [PMC free article] [PubMed] [Google Scholar]
- Mazourek M, Pujar A, Borovsky Y, Paran I, Mueller L, Jahn MM. A dynamic interface for capsaicinoid systems biology. Plant Physiol. 2009;150(4):1806–1821. doi: 10.1104/pp.109.136549. [DOI] [PMC free article] [PubMed] [Google Scholar]
- McDonald AG, Boyce S, Tipton KF. ExplorEnz: the primary source of the IUBMB enzyme list. Nucleic Acids Res. 2009;37(Database issue):D593–D597. doi: 10.1093/nar/gkn582. [DOI] [PMC free article] [PubMed] [Google Scholar]
- Mueller LA, Zhang P, Rhee SY. AraCyc: a biochemical pathway database for Arabidopsis. Plant Physiol. 2003;132:453–460. doi: 10.1104/pp.102.017236. [DOI] [PMC free article] [PubMed] [Google Scholar]
- Rivals I, Personnaz L, Taing L, Potier MC. Enrichment or depletion of a GO category within a class of genes: which test? Bioinformatics. 2007;23(4):401–407. doi: 10.1093/bioinformatics/btl633. [DOI] [PubMed] [Google Scholar]
- Romero P, Wagg J, Green ML, Kaiser D, Krummenacker M, Karp PD. Computational prediction of human metabolic pathways from the complete human genome. Genome Biol. 2004;6(1):R2.1–R2.17. doi: 10.1186/gb-2004-6-1-r2. [DOI] [PMC free article] [PubMed] [Google Scholar]
- Salomonis N, Hanspers K, Zambon AC, Vranizan K, Lawlor SC, Dahlquist KD, Doniger SW, Stuart J, Conklin BR, Pico AR. GenMAPP 2: new features and resources for pathway analysis. BMC Bioinformatics. 2007;8:217. doi: 10.1186/1471-2105-8-217. [DOI] [PMC free article] [PubMed] [Google Scholar]
- Scheer M, Grote A, Chang A, Schomburg I, Munaretto C, Rother M, Sohngen C, Stelzer M, Thiele J, Schomburg D. BRENDA, the enzyme information system in 2011. Nucleic Acids Res. 2010 doi: 10.1093/nar/gkq1089. In Press. [DOI] [PMC free article] [PubMed] [Google Scholar]
- Schellenberger J, Park JO, Conrad TM, Palsson BO. BiGG: a Biochemical Genetic and Genomic knowledgebase of large scale metabolic reconstructions. BMC Bioinformatics. 2010;11:213. doi: 10.1186/1471-2105-11-213. [DOI] [PMC free article] [PubMed] [Google Scholar]
- Seo S, Lewin HA. Reconstruction of metabolic pathways for the cattle genome. BMC Syst Biol. 2009;3:33. doi: 10.1186/1752-0509-3-33. [DOI] [PMC free article] [PubMed] [Google Scholar]
- Snyder EE, Kampanya N, Lu J, Nordberg EK, Karur HR, Shukla M, Soneja J, Tian Y, Xue T, Yoo H, Zhang F, Dharmanolla C, Dongre NV, Gillespie JJ, Hamelius J, Hance M, Huntington KI, Jukneliene D, Koziski J, Mackasmiel L, Mane SP, Nguyen V, Purkayastha A, Shallom J, Yu G, Guo Y, Gabbard J, Hix D, Azad AF, Baker SC, Boyle SM, Khudyakov Y, Meng XJ, Rupprecht C, Vinje J, Crasta OR, Czar MJ, Dickerman A, Eckart JD, Kenyon R, Will R, Setubal JC, Sobral BW. PATRIC: the VBI PathoSystems Resource Integration Center. Nucleic Acids Res. 2007;35(Database issue):D401–D406. doi: 10.1093/nar/gkl858. [DOI] [PMC free article] [PubMed] [Google Scholar]
- Urbanczyk-Wochniak E, Sumner LW. MedicCyc: a biochemical pathway database for Medicago truncatula. Bioinformatics. 2007;23(11):1418–1423. doi: 10.1093/bioinformatics/btm040. [DOI] [PubMed] [Google Scholar]
- Valdes J, Veloso F, Jedlicki E, Holmes D. Metabolic reconstruction of sulfur assimilation in the extremophile Acidithiobacillus ferrooxidans based on genome analysis. BMC Genomics. 2003;4(1):51. doi: 10.1186/1471-2164-4-51. [DOI] [PMC free article] [PubMed] [Google Scholar]
- Wishart DS, Knox C, Guo AC, Eisner R, Young N, Gautam B, Hau DD, Psychogios N, Dong E, Bouatra S, Mandal R, Sinelnikov I, Xia J, Jia L, Cruz JA, Lim E, Sobsey CA, Shrivastava S, Huang P, Liu P, Fang L, Peng J, Fradette R, Cheng D, Tzur D, Clements M, Lewis A, De Souza A, Zuniga A, Dawe M, Xiong Y, Clive D, Greiner R, Nazyrova A, Shaykhutdinov R, Li L, Vogel HJ, Forsythe I. HMDB: a knowledgebase for the human metabolome. Nucleic Acids Res. 2009;37(Database issue):D603–D610. doi: 10.1093/nar/gkn810. [DOI] [PMC free article] [PubMed] [Google Scholar]
- Zhang P, Dreher K, Karthikeyan A, Chi A, Pujar A, Caspi R, Karp P, Kirkup V, Latendresse M, Lee C, Mueller LA, Muller R, Rhee SY. Creation of a genome-wide metabolic pathway database for Populus trichocarpa using a new approach for reconstruction and curation of metabolic pathways for plants. Plant Physiol. 2010;153(4):1479–1491. doi: 10.1104/pp.110.157396. [DOI] [PMC free article] [PubMed] [Google Scholar]


