Abstract
The cofilin pathway plays a central role in the regulation of actin polymerization and the formation of cell membrane protrusions that are essential for cell migration. Overexpression of cofilin has been linked to the aggressiveness of a variety of different cancers. In these cancers, the phosphorylation of cofilin at Ser3 is a key regulatory mechanism modulating cofilin activity. The activation status of cofilin has been directly linked to tumor invasion. Accordingly, in this study, we examined the expression of cofilin and its activation status in astrocytoma cell lines and astrocytic tumors. We show that cofilin expression was increased and correlated with increasing grade malignant astrocytoma. In addition, both cofilin and LIMK had elevated expression in astrocytoma cell lines. Knockdown of cofilin by siRNA altered astrocytoma cell morphology and inhibited astrocytoma migration and invasion. Conversely, overexpression of a cofilin phosphorylation mutant in an in vivo intracranial xenograft model resulted in a more highly invasive phenotype than those xenographs expressing wild-type cofilin. Animals harboring astrocytomas stably expressing the cofilin phosphorylation mutant (cofilin-S3A) demonstrated marked local invasiveness and spread across the corpus callosum to the contralateral hemisphere in all animals. Taken together, these data indicate that the cofilin activity pathway may represent a novel therapeutic target to diminish the invasion of these highly malignant tumors.
Keywords: astrocytoma, migration, invasion, cofilin, phosphorylation
Introduction
Of all the histopathological features that characterize astrocytomas, arguably none is as significant or sinister as their invasiveness into normal brain tissue. The most common causes for treatment failure and mortality are local recurrence and invasion of astrocytoma cells to another region of the brain. For a tumor cell to invade, it requires the cell to have definable leading and trailing edges in order for the migratory forces to exhibit directionality. Actin is necessary for the development of protrusive structures known as lamellipodia and filopodia. Tumor cell migration is the direct result of a complex balance between extracellular cues and responsive intracellular signals that lead to dynamic regulation of the actin cytoskeleton and associated adhesions.1-7
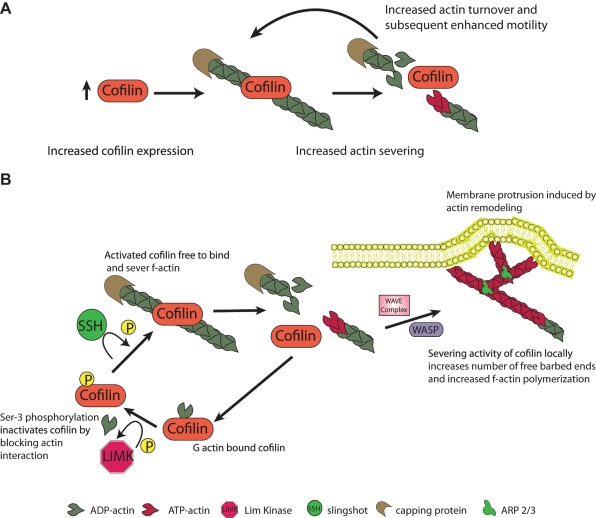
Actin filaments are polarized, and the formation of filamentous actin is a regulated process where soluble actin monomers (G-actin) are added to either the fast-growing barbed end or the slow-growing pointed end. Directional cell migration requires actin polymerization nucleated from free barbed ends. In response to external stimuli in a normal cell or deregulated signaling in the astrocytoma cell, actin polymerization occurs locally adjacent to the plasma membrane resulting in a force that causes protrusion of the membrane. The cofilin pathway plays a central role in the generation of free barbed ends and actin filament turnover that are required for actin polymerization driven membrane protrusion.8,9 The essential role of cofilin in cell migration was established in Drosophila, where the loss of function mutant twinstar (tsr) manifests severe defects in cell motility and migration.10 One potential model of cofilin function in the cell is increased local cofilin expression, which results in an increased rate of actin severing and depolymerization. This results in increased free G-actin and F-actin turnover and consequently enhanced cell motility (Figure 1A). Cofilin is tightly regulated both spatially and through posttranslational modifications such as phosphorylation that modulate its ability to interact with both monomeric actin (G-actin) and actin filaments (F-actin) (reviewed in Oser & Condeelis11 and van Rheenen et al.12). Cofilin exerts its effect on actin filament dynamics by binding to F-actin, severing the filament, resulting in a localized increase in the number of free barbed and pointed ends. The free ends promote either actin polymerization or depolymeration dependent upon the local concentration of G-actin and other actin associated proteins such as the capping proteins and the Arp2/3 complex.13 The Rho GTPases regulated LIM kinases (LIMK) and testis-specific kinases (TESK1 and TESK2) phosphorylate cofilin at the Ser 3 residue that renders cofilin unable to bind to actin thereby inactivating the protein.14,15 The phosphatases Slingshot (SSH) and chronophilin activate cofilin through dephosphorylation.16 Cofilin is dynamically regulated by cycles of phosphorylation such that the local concentrations of kinases and phosphatases determine the overall balance of cofilin activity (Figure 1B).
Figure 1.
Schematic of the cofilin function in the cell. (A) Localized increases in cofilin expression result in increased F-actin severing and depolymerization, which result in an increase in free G-actin, elevated actin turnover, and enhanced motility. (B) Model of the cofilin activity cycle regulated by a dynamic cycle of phosphorylation.
The cofilin pathway has also been implicated in tumor invasion and metastasis in a number of different tumor types.17-19 In brain tumors, Yap et al.20 previously examined the in vitro role of cofilin in astrocytoma motility. In their study, they overexpressed wild-type cofilin in a single astrocytoma cell line, U373, and found that overexpressed cofilin enhanced cell motility but in a concentration-dependent manner. Indeed, high overexpression of cofilin paradoxically reduced motility indicating there was a biphasic relationship between expression and motility. In the current study, we have investigated the role of the cofilin activity cycle in astrocytoma migration and invasion. We present data which demonstrate that cofilin expression is increased in astrocytoma cells and that the cofilin activity cycle that is regulated by phosphorylation significantly modulates astrocytoma migration and invasion in vitro and in vivo.
Results
Increased cofilin expression correlates with increasing grade in malignant astrocytoma
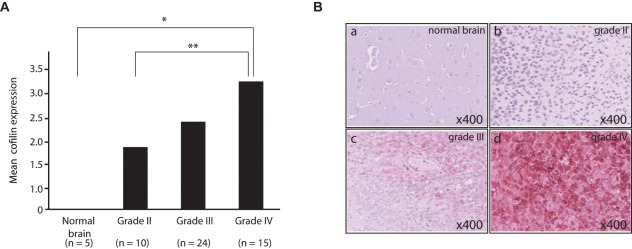
Using a commercially prepared tissue microarray (TMA) consisting of 55 astrocytoma samples (grades I-IV) and 5 nonneoplastic controls, we showed that cofilin immunoreactivity was significantly higher in high-grade astrocytomas (WHO grade IV) than in low-grade astrocytomas (WHO grade II) (P = 0.034). In addition, there was a significant difference in cofilin expression when non-neoplastic brain and astrocytomas were compared (P = 0.004) (Figure 2).
Figure 2.
Increased cofilin expression correlates with increasing grade malignant astrocytoma. (A) Results of cofilin immunohistochemistry on brain tumor tissue microarray represented as a bar graph showing distributions of total score of immunostaining for cofilin in each group according to histopathological grade of astrocytoma. Total scores were determined by both distribution within a section and staining intensity. Asterisks indicate statistically significant differences (*P = 0.004, **P = 0.034). (B) Images of representative specimens immunostained for cofilin from each group. The original histopathological diagnoses are normal brain (a), diffuse astrocytoma (grade II; b), anaplastic astrocytoma (grade III; c), and glioblastoma (grade IV; d) Original magnification 200×.
The cofilin activity cycle is altered in astrocytoma cells
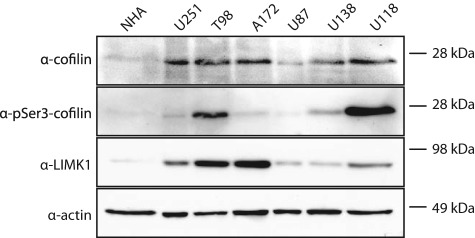
Next we evaluated a panel of established astrocytoma cell lines for cofilin expression to determine if there was a difference in cofilin expression relative to normal human astrocytes (NHAs). We observed elevated cofilin expression in all astrocytoma cell lines compared to minimal detection of cofilin expression in NHA cells (Figure 3). Given the importance of the cofilin activation cycle in regulation of the migratory machinery, we examined the phosphorylation status of cofilin in the astrocytoma cell lines. As shown in Figure 3, we detected variable levels of cofilin phosphorylation between astrocytoma cell lines. In addition, we assessed the expression of the cofilin regulatory kinase, LIMK1. Similar to the cofilin expression, LIMK1 demonstrated increased expression in all astrocytoma cell lines compared to NHAs. Taken together, this suggests that in addition to increased cofilin expression in astrocytomas, aberrant regulation of the cofilin activity cycle may modulate cell migration, invasion and/or adhesion.
Figure 3.
Elevated cofilin expression in astrocytoma cell lines. Western blot analysis for cofilin, LIM kinase 1 (LIMK1), and phosphorylated (pSer3) cofilin in normal human astrocytes (NHA) and human astrocytoma cell lines. The blot was reprobed for actin as a loading control. Compared to NHA controls, cofilin and LIMK have increased expression in astrocytoma cell lines. Additionally, increased phospho-cofilin is detected in astrocytoma samples potentially indicative of increased actin turnover during cytoskeletal remodeling.
Cofilin knockdown alters astrocytoma cell morphology
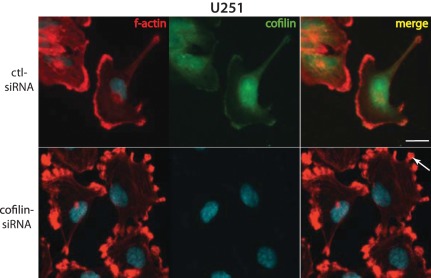
Given the central role of cofilin as an effector of the RhoGTPase pathway, we tested the effect of cofilin knockdown on astrocytoma cells. We selected the U251 astrocytoma cell line because it demonstrated a high level of endogenous cofilin expression relative other astrocytoma cell lines (Figure 3). Cofilin knockdown with ON-TARGETplus cofilin siRNA (Dharmacon, Lafayette,CO) resulted in a significant decrease in cofilin protein levels within 48 hours after siRNA transfection. Remarkably, we observed changes in astrocytoma cell morphology following immunostaining for actin and cofilin. U251 astrocytoma cells treated with control scrambled siRNAs appeared flattened with few membrane extensions. In contrast, following transfection with cofilin-siRNA, U251 cells showed an enrichment of actin at the plasma membrane (Figure 4, arrows) suggesting that diminished expression of cofilin leads to a stabilization of actin filaments.
Figure 4.
Knockdown of cofilin stabilizes actin rich structures and alters cell morphology in astrocytoma cells. Cells were imaged 72 hours after transfection of either ctl-siRNA or cofilin-siRNA. Morphological changes were observed in U251 cells. The cells were labeled with Texas Red-X phalloidin for F-actin and immunostained with anti-cofilin antibody followed by Alexa Fluor 488-conjugated anti-mouse antibody. Altered morphology in treated cells are marked with arrows. Bar 40 mm.
Cofilin knockdown inhibits astrocytoma migration and invasion
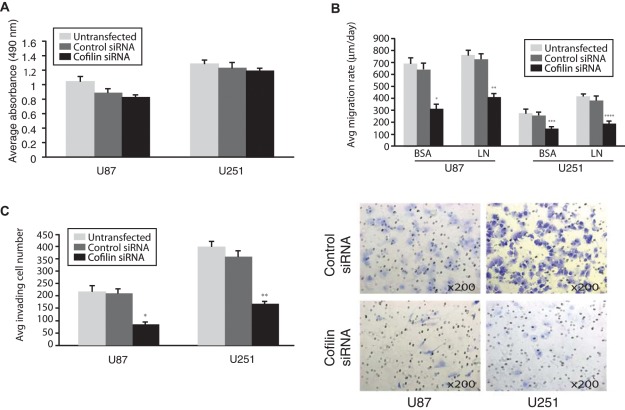
Given the profound change in astrocytoma morphology following siRNA treatment, we tested the effect of cofilin knockdown on the ability of astrocytoma cells to migrate and invade in vitro. To rule out that cell viability was affected by cofilin knockdown, we assessed cell proliferation in U87 and U251 astrocytoma cells following cofilin knockdown. As shown in Figure 5A, we did not detect a statistically significant decrease in cell viability when measured in an MTS cell growth assay.
Figure 5.
Migration and invasion of astrocytoma cells is inhibited by cofilin knockdown. (A). Results of MTS [3-(4,5-dimethylthiazol-2-yl)-5-(3-carboxymethoxyphenyl)-2-(4-sulfophenyl)-2H-tetrazolium, inner salt] assays. U87 and U251 cells untransfected or transfected with control and cofilin siRNAs were cultured for 72 hours and then incubated for 1 hour with MTS. Bar graphs show the average absorbance at 490 nm after the incubation with MTS. Any statistically significant differences could not be observed. (B) Bar graph representation of migration assay of U87 and U251 cells untransfected or transfected with control and cofilin siRNAs seeded through a cell sedimentation manifold to establish a circular confluent monolayer on bovine serum albumin (BSA) or laminin (LN) coated substrates. (*P = 0.009, **P = 0.0005, ***P = 0.032, ****P = 0.016) (C) Bar graph representation of the average invading cell number through the Matrigel invasion chamber membrane. Asterisks indicate statistically significant differences (*P = 0.003, **P = 0.0006). Photomicrographs of the membranes with the invading cells stained with 0.5% crystal violet. Original magnification 200×.
To assess the effects of cofilin knockdown on cell migration, we used radial migration assays to analyze astrocytoma migration on surfaces coated with bovine serum albumin (BSA) and the extracellular matrix component, laminin (LN). We observed a statistically significant decrease in cell migration in both astrocytoma cell lines following cofilin depletion on both substratum constituents compared to untransfected or scrambled siRNA controls (Figure 5B).
The results from the radial cell migration assay indicate that cofilin plays an important role in astrocytoma migration. Accordingly, we tested the effect of the modulation of cofilin expression on in vitro astrocytoma cell invasion. In both U87 and U251 cofilin depleted cells, there was a significant decrease in invasiveness through Transwell filters compared to their scrambled siRNA control counterparts (U87; P = 0.003: U251; P = 0.0006) (Figure 5C).
Disruption of the cofilin activation cycle alters astrocytoma migration
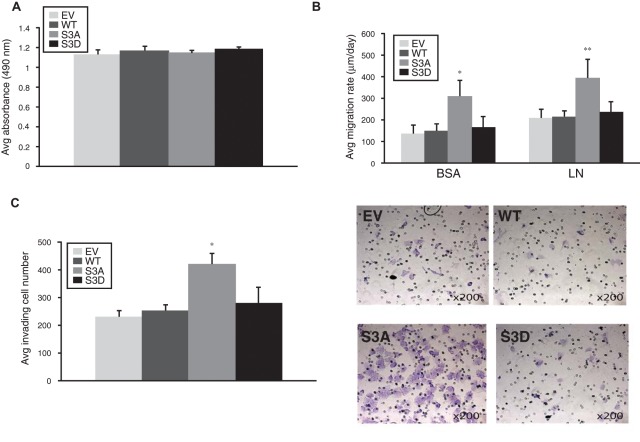
We used U251 cells stably expressing cofilin phosphorylation mutants to test the role of the cofilin activation pathway in human astrocytomas (Figure 6). For these experiments, a critical phosphorylation site at serine 3 either was mutated to alanine (S3A), which represented constitutively active cofilin that was incapable of being phosphorylated, or was mutated to aspartic acid (S3D) to represent inactive cofilin that is a mimic of constitutive phosphorylation.21,22 To rule out effects on cell viability, we conducted an MTS assay on U251 cells expressing empty vector (EV), wild-type cofilin (WT), constitutively active cofilin (S3A), or constitutively inactive cofilin (S3D) and did not observe any statistically significant difference in cell viability (Figure 7A). However, when we analyzed the effects of overexpression of the cofilin phosphomutants on migration and invasion, we observed a large, statistically significant increase in both migration and invasion of the cofilin-S3A phosphomutant, indicating that modulation of the balance of cofilin activity in astrocytoma cells affects astrocytoma cell motility in vitro (Figure 7B and 7C).
Figure 6.
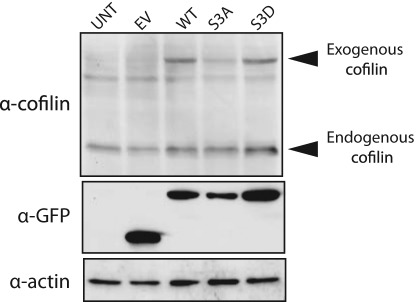
Generation of stable cofilin wild-type (WT) and phosphorylation mutants tagged with green fluorescent protein (GFP). Western blot analysis of cell lysates prepared from untransfected U251, U251 cells stably transfected with empty pEGFP vector (EV), and U251 cells overexpressing WT, serine 3A mutant (S3A), and serine 3D mutant cofilin (S3D). Upper and lower arrow heads mark exogenous GFP-cofilin fusion protein and endogenous cofilin, respectively.
Figure 7.
Alteration of cofilin activity cycle modulates astrocytoma migration and invasion. (A) Results of MTS [3-(4,5-dimethylthiazol-2-yl)-5-(3-carboxymethoxyphenyl)-2-(4-sulfophenyl)-2H-tetrazolium, inner salt] assay. EV, WT, S3A, and S3D cells were cultured for 72 hours and then incubated for 1 hour with MTS. Bar graphs show the average absorbance at 490 nm after the incubation with MTS. Any statistically significant differences could not be observed. (B) Results of cell migration assays. EV, WT, S3A, and S3D cells were seeded through a cell sedimentation manifold to establish a circular confluent monolayer on substrate-coated wells (bovine serum albumin [BSA] or laminin [LN]). The cells were allowed to migrate for 24 hours, and photographs were taken before and after migration. Bar graphs show average migration rate calculated as the change in the diameter of the circle circumscribing the cell population over a 24-hour period. Asterisks indicate statistically significant differences (*P = 0.006, **P = 0.005). (C) Results of cell invasion assay. (Left) Bar graphs showing the average invading cell number through the Matrigel-precoated membrane with 8-mm pores within 24 hours in 6 random light microscopic fields magnified at 200 times. Asterisk indicates statistically significant difference (*P = 0.011). (Right) Photomicrographs of the membranes with the invading cells stained with 0.5% crystal violet. Original magnification 200×.
Expression of cofilin phosphorylation mutant in vivo increases astrocytoma invasiveness
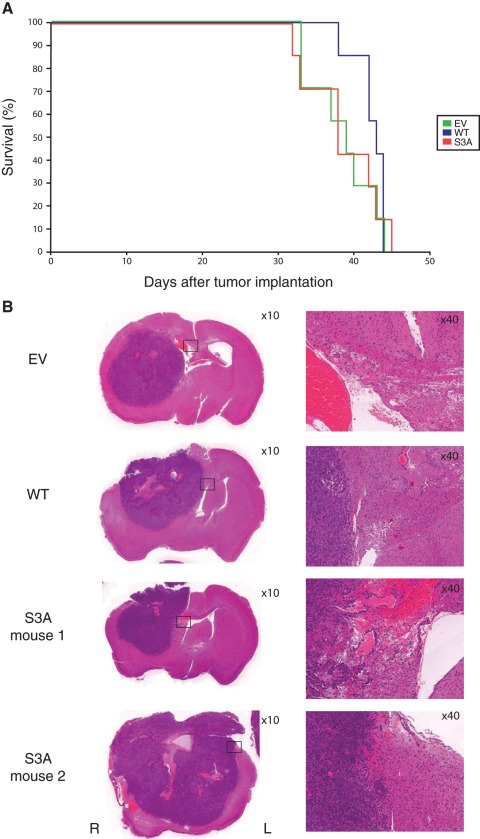
Given that the cofilin-S3A mutant demonstrated increased migration and invasion in vitro, we evaluated the effect of altering the cofilin phosphorylation cycle in vivo using an intracranial astrocytoma xenograft model. The U251 astrocytoma cell line has been well characterized to form astrocytomas intracranially 6 to 8 weeks following implantation of 1 × 10⁶ cells23 and is characterized by a well circumscribed border between the engrafted astrocytoma and the surrounding brain. Stable U251 cells expressing either empty vector (EV), wild-type cofilin (WT), or cofilin-S3A (S3A) were implanted into the brains of athymic mice. Given that the S3D mutant expressing cells did not affect migration or invasion in vitro, these cells were excluded from the mouse xenograft studies. Kaplan-Meier survival analysis resulted in no significant difference in overall survival between the 3 groups indicating that cofilin overexpression did not alter the tumor growth rate (Figure 8A). However, when the brains of the mice were examined histologically, differences in microscopic invasion and spread to the contralateral hemisphere were observed. All implanted astrocytomas originating from the cofilin-S3A cells exhibited focal microscopic invasion (Figure 8B and Table 1) compared to 71% and 86% of empty vector and wild-type cofilin xenografts, respectively. When the whole brain was examined for spread to the contralateral cerebral hemisphere, 43% of the EV and 29% of WT astrocytoma xenografts compared to 100% of S3A xenografts spread to the contralateral hemisphere, indicating that expression of the cofilin phosphorylation mutant enhanced the extent of migration of astrocytoma cells in vivo (Table 1).
Figure 8.
Modulation of the cofilin activity cycle increases in vivo invasiveness but not overall survival. (A) Kaplan-Meier survival curves for nude mice with orthotopic intracranial xenografts of U251 cells stably transfected with empty pEGFP vector (EV) and U251 cells stably overexpressing wild-type (WT) and S3A mutant cofilin (S3A). Any statistically significant differences determined by the Wilcox on matched-pairs signed-ranks test could not be observed among the 3 groups. (B) Photomicrographs of the representative sections of the orthotopic intracranial xenograft with EV, WT, and S3A. Invasions to the contralateral cerebral hemisphere or the corpus callosum were observed in the xenografts with S3A. The sections were stained with hematoxylin and eosin. Original magnifications are 10× (left) and 40× (right).
Table 1.
Summary of the Findings of Orthotopic Intracranial Xenografts of U251 Cells Stably Transfected with Empty pEGFP Vector and U251 Cells Stably Overexpressing Wild-Type Cofilin and S3A Mutant Cofilin
| Transplanted with | Number of mice examined | Median survival, days | Microscopic invasion (cases) | Invasion to the contralateral cerebral hemisphere or the corpus callosum (cases) |
|---|---|---|---|---|
| Empty vector | 7 | 39 | 5 (71%) | 3 (43%) |
| Wild-type cofilin | 7 | 43 | 6 (86%) | 2 (29%) |
| S3A mutant cofilin | 7 | 38 | 7 (100%) | 7 (100%) |
Discussion
In this study we observed that overexpression of cofilin in the context of a patient sample tissue microarray correlates with increasing grade of astrocytoma. Furthermore, we demonstrate for the first time, through the use of functional assays, a role for cofilin in astrocytoma migration and invasion. Finally, we have evaluated the consequence of perturbing the cofilin activity cycle by demonstrating with an in vivo intracranial xenograft mouse model that tumors expressing a cofilin phosphorylation mutant have increased invasiveness compared to controls.
Elevated cofilin expression has been documented in a number of malignancies including renal cell, ovarian, and oral squamous carcinomas.17-19 Cofilin is also overexpressed in A549 lung cancer cells, pancreatic cancer cells, and the rat C6 glioblastoma cell line.24-26 In addition, cofilin overexpression has been linked to an invasive subpopulation in rat mammary tumors.27 Previously, van Rheenen et al.12 established that alterations in a common cofilin activity cycle regulates invasion in many tumor and inflammatory cells.
Interestingly, cofilin has also been shown to be downregulated in several tumor types including hepatocellular carcinoma cells and certain ovarian cancer subtypes.28,29 Furthermore, restoration of cofilin expression in H1299 lung cancer cells was found to be inhibitory to invasion.30 These seemingly contradictory data indicate that the context of the entire cofilin activity cycle must be taken into consideration when evaluating the role of cofilin in tumor invasion. Put in other terms, it is likely the balance of cofilin activity in tumor cells in addition to its chief co-regulatory molecules that tips the scales in favor of tumor invasion.
A simple interpretation may indicate that cofilin expression mediates invasiveness in a cell context dependent manner. Given our results where there is variable expression of cofilin in astrocytoma cells, we propose it is the total activity of the cofilin pathway that must be evaluated to fully understand the invasive nature of certain tumors.31 Evidence for this has been found through the examination of cofilin pathway members that directly regulate cofilin. Yoshioka et al.32 identified that LIMK1 expression correlated with invasiveness in breast cancer cells. LIM kinases inactivate cofilin through phosphorylation that prevents cofilin from interacting with actin. Overexpression in these tumors is postulated to perturb the balance of the cofilin activity cycle by decreasing the local concentrations of unphosphorylated active cofilin.32 Cofilin activity is regulated not only by phosphorylation but also by subcellular localization that influences cofilin intermolecular interactions. For example, when cofilin is localized at the plasma membrane it can be inactivated through interactions with phosphatidylinositol (4,5)-bisphosphate (PtdIns(4,5)P2).33 Cofilin translocation to the F-actin sub-plasma membrane domain is mediated by PLCγ activity, which results in cofilin activation and binding to actin. Active cofilin severs the actin filaments, which increases the local concentration of free barbed ends thereby stimulating further branching and polymerization of actin filaments (see schematic in Figure 1).
In the context of astrocytomas, cofilin was observed to be upregulated in the C6 rat glioma cell line using serial analysis of gene expression.26 In a human astrocytoma cell line, increased cofilin expression was shown to enhance astrocytoma cell motility to a certain threshold concentration. Exogenous expression of cofilin higher than this threshold resulted in inhibition of migration, providing further support to the concept that local balance of subcellular concentrations of cofilin determines its function.20 In the current report, we extended the observations by Yap et al.20 to investigate the cofilin pathway in primary patient samples. Furthermore, the current study demonstrates that disruption of cofilin activity has significant effects on cell migration and invasion both in vitro and in vivo. It would have been interesting to analyze the expression of phospho-cofilin and the cofilin pathway regulators LIMK1 and Slingshot on the tissue micro-array; however, our attempts were limited due to unavailable reagents that worked reliably on paraffin embedded TMA specimens. In the future, as reagents become available, it would be interesting to assess how cofilin phosphorylation status correlates with tumor aggressiveness and patient survival. Our study also looked at multiple astrocytoma cell lines and noted not only elevated cofilin expression but also increased LIMK1 expression that parallels the observation by Wang et al.27 in invasive breast carcinoma cells.
In summary, we tested the effects of cofilin and cofilin mutants on astrocytoma cell migration and invasion both in vitro and in a mouse intracranial xenograft model of astrocytoma. In vitro, depletion of the active pool of cofilin by siRNA inhibited migration and invasion. Conversely, overexpression of a cofilin phosphorylation mutant in vivo resulted in a tumor that not only had increased invasiveness at the microscopic tumor margin but also exhibited increased spread to the contralateral hemisphere compared to controls. Although we observed increased invasiveness in the cofilin phosphorylation mutant, we unexpectedly did not see a change in overall survival. We reason that the astrocytoma cells used in this experiment aggressively form tumors within 60 days, and given that the animals are sacrificed as soon as they show any signs of overt disease, this may result in a narrow window of time that is unsuitable to distinguish subtle differences in survival. Interestingly, we did not see any difference between cofilin wild-type and cofilin-S3D phosphorylation mutant when compared to cofilin-S3A mutant. This can be explained given that the cofilin-S3A is incapable of being phosphorylated and thus remains in an active state and is able to promote actin turnover. In contrast, the cofilin-S3D mutant is a phospho-mimic and results in a pool of inactive cofilin that does not exert a dominant negative effect on the cofilin activity cycle.
Taken together, these findings suggest that in astrocytomas, analysis of the expression and activity of cofilin, LIMK1, and potentially other cofilin pathway proteins in patient samples may predict astrocytoma aggressiveness and should be further evaluated for prognostic significance and as future targets to inhibit human astrocytoma invasiveness.
Materials and Methods
Cell culture
Normal Human Astrocytes (NHAs, Lonza, Walkersville, MD) were cultured in specialized media obtained from the manufacturer (Astrocyte Basal Medium containing rhEGF; insulin, ascorbic acid, GA-1000, L- glutamine, and FBS). The permanent, well-characterized U251, U138, U118, A172, and T98 human astrocytoma cell lines were maintained in Dulbecco’s modified eagle’s medium (DMEM) (Wisent, St Bruno, QC) with 10% fetal bovine serum (FBS) (HyClone Laboratories Inc., Logan, UT). The U87 cell line was maintained in minimum essential medium (MEM) supplemented with 10% FBS. Cells were cultured in a 37°C, 5% CO2 humidified chamber.
Tissue microarray and immunohistochemistry
Tissue micro-array staining was done using the commercially available brain tumor tissue microarray GL803 (US Biomax Inc., Rockville, MD), which consists of 55 astrocytic tumor specimens and 5 normal brain specimens. The patient population included 22 male and 33 female tumor specimens, with a mean patient age of 41.7 years (range, 4-68), and 3 male and 2 female normal control specimens, with a mean patient age of 45.8 years (range, 30-52). Of the astrocytic tumor specimens, 5 were grade I, 10 were grade II, 24 were grade III, and 15 were grade IV. Tumor grade data were provided by US Biomax Inc., and determined according to the 2007 WHO grading system. Immunohistochemistry was performed as previously reported using anti-cofilin antibodies (AbD Serotec, Oxford UK).34 Cofilin immunostaining was graded semi-quantitatively using a score ranging from 0 to 3 based on the extent of positive staining in 5 fields of view per tumor core: score 0 = 0%, score I = 1-30%; score II = 31-70%; and score III = 71% or more positive tumor cells. Total scores were determined by both distribution within a section and staining intensity relative to normal brain controls (scoring based on semi-quantitative measure of staining intensity per cell was scored on relative intensity level (0 = equivalent; 1 = moderate increase; 2 = high increase) above normal brain controls.
Expression constructs and siRNA
For gene silencing, an siRNA quadriplex specific to human cofilin 1 (NM_005507) ON-TARGETplus SMARTpool (L-012707-00; Dharmacon, Thermo Scientific, Waltham, MA) was obtained commercially. The ON-TARGETplus siRNA sequences contain modifications to both the sense and antisense strands to minimize off-target effects by more than 90%. Cofilin constructs, serine 3A and serine 3D mutants, were generated by PCR based mutagenesis (Stratagene, La Jolla, CA) using wild-type cofilin obtained from the Mammalian Gene Collection (I.M.A.G.E. Consortium [LLNL] cDNA Clones)35 and subcloned into amino terminal GFP epitope tagged (pEGFP) mammalian expression vectors (Clontech, Palo Alto, CA). All constructs and mutants were verified by sequencing (ACGT Corporation, Toronto, ON).
Western blot analysis
Cell lysates were prepared from cultured astrocytoma cells by scraping 90% confluent 10-cm dishes into 1 mL of lysis buffer (50 mM HEPES, pH 7.5, 150 mM NaCl, 1.5 mM MgCl2, 1% [vol/vol] Triton X-100, 10% [vol/vol] glycerol, and protease inhibitors (Roche Molecular Biochemicals) and centrifuged at 14,000 rpm to pellet the insoluble material. The protein concentrations of cell lysates were determined using the MicroBCA kit (Pierce, Rockford, IL) according to the manufacturer’s directions. Equivalent amounts of protein were separated by SDS-PAGE, transferred onto PVDF membrane (Immobilon-P, Millipore, Billerica, MA), and immunoblotted with primary antibodies as follows: anti-LIMK1 1:500 (Cell Signaling Technology, Danvers, MA), anti-Cofilin 1:500 (Abcam, Cambridge, UK), anti-phospho-Cofilin 1:500 (Cell Signaling Technology), and anti-b-actin 1:1000 (Sigma, St. Louis, MO). Bound antibodies were visualized using HRP-conjugated protein A (Bio-Rad, Hercules, CA) or goat anti-mouse in conjunction with a chemiluminescence reagent system (PerkinElmer Life Sciences Inc., Boston, MA).
Immunofluorescence and confocal microscopy
For immunofluorescence examination of astrocytoma cell lines, astrocytoma cells were plated onto coverslips 24 hours after siRNA transfection. At 72 hours after transfection, cells were washed 3 times with PBS and fixed with 4% paraformaldehyde and 750 µL of 1M sucrose for 30 minutes and then permeabilized for 10 minutes using 0.2% Triton X-100 in PBS at room temperature. Nonspecific binding was blocked by 5% BSA in PBS for 30 minutes at room temperature. Subsequently, cells were incubated with anti-cofilin antibody (Cell Signaling Technology; 1:100) for 30 minutes in a 37°C incubator. After washing, cells were then incubated with Alexa-Fluor 488 (1:200, Molecular Probes, Eugene, OR) conjugated anti-rabbit IgG secondary antibody. For double labeling with F-actin, cells were co-incubated with Texas Red-X phalloidin (1:50; Molecular Probes), and the DNA was stained with DAPI (Promega, Madison, WI). To visualize fluorescence, a Zeiss Axiovert 200M Spinning Disk confocal microscope (Carl Zeiss Inc., Gottingen, Germany) equipped with a Hamamatsu Back-Thinned EM-CCD camera (Hamamatsu Corporation, Bridgewater, NJ) was used.
Radial cell migration assay
Cell migration assays were performed using the micrometer-scale radial monolayer assay as described previously.36,37 Briefly, to establish a circular confluent monolayer at the center of the substrate-coated well, siRNA treated cells were seeded through a cell sedimentation manifold (CSM Inc., Phoenix, AZ) at 2,000 cells per well. Photographs were acquired 22 hours after plating, and a circle of best-fit circumscribing the cells was drawn representing the first time point. The cells were allowed to migrate for 24 hours, and then another circle circumscribing the newly migrated cells was made. The average migration rate was calculated as the change in the diameter of the circle circumscribing the cell population over a 24-hour period and expressed as micrometers per 24 hours. Photomicrographs were taken with an inverted microscope (Leica DM IRE2; Leica Microsystems, Inc., Bannockburn, IL) and studied using image-analysis software (Scion Image, Frederick, MD). All experiments were done in triplicate and repeated 3 times.
Transwell cell invasion assay
A cell invasion assay was carried out using modified Boyden chambers that consisted of Transwell-coated Matrigel membrane filter inserts with 8-µm pores in 24-well tissue culture plates (BD Biosciences, Bedford, MA) as described previously.37 Astrocytoma cells (4 × 10⁴ cells) treated with siRNA (control or cofilin specific) were plated onto the top of the chamber in DMEM with 5% FBS. The bottom chamber was filled with DMEM containing 20% FBS as a chemo-attractant. Plates were incubated for 24 hours in a 5% CO2 humidified chamber at 37°C. Non-invading cells were wiped off the upper surface of the membrane with a cotton swab, and the filter membrane was fixed with 4% paraformaldehyde and stained with 0.5% crystal violet. The degree of invasion was determined by counting the number of cells that had migrated through the membrane in at least 6 random fields (total magnification, 200×) per filter. Experiments were repeated 3 times in triplicate.
Xenograft in vivo invasion assay
Six week-old male nu/nu mice were purchased from Charles River Canada Labs (St. Constant, Quebec, Canada). All procedures in mice were reviewed and approved by the Animal Care Committee and Research Ethics Board, the Hospital for Sick Children.
Approximately 1.0 × 10⁶ stably expressing cofilin wild-type or cofilin mutant cells were stereotactically injected into the right frontal lobe of athymic mice at a depth of 2 mm through a 0.5-mm burr hole 2 mm lateral to the sagittal suture and 1 mm anterior to the coronal suture using the rodent head frame, Lab Standard Stereotaxic Instrument (Stoelting, Wood Dale, IL). Mice demonstrating 20% body weight loss or difficulty ambulating, feeding, or grooming were sacrificed. The mouse brains were then removed and fixed in 10% formalin before histological examination using hematoxylin and eosin and immunohistochemistry with cofilin antibodies.
Statistical analysis
Survival curves were generated by the Kaplan-Meier method. The log-rank statistic was used to compare the distributions of survival times. All reported P values were 2-sided and were considered to be statistically significant at P < 0.05.
Footnotes
The author(s) declared no potential conflicts of interest with respect to the research, authorship, and/or publication of this article.
The author(s) disclosed receipt of the following financial support for the research, authorship, and/or publication of this article: This work was supported by grants from the Canadian Institutes of Health Research (CIHR; MOP 74610), b.r.a.i.n.child, the Wiley Fund and the Laurie Berman Fund for Brain Tumour Research at the Hospital for Sick Children. James Rutka is a scientist of the CIHR.
References
- 1. Frame MC, Brunton VG. Advances in Rho-dependent actin regulation and oncogenic transformation. Curr Opin Genet Dev. 2002;12:36-43 [DOI] [PubMed] [Google Scholar]
- 2. Hall A. The cytoskeleton and cancer. Cancer Metastasis Rev. 2009;28:5-14 [DOI] [PubMed] [Google Scholar]
- 3. Symons M, Segall JE. Rac and Rho driving tumor invasion: who’s at the wheel? Genome Biol. 2009;10:213. [DOI] [PMC free article] [PubMed] [Google Scholar]
- 4. Naumanen P, Lappalainen P, Hotulainen P. Mechanisms of actin stress fibre assembly. J Microsc. 2008;231:446-54 [DOI] [PubMed] [Google Scholar]
- 5. Small JV, Auinger S, Nemethova M, et al. Unravelling the structure of the lamellipodium. J Microsc. 2008;231:479-85 [DOI] [PubMed] [Google Scholar]
- 6. Mattila PK, Lappalainen P. Filopodia: molecular architecture and cellular functions. Nat Rev Mol Cell Biol. 2008;9:446-54 [DOI] [PubMed] [Google Scholar]
- 7. Ridley AJ, Schwartz MA, Burridge K, et al. Cell migration: integrating signals from front to back. Science. 2003;302:1704-9 [DOI] [PubMed] [Google Scholar]
- 8. Ghosh M, Song X, Mouneimne G, Sidani M, Lawrence DS, Condeelis JS. Cofilin promotes actin polymerization and defines the direction of cell motility. Science. 2004;304:743-6 [DOI] [PubMed] [Google Scholar]
- 9. Hotulainen P, Paunola E, Vartiainen MK, Lappalainen P. Actin-depolymerizing factor and cofilin-1 play overlapping roles in promoting rapid F-actin depolymerization in mammalian nonmuscle cells. Mol Biol Cell. 2005;16:649-64 [DOI] [PMC free article] [PubMed] [Google Scholar]
- 10. Chen J, Godt D, Gunsalus K, Kiss I, Goldberg M, Laski FA. Cofilin/ADF is required for cell motility during Drosophila ovary development and oogenesis. Nat Cell Biol. 2001;3:204-9 [DOI] [PubMed] [Google Scholar]
- 11. Oser M, Condeelis J. The cofilin activity cycle in lamellipodia and invadopodia. J Cell Biochem. 2009;108:1252-62 [DOI] [PMC free article] [PubMed] [Google Scholar]
- 12. van Rheenen J, Condeelis J, Glogauer M. A common cofilin activity cycle in invasive tumor cells and inflammatory cells. J Cell Sci. 2009;122:305-11 [DOI] [PMC free article] [PubMed] [Google Scholar]
- 13. Ichetovkin I, Grant W, Condeelis J. Cofilin produces newly polymerized actin filaments that are preferred for dendritic nucleation by the Arp2/3 complex. Curr Biol. 2002;12:79-84 [DOI] [PubMed] [Google Scholar]
- 14. Arber S, Barbayannis FA, Hanser H, et al. Regulation of actin dynamics through phosphorylation of cofilin by LIM-kinase. Nature. 1998;393:805-9 [DOI] [PubMed] [Google Scholar]
- 15. Moriyama K, Iida K, Yahara I. Phosphorylation of Ser-3 of cofilin regulates its essential function on actin. Genes Cells. 1996;1:73-86 [DOI] [PubMed] [Google Scholar]
- 16. Niwa R, Nagata-Ohashi K, Takeichi M, Mizuno K, Uemura T. Control of actin reorganization by Slingshot, a family of phosphatases that dephosphorylate ADF/cofilin. Cell. 2002;108:233-46 [DOI] [PubMed] [Google Scholar]
- 17. Unwin RD, Craven RA, Harnden P, et al. Proteomic changes in renal cancer and co-ordinate demonstration of both the glycolytic and mitochondrial aspects of the Warburg effect. Proteomics. 2003;3:1620-32 [DOI] [PubMed] [Google Scholar]
- 18. Martoglio AM, Tom BD, Starkey M, Corps AN, Charnock-Jones DS, Smith SK. Changes in tumorigenesis- and angiogenesis-related gene transcript abundance profiles in ovarian cancer detected by tailored high density cDNA arrays. Mol Med. 2000;6:750-65 [PMC free article] [PubMed] [Google Scholar]
- 19. Turhani D, Krapfenbauer K, Thurnher D, Langen H, Fountoulakis M. Identification of differentially expressed, tumor-associated proteins in oral squamous cell carcinoma by proteomic analysis. Electrophoresis. 2006;27:1417-23 [DOI] [PubMed] [Google Scholar]
- 20. Yap CT, Simpso TI, Pratt T, Price DJ, Maciver SK. The motility of glioblastoma tumour cells is modulated by intracellular cofilin expression in a concentration-dependent manner. Cell Motil Cytoskeleton. 2005;60:153-65 [DOI] [PubMed] [Google Scholar]
- 21. Zebda N, Bernard O, Bailly M, Welti S, Lawrence DS, Condeelis JS. Phosphorylation of ADF/cofilin abolishes EGF-induced actin nucleation at the leading edge and subsequent lamellipod extension. J Cell Biol. 2000;151:1119-28 [DOI] [PMC free article] [PubMed] [Google Scholar]
- 22. Mouneimne G, Desmarais V, Sidani M, et al. Spatial and temporal control of cofilin activity is required for directional sensing during chemotaxis. Curr Biol. 2006;16:2193-205 [DOI] [PubMed] [Google Scholar]
- 23. Candolfi M, Curtin JF, Nichols WS, et al. Intracranial glioblastoma models in preclinical neuro-oncology: neuropathological characterization and tumor progression. J Neurooncol. 2007;85:133-48 [DOI] [PMC free article] [PubMed] [Google Scholar]
- 24. Keshamouni VG, Michailidis G, Grasso CS, et al. Differential protein expression profiling by iTRAQ-2DLC-MS/MS of lung cancer cells undergoing epithelial-mesenchymal transition reveals a migratory/invasive phenotype. J Proteome Res. 2006;5:1143-54 [DOI] [PubMed] [Google Scholar]
- 25. Sinha P, Hutter G, Kottgen E, Dietel M, Schadendorf D, Lage H. Increased expression of epidermal fatty acid binding protein, cofilin, and 14-3-3-sigma (stratifin) detected by two-dimensional gel electrophoresis, mass spectrometry and microsequencing of drug-resistant human adenocarcinoma of the pancreas. Electrophoresis. 1999;20:2952-60 [DOI] [PubMed] [Google Scholar]
- 26. Gunnersen JM, Spirkoska V, Smith P, Danks RA, Tan SS. Growth and migration markers of rat C6 glioma cells identified by serial analysis of gene expression. Glia. 2000;32:146-54 [PubMed] [Google Scholar]
- 27. Wang W, Goswami S, Lapidus K, et al. Identification and testing of a gene expression signature of invasive carcinoma cells within primary mammary tumors. Cancer Res. 2004;64:8585-94 [DOI] [PubMed] [Google Scholar]
- 28. Ding SJ, Li Y, Shao XX, et al. Proteome analysis of hepatocellular carcinoma cell strains, MHCC97-H and MHCC97-L, with different metastasis potentials. Proteomics. 2004;4:982-94 [DOI] [PubMed] [Google Scholar]
- 29. Smith-Beckerman DM, Fung KW, Williams KE, Auersperg N, Godwin AK, Burlingame AL. Proteome changes in ovarian epithelial cells derived from women with BRCA1 mutations and family histories of cancer. Mol Cell Proteomics. 2005;4:156-68 [DOI] [PubMed] [Google Scholar]
- 30. Lee YJ, Mazzatti DJ, Yun Z, Keng PC. Inhibition of invasiveness of human lung cancer cell line H1299 by over-expression of cofilin. Cell Biol Int. 2005;29:877-83 [DOI] [PubMed] [Google Scholar]
- 31. Wang W, Mouneimne G, Sidani M, et al. The activity status of cofilin is directly related to invasion, intravasation, and metastasis of mammary tumors. J Cell Biol. 2006;173:395-404 [DOI] [PMC free article] [PubMed] [Google Scholar]
- 32. Yoshioka K, Foletta V, Bernard O, Itoh K. A role for LIM kinase in cancer invasion. Proc Natl Acad Sci U S A. 2003;100:7247-252 [DOI] [PMC free article] [PubMed] [Google Scholar]
- 33. van Rheenen J, Song X, van Roosmalen W, et al. EGF-induced PIP2 hydrolysis releases and activates cofilin locally in carcinoma cells. J Cell Biol. 2007;179:1247-59 [DOI] [PMC free article] [PubMed] [Google Scholar]
- 34. Seol HJ, Smith CA, Salhia B, Rutka JT. The guanine nucleotide exchange factor SWAP-70 modulates the migration and invasiveness of human malignant glioma cells. Transl Oncol. 2009;2:300-9 [DOI] [PMC free article] [PubMed] [Google Scholar]
- 35. Lennon G, Auffray C, Polymeropoulos M, Soares MB. The I.M.A.G.E. Consortium: an integrated molecular analysis of genomes and their expression. Genomics. 1996;33:151-2 [DOI] [PubMed] [Google Scholar]
- 36. Salhia B, Rutten F, Nakada M, et al. Inhibition of Rho-kinase affects astrocytoma morphology, motility, and invasion through activation of Rac1. Cancer Res. 2005;65:8792-800 [DOI] [PubMed] [Google Scholar]
- 37. Valster A, Tran NL, Nakada M, Berens ME, Chan AY, Symons M. Cell migration and invasion assays. Methods. 2005;37:208-15 [DOI] [PubMed] [Google Scholar]


