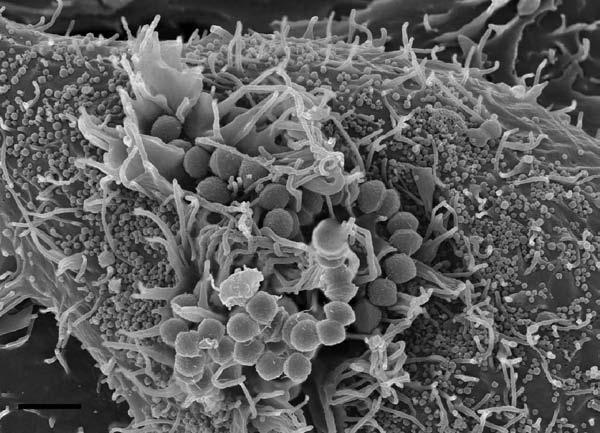
Scanning Electron Microscopy
With the increasing number of advanced imaging tools available, the utility of conventional imaging techniques is often overlooked. In fact, the ability to visualize structures with the high resolution achieved by using electron microscopes provides the foundation for developing valid conclusions about functional relationships. Despite advances in other types of light (LM), atomic force microscopy (AFM), and electron microscopy (EM), scanning electron microscopy (SEM) remains distinct in its ability to examine dimensional topography and distribution of exposed features. The ultimate resolution achieved is controlled both by optimizing specimen preparation and instrumental parameters.
Preservation of biological structures in a manner that prevents decay under the high vacuum necessary for a mean free path of travel for the electron beam is a primary concern. Biological specimens are generally composed of non-conductive, thermally sensitive, fragile material which if not stabilized results in specimen damage and imaging artifacts. Specimens can be prepared through chemical and physical (i.e. cryo-preservation) methods or both. Although cryo-preservation may be the preferred method for optimal near native state preservation, it requires expensive instrumentation, advanced skills, and is not necessary to address many scientific questions. In general, preparation of specimens for examination by SEM requires stabilization of structures as described in Basic Protocol 1, then dehydration of specimens as described in Basic Protocol 2, and finally, ensuring adequate conductivity as discussed in Basic Protocol 3, or their respective alternatives.
Specifically, Basic Protocol 1 provides some protocols and tips for chemical preservation of animal tissues and cells, bacteria, viruses, and macromolecular specimens. Basic Protocol 2 provides options for specimen mounts and critical point or chemical drying, and Basic Protocol 3 addresses the rationale for metal coating and alternatives. Additional techniques for immune-labeling strategies with special considerations for correlative techniques are outlined in Basic Protocol 4, and “affordable” specimen fracture is discussed in Basic Protocol 5. Basic Protocol 6 describes stereo pair and anaglyph generation to produce 3-dimensional (3-d) images. The Commentary section discusses basic theory and application for both preparative and imaging techniques of biological specimens for SEM and offers a troubleshooting guide for common problems.
There is no one method or condition that assures successful preparation and imaging for all biological specimens, thus the user should be willing to experiment with preparative and imaging techniques and technologies to achieve the desired results. The content of this Unit is not meant to be exhaustive, but rather offers a starting point for biological specimen preparation and imaging by SEM.
Safety Considerations
Preparation of biological specimens for electron microscopy includes biological, chemical, and mechanical risks to the user. It is imperative to understand the requirements for proper protection to minimize exposure in handling infectious agents, hazardous chemicals, and operation of high voltage instrumentation. Pathogen specific information can be found in CDC guidelines and should be handled according to risk (see Unit 1A.1) Consult your local biosafety officer if needed. Common fixatives and embedding resins are highly toxic, carcinogenic, oxidative, volatile, or radioactive, thus it is imperative to understand the proper handling, use, and disposal according to approved safety and environmental regulations. General requirements include performing protocols in an appropriate fume hood wearing personal protective equipment (PPE) including lab coats, appropriate gloves, and eye protection. Latex gloves are considered inadequate for most chemicals utilized for EM preparative techniques, and nitrile gloves are generally more suitable, although selection should be determined based on specific chemicals used. (See Units 1A, 1A.3 & 1A.4). The associated instruments and technologies also pose potential risks related to high voltage, radiation, pinching hazards, liquid nitrogen use, and high pressure (critical point dryer). Proper operation of instrumentation requires an understanding of the risks and precautions, and heeding advice according to manufacturers' specifications
Basic Protocol 1 Chemical Preparative Techniques for Preservation of Biological Specimens for Examination by SEM
The following sections describe general protocols for preservation of prokaryotic and eukaryotic cells grown as a monolayer or in suspension. Alternate protocols will include preparation for bulk materials, particulate specimens, and suggestions for additional cleaning steps and preservation of friable structures. In general, samples must be processed to dryness. Bulk, granular, and powdered materials may not require processing. Biological specimens will typically be treated with protein and lipid cross-linking reagents, such as glutaraldehyde (GA) and osmium tetroxide (OsO4) respectively, dehydrated with an organic solvent, such as ethanol (ETOH) or acetone and critical point dried through carbon dioxide. Sample containers with appropriate-sized porosity and chemical tolerance should be used for this purpose. Examples include polystyrene 24-cell well tissue culture plates (except with use of acetone or propylene oxide), microfuge tubes, glass vials, stainless steel and polytetrafluoroethylene (PTFE or Teflon™) baskets with matching lids, which are available from various EM supply providers.
Adherent cells can be grown on a variety of substrates including silicon chips, aclar, membrane filters, Thermanox™ or glass coverslips. In recent years, silicon chips have become popular mounting substrates for SEM imaging of widely varied types of samples. They offer convenient dimensions for use with most SEM sample stubs, a virtually featureless surface with minimal background electron emission, and better charge dispersal properties than similar substrates such as glass or plastic polymers. Some cell types show preference for a specific substrate. Experiments requiring use of polarized cells may require cultures to be grown on transwell membrane filters.
Sample preparation for EM inherently introduces structural changes in specimens that can lead to artifacts or loss of structure, which can be reduced with optimized preparative techniques. The following methodologies provide a general protocol suitable for most eukaryotic and bacterial cells and alternate protocols to meet specific circumstances.
Materials
Eukaryotic cells grown in suspension or on solid substrate: Thermanox™, silicon chips, aclar film, or transwell membrane filters, (available from Ted Pella, Electron Microscopy Sciences, Falcon, and other sources)
Aclar typically comes in sheets, which can be cut or punched to desired size.
Primary fixative: typically 2.5 % GA and/or 4% paraformaldehyde (PFA) in 0.1 M sodium cacodylate (CAC) or phosphate (PB) buffer, pH 6.8 – 7.4
Physiologically appropriate buffer: for instance Hank's Buffered Saline Solution (HBSS)
Rinsing buffer: for example, 0.1 M CAC or PB (see recipes)
Buffer selection should include appropriate buffering capacity, pH, salt and ionic strength.
Secondary fixative: typically 1% OsO4 in dH2O or reduced osmium with potassium ferrocyanide (0.5%OsO4/0.8% K4Fe(CN)6) in dH2O or 0.1M CAC.
Distilled water (dH2O)
Dehydrating agent, typically ethanol (ETOH) or acetone
Mounting substrate (i.e. silicon chip, coverslip, or membrane filter)
Fine-tipped forceps
Scissors or punch tool
Container for processing (i.e. 24-cell well plate, microfuge tube, PTFE basket)
Parafilm or tape
Hazardous waste containers
All procedures are carried out at room temperature unless noted otherwise
Fixation of adherent or non-adherent cells
-
1
Remove the number of silicon chips, coverslips or transwell membrane filters required for the experiment. Trim coverslips on two sides so they can be later placed in the container for critical point drying, if applicable, as shown in Figure 1. Any of these substrates can be sterilized by dipping in 70% ETOH and allowed to air-dry if necessary.
Thermanox™ coverslips typically come sterile and cell-culture treated on one side. Although this is not a factor for settling non-adherent cells, it may be important to ascertain the correct side for adherent cell cultures per manufacturer's orientation.
Figure 1.
Thermanox™ or aclar materials can easily be trimmed or punched to desired dimensions using a scissors or punch tool for adaptation to size requirements for subsequent processing steps.
-
2a
Adherent cells: Place one sterile coverslip, silicon chip (shiny side up) (Figure 2A), or membrane filter per well in 24-cell well plate. Label plate cover with sample designation as desired using a water/ethanol proof-marking pen. Plate adherent cells at approximate density of 1– 2 × 10⁵/ml under sterile conditions and conduct experiment.
-
2b
Non-adherent cells: After the experiment wash and gently centrifuge cells (>~500,000) cells per sample at (1000 – 2000) × g for (5 – 10) minutes in microfuge tube with an appropriate physiological buffer (i.e. PBS or HBSS). Remove supernatant and gently re-suspend in 50 μl of buffer.* Pipet suspension (Figure 2B) and allow to settle for 20 – 30 minutes and then proceed to step 4 as for adherent cells.
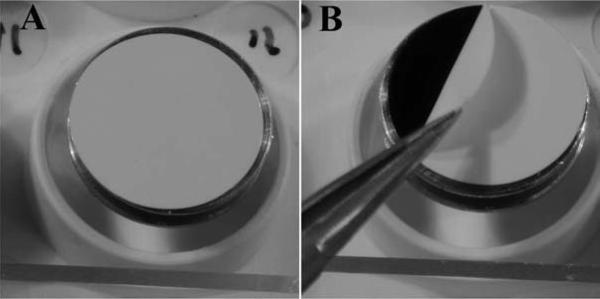
Figure 2.
(A) Removal of pre-scored silicon wafer followed by application of specimen in suspension (B) and, (C) proper dispersal of fluids.
Some specimens do not adhere well to plastic or glass substrates. Support Protocols 1 & 2 provides additional methods for improved adherence strategies.
*Often when the supernatant is removed, the pellet remains in a small volume of liquid adequate for resuspension by simply flicking the tube with fingertip before adding the buffer.
Silicon chips typically come pre-scored and attached to adhesive backing (Figure 2A). Simply peel chip off with tweezers and place in a 24-cell well plate for convenient processing (Figure 2B). Liquid should be gently dispersed against the side of the well to avoid direct pressure on the specimen (Figure 2C).
-
3
To fix, remove most of the media liquid but not all to avoid drying of sample, which adversely affects ultrastructure. Briefly wash with buffer such as PBS or HBSS.
-
4
In a fume hood, quickly but gently add ~0.5 ml primary fixative, typically 2.5% GA in 0.1M CAC or PB, by dispersing a slow stream of the liquid as shown in Figure 2C. Be careful to keep the coverslip or chip from floating, making sure the specimen remains completely immersed.
When using transwell membrane filters, fill both the bottom of the well and the insert with same solutions.
-
5
Fix the specimen at room temperature for 30 – 60 minutes in GA (fixing at 4 degrees C may improve preservation of some specimens).
The sample can be stored overnight at 4 degrees C if necessary, although if removing from the hood, seal container with parafilm or tape to avoid exposure to user by hazardous fumes.
If a laboratory microwave is available, Support Protocol 3 provides an alternative schedule.
-
6
Wash 3 × 2 minutes with rinsing buffer, being careful to avoid drying of the specimen.
7. Post-fix with 1% OsO4 in dH2O or 0.5%OsO4/0.8% K4Fe(CN)6 in 0.1 M CAC buffer for 30 – 60 minutes.
Transwell membrane filters should be placed in a new well half-filled with dH2O for final washes and then ETOH for dehydration to avoid contamination by insufficient osmium removal.
-
8
Rinse 1 × 2 minutes with rinsing buffer, and then 2 × 2 minutes with dH2O.
-
9Dehydrate with a graded ethanol series by subsequent exchanges of the following dilutions in distilled water as follows:
- 25% ETOH, 1 × 5 minutes for delicate specimens
- 50% ETOH, 1 × 5 minutes
- 75% ETOH, 1 × 5 minutes (specimen can be stored overnight at 4C at this step)
- 95% ETOH, 1 × 5 minutes
- 100% anhydrous ETOH* 3 × 10 minutes (less time may be required for monolayers).
*Caution: ETOH and acetone are hygroscopic, and freshly opened solvent or stock stored in a desiccator should be used for final 100% exchanges to avoid “wet” ETOH which can induce drying artifacts.
-
10
Proceed to Basic Protocol 2 for drying options of specimen and then Basic Protocol 3 for coating options.
Alternate Protocol 1: Practical Considerations for the Preparation of Soft Tissues
Morphological changes occur immediately upon sacrifice or excision of tissue from an animal. Tissues should quickly be immersed in fixative, and cut into pieces small enough for adequate penetration by fixatives. Typically, specimens should be no wider than 1 mm in at least one dimension, although this can vary depending on the density or porosity of a particular tissue. Tissue pieces in general require extended time for each of the steps in Basic Protocol 1& 2. The combination of 4% PFA and 2.5 % GA to the primary fixative and additional impregnation with heavy metals can help stabilize and improve bulk conductivity of the specimen.
Additional Materials
8% Potassium ferrocyanide [K4Fe(CN)6 in 0.1 M CAC (optional)]
1% Tannic acid (TA) in dH2O (optional)
1–2 % Uranyl acetate (UA) in dH2O
UA solution should be filtered, and stored in the dark at 4 degrees C up to 12 months
Dissecting tools, e.g. scalpel, micro-scissors, or razor blade
Dish for dissection
-
1
Place excised tissues in an appropriate container such as a microfuge tube, glass vial, or plate filled with primary fixative (i.e. 4% PFA/2.5% GA in 0.1M CAC or PB buffer) for a minimum of 1 – 2 hr.
If tissues exceed 1 mm3, the pieces should be transferred to a puddle or dish filled with fixative, and while submerged, cut to 1 mm in at least one dimension for better penetration of fixatives. This should be done in a fume hood! Most tissue pieces can be stored at 4 degrees C for up to one week without noticeable effects.
Caution: Use of PB for tissue preparations can cause dense insoluble precipitate formation in the presence of calcium. This is more evident by examination in a transmission electron microscope (TEM) but can result in contaminants visible by SEM.
-
2
Wash small tissue pieces 3 × 5 minutes with rinsing buffer.
-
3
Post-fix the tissue with reduced OsO4 (i.e. 0.5%–1% OsO4/0.8% K4Fe(CN)6 in 0.1 M CAC, pH 6.8 – 7.4) for 1 hr.
-
4
Wash specimen 3 × 5 minutes with rinsing buffer (i.e. 0.1 M CAC or PB, pH 6.8 – 7.4).
Large or dense tissues may require extended wash times to avoid precipitate formation.
-
5
Stain with 1% TA in dH2O for 1 hr.
-
6
Wash 1 × 5 minutes with rinsing buffer and then 2 × 5 minutes with dH2O.
-
7
Stain with 1% UA in dH2O 1 hr at room temperature or overnight at 4 degrees C.
-
8
Wash 3 × 5 minutes with dH20.
-
9
Dehydrate as in above protocol with a graded ETOH or acetone series.
-
10
Proceed to Basic Protocol 2 & 3 for drying, coating, and mounting specimens for SEM analysis.
*Most specimens can be stored for several days in 75% ethanol at 4 degrees C without noticeable effects. Make sure that the container is tightly sealed and specimen completely immersed to avoid drying.
Alternate Protocol 2: Removal of Debris from the Exoskeleton of Invertebrates
The terrestrial lifestyle of insects and arachnids (such as ticks and mites) often results in debris covering most of the exoskeleton, often obscuring structural details. Washing with buffers proves insufficient for adequate removal of contaminants, whereas treatment with solvents and sonication has been shown effective for use on hard ticks in a method described by Dixon, et al. (2000). Alternatively, if solvent treatment damages a particular specimen, Corwin's technique offers an alternative that includes application of an adhesive and careful mechanical removal of the debris [Corwin, 1979]. Although the results of this technique are excellent, it can be technically challenging.
The following procedure demonstrates the removal of debris from the surface of a soft tick using the Dixon method.
Additional Materials
Tick or mite
Xylene
Acetone
Fine point forceps or tweezers
Sealable glass vials
Sonicator
-
1
Place tick in glass vial, microfuge tube, or appropriate container filled with 70% ETOH for ~1 hr.
-
2
Manually remove any tissue still attached to tick mouth area with fine-forceps.
-
3
Place ticks in individual, sealable glass vials.
-
4
Dehydrate with 100% ETOH 2 × 1 hr.
-
5
Replace ETOH with dry acetone, and leave overnight at room temperature or at 4C, ensuring the glass vial is well sealed.
It may be helpful to wrap parafilm around the lid to prevent evaporation of the solvent.
-
6
Replace acetone with xylene and sonicate for 15 –30 minutes.
-
7
Wash with acetone 2 × 1 hr.
-
8
Proceed to critical point drying, mounting, and coating options in Basic Protocols 2 and 3.
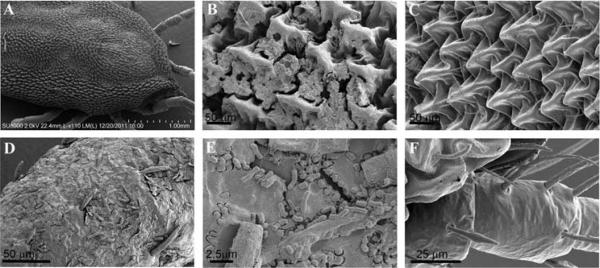
Figure 3A shows a relatively low magnification image of an un-cleaned tick where debris is unapparent. At higher magnifications however, the debris obscures structural detailsc (Figure 3B, D, & E) that are largely removed after additional cleaning steps as shown in Figure 3 C & F.
Figure 3.
Low magnification SEM image of <i>Ornithodoros hermsi</i> tick (A), and higher magnification images of un-cleaned (B, D, & E) compared with cleaned tick exoskeleton (C & F). Scale bars as indicated.
Alternate Protocol 3: Fixation of Colonies Grown on Agar Plates
Many free-living and pathogenic bacteria are known to produce extracellular bio-products that aggregate and form components such as s-layers and biofilm matrices. As with the bacteria themselves, such components exhibit considerable biochemical diversity. Often such layers and matrices are poorly cross-linked when preserved with standard aldehyde primary fixatives and are lost during further processing. If the biochemical nature of the extracellular material is known, fixatives can be chosen to optimize preservation. If unknown, it may be necessary to determine the best fixative empirically by testing multiple crosslinking reagents. Minimizing immersion and agitation of samples in fluids during processing is also helpful. The following protocol is intended for bacterial colonies on excised pieces of agar-based solid medium. The protocol involves pre-fixing the samples with osmium tetroxide vapors and allowing fixatives to diffuse through the substrate to reach the colonies. The methods described can be modified as necessary for bacteria on other types of substrata.
Additional Materials
Colonies grown on agar plates
2–4% N,N'-dicyclohexylcarbodiimide (DCCD) in either 0.1 M phosphate or sodium cacodylate buffer
Glass or plastic petri dish
Scalpel or razor blade
-
1
Excise blocks of agar with colonies of interest with scalpel, razor blade, or other dissecting tool; pieces of approximately 5 mm across or in diameter and 2–3 mm thick work well.
The dimensions of sample holders for steps such as critical point drying, coating, and imaging should be considered when excising agar blocks. Be careful not to contact or otherwise disturb the colonies on the agar surface.
-
2
Place blocks, colony side upward, into a glass or plastic petri dish. Sample identification designations can be written on the outside of the dish prior to use.
Leave space for a small volume of OsO4 solution.
-
3
Pipet 0.5 ml of 1% OsO4 in dH2O into the petri dish avoiding contact with the sample blocks. Replace the cover on the petri dish, seal the dish with parafilm, and let stand for 1 hr.
Alternatively, the mixture can be placed in an open container within the petri dish. However it is beneficial to maximize the exposed surface area of the solution.
-
4
Remove blocks from the petri dish and place in wells of a 24-well tissue culture plate or other convenient vessel. To each sample well, add a volume of primary fixative sufficient to wet the agar block without allowing the fluid or meniscus to reach the colonies. This will be approximately 0.5 ml depending on the thickness of the agar block. Cover and let stand for 1–2 hr.
* Common primary fixatives include 2.5–4% GA in either 0.1 M PB buffer, or 0.1 M CAC buffer, at pH 7.2, 2–4% (DCCD) in either PB or CAC buffer, or buffered mixtures of GA and PFA such as Karnovsky's fixative. (DCCD offers an alternative to GA as a primary fixative, to cross-link carboxyl groups. Adding either alcian blue or ruthenium red to the primary fixative can also enhance preservation of some extracellular complexes, particularly those rich in carbohydrates as described in the next section.
-
5
Aspirate the fixative and replace with an equal volume of rinsing buffer. Let stand for 30 minutes. Repeat the step for a second wash to remove primary fixative.
-
6
Post-fix for 1–2 hr as above using 1% OsO4 in 0.1 M PB, or other appropriate buffers such as 0.1 M CAC.
-
7
Wash the samples twice as in step 5 with dH2O.
-
8
Dehydrate samples using graded ETOH series.
Allow 1–2 hr per step for thorough diffusion through the agar blocks and colonies.
-
9
See Basic Protocol 2 for critical point drying steps.
Allow for thorough replacement of solvent with liquid carbon dioxide to avoid collapse of the agar block.
-
10
Carefully remove agar blocks from the critical point dryer sample container. The samples will be fragile, with very brittle colonies.
-
11
Proceed to Basic Protocol 3.
Alternate Protocol 4: Stabilization of Polysaccharide Structures with Alcian Blue and Lysine
Polysaccharides, often a constituent of extracellular matrices, are often lost during conventional EM processing. Fassel, et al showed improved retention of these structures through addition of alcian blue and lysine to the primary fixative [Fassel, et al. (1997)]. Addition of ruthenium red to the primary fixative has also been shown to improve retention of these friable structures [Luft, 1971]. Below is an example of bacterial colonies grown on agar plates and fixed with alcian blue/lysine additives for retention of glycoprotein rich components on the biofilm produced by Yersinia pestis.
Additional Materials
Colonies grown on agar plates or in suspension
Alcian blue/lysine fixative, (see recipes)
-
1
Gently press coverslip or silicon chip on bacterial colonies on agar plate or settle suspension as described in Basic Protocol 1 for non-adherent cells and place the coverslip/chip in a 24-cell well plate or other suitable container.
-
2
After brief rinse with physiologically appropriate buffer, fix with alcian blue/lysine mixture, typically 75 mM lysine in 0.075% (w/v) alcian blue, 2% PFA, 2.5% GA in 0.1 M CAC, buffered at pH 7.2, for 2 hours.
The GA should only be added immediately before use as it begins to instantly react with the lysine. This will be evident as the color of the fixative immediately begins to turn yellow.
-
3
Rinse 3 × 5 minutes with 0.1 M CAC, pH 7.2.
-
4
Postfix with 1% OsO4/0.8% K4Fe(CN)6 in 0.1M CAC, pH 7.2 for 1 hr.
-
5
Rinse 1 × 5 minutes with 0.1M CAC, pH 7.2, and 2 × 5 minutes with dH2O.
-
6
Dehydrate with graded ethanol series, starting with 25, 50, 75, and 95% ETOH and three exchanges of anhydrous 100% ETOH prior to critical point drying and sputter coating procedures outlined in Basic Protocols 2 and 3.
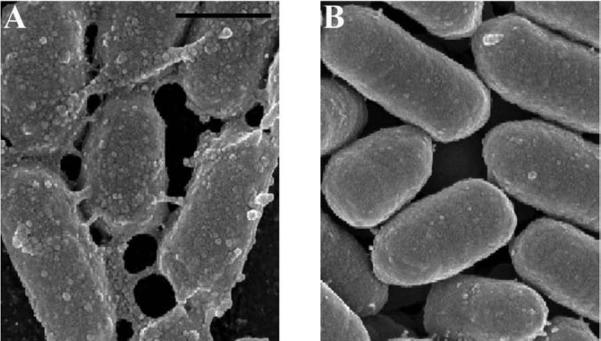
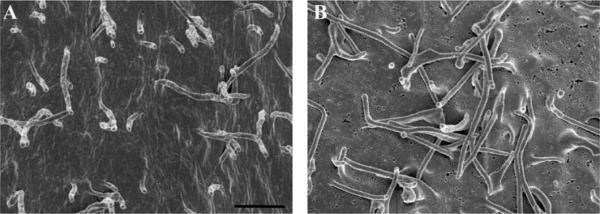
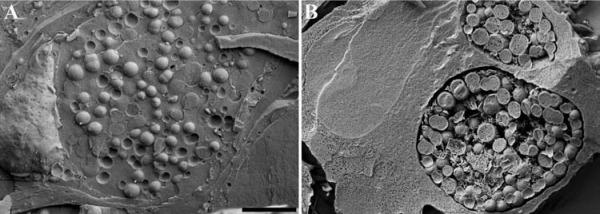
Figure 4 shows wild type Yersinia pestis (A) compared with a mutant (B) lacking the gene Hms to express products involved with biofilm formation. Using GA alone as a primary fixative, the wild type strain was morphologically indistinguishable from the mutant as the biofilm was virtually undetectable (data not shown). When both were treated with the alcian blue/lysine mixture, the difference was apparent.
Figure 4.
SEM of Hms+ and Hms− <i>Yersinia pestis</i> grown as bacterial lawns on agar plates. The Hms+ colonies showed retention of an extracellular substance (A), while the mutant treated with the same alcian blue-lysine fixative mixture did not (B). Scale bars = 0.5 μm.
Alternate Protocol 5: Preparation of Non-adherent Particulates in Solution for SEM
In many cases particulate or powdery substances can simply be air-dried on a silicon chip or coverslip before sputter coating (Basic Protocol 3).
Additional Materials
Particulates/macromolecules in water or volatile salt solution at desired concentration
-
1
Apply 50 μl droplets to appropriate mounting substrate and allow to air dry completely.
The desired concentration may need to be experimentally determined. It also may be worth conducting preliminary experiments comparing the results of Basic Protocol 1 with simply air-drying specimens to see or compare shrinkage artifacts.
Alternate techniques of freeze-drying by plunge freezing and drying under vacuum has been performed by others, and in some instances may provide a useful alternative. [Boyde & Franc (1981), and, Boyde & Maconnachie(1979)].
Support Protocol 1: Application of Thin Layer of Adhesive on Substrate to Improve Adherence
As with glass and plastic, not all samples adhere readily to the surface of silicon chips. Below are relatively easy methods for improving adherence to such surfaces by pre-coating the surfaces with a very thin adhesive layer.
Additional Materials
Carbon conductive mounting tabs
Acetone
Microfuge tubes, acetone resistant such as polypropylene (PP) or high density polyethylene (HDPE)
Petri dish lid
-
1
Immerse four conductive carbon mounting tabs, into 1 ml of acetone in a solvent-resistant tube. Agitate for 1–2 minutes. Remove the carbon tabs with tweezers.
-
2
Place the desired number of silicon chips into the acetone/adhesive mixture. Up to 10 or so chips can be added to a microfuge tube. Allow 1–2 minutes for coating, inverting the tube periodically.
Larger numbers can be handled by scaling up.
-
3
Remove each chip individually with tweezers and place on a clean surface, desired side up. The chip will dry quickly and will be slightly tacky.
Cover with a petri dish lid or similar cover to prevent dust accumulation on the chip.
-
4
Sprinkle particulate samples onto chips to the desired spatial density or apply and fix as described in Basic Protocol 1 for non-adherent specimens.
-
5
Proceed to Basic Protocols 2 and 3 for proper drying and coating techniques.
Other desired substrates such as glass cover slips, planchettes, etc., can be coated with adhesive as above. Other adhesive solvents may also be used. If other substrates or solvents are used, it is recommended that they be tested for compatibility with the adhesive and each other before using. Take appropriate precautions to prevent contact with or inhalation of toxic vapors and dust from samples, reagents, and solvents.
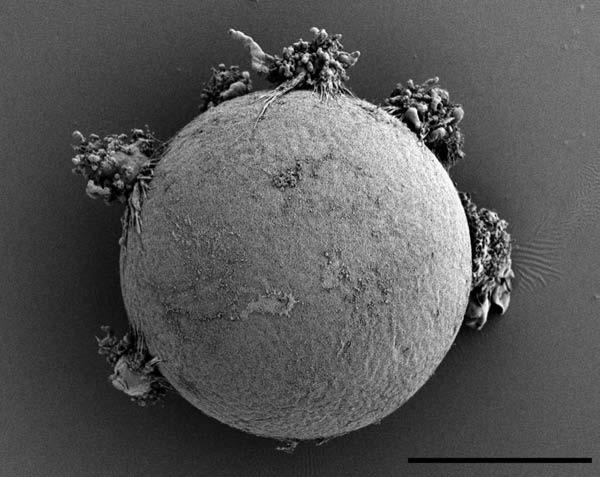
Figure 5 provides an example of the process used to coat silicon chips for improved adherence of agarose beads on which dendrocytes are attached. Without pre-treatment, few or no beads remained attached to the chip.
Figure 5.
Agarose bead with dendrocytes adhered to silicon chip pre-coated with thin layer adhesive. Scale bar = 25 μm.
Support Protocol 2: Poly-L-lysine Coating Specimen Substrates for Improved Adherence
For similar results, coverslips or silicon chips can be pre-coated with a protein or lectin layer to which cells can attach and be stabilized by protein-protein interactions during fixation. Although this works quite well for many non-adherent cell types, the layer itself can be quite visible in the electron microscope, and for small particles in particular, may interfere with visualization of the particle of interest.
Additional materials
0.1 % poly-L-lysine in solution
Coverslip holder for drying
Dip coverslip or chip into a small glass beaker filled with 0.1% poly-L-lysine.
Air dry completely by suspending in a coverslip rack or placement on clean surface.
Proceed to Basic Protocol 1, step 2a for attachment of non-adherent specimens.
Support Protocol 3: Microwave Processing of Biological Specimens for Examination by Conventional SEM
Microwave–assisted fixation for EM application has become increasingly popular over the last decade with advancements technology and refinement of technique. Advantages include reduction in sample preparation time, and for some specimens, improved structural integrity. The following protocol was adapted from techniques developed by others. [Giberson and Demaree, (2001)] [Sanders, see website]. This protocol can be used for TEM or SEM specimen preparation, and reagents can be modified according to preferred protocol, including immunology.
Additional Materials
Laboratory wattage-controllable microwave oven (MW), vented into a fume hood
Load cooler (water chiller, usually provided with MW)
Specimens on SEM appropriate substrate (i.e. silicon chips, coverslips, etc.) in fixative*
Suitable container, (ex. 24 cell well tissue culture plate)
*Specimens are pre-fixed conventionally with aldehydes in our lab because of biosafety concerns. If there are no biosafety issues, the specimen can be processed using the parameters of the other post-fixation steps.
Note: Do not fill liquid solutions over 1 cm in height to prevent inadequate MW penetration [Sanders].
Rinse specimen with appropriate buffer 2 × 45 sec in MW at 250 Watts/24 degrees C, without vacuum.
Post-fix with 0.5% OsO4/ 0.8% K4Fe(CN)6 in buffer 2 × [2 min on-2 min off-2 min on] cycle at 80 Watts/24 degrees C, under vacuum (at 20 in. Hg).
Rinse specimen with appropriate buffer 2 × 45 sec in MW at 250 Watts/24 degrees C, without vacuum.
Stain with 1% TA in dH2O, 2 × [2 min on-2 min off-2 min on] cycle at 80 Watts/24 degrees C, under vacuum (at 20 in. Hg).
Rinse with dH2O, 2 × 45 sec in MW at 80 Watts/24 degrees C, without vacuum.
Stain with 1% UA in dH2O, 2 × [2 min on-2 min off-2 min on] cycle at 80 Watts/24 degrees C, under vacuum (at 20 in. Hg).
Rinse with dH2O, 2 × 45 sec in MW at 80 Watts/24 degrees C, without vacuum.
Dehydrate with graded ETOH or acetone series as described in Basic Protocol 1, using 50%, 75%, 95% ETOH, and 3 × 100% anhydrous ETOH exchanges for 45 sec each in the MW at 250 Watts/24 degrees C, without vacuum.
Proceed to critical point drying (Basic Protocol 2) and then coating (Basic Protocol 3).
Basic Protocol 2: Critical Point Drying Specimens
Biological specimens are composed largely of water. Although environmental SEMs and microscopes equipped with cryo-stages do not require water removal from specimens, the conventional SEM still does.
If allowed to simply air dry, most biological structures would shrink, collapse and break due to the surface tension of the water leaving the specimen. Solvent dehydration followed by critical point drying (CPD) is the most common method for removing water from biological specimens for SEM processing although chemical alternatives can also be used. As the name implies, the specimen is heated to the critical point of the transition agent where at specific temperatures and pressures the gas and liquid phases are indistinguishable. At this phase, the agent can be slowly released as a gas, and the artifacts associated with shrinkage minimized. The critical point for water and ETOH are high (approximately 374 degrees C at 217 atmospheres and 241 degrees C at 60 atmospheres respectively), but other agents such as carbon dioxide (CO2) are in a range tolerable for most specimens (31.1 degrees C at 73 atmospheres). The following section provides a brief overview of critical point drying. Alternate Protocol 6 describes a chemical alternative.
Additional Materials
CO2 siphon tank *
Critical point dryer (CPD)
Specimen container
Polyethylene specimen cup (PE)
*Siphon tanks draw liquid from the bottom of a cylinder, making delivery of the liquid CO2 to the CPD more efficient.
-
1
Place critical point dryer specimen holder in a solvent resistant container such as a PE specimen cup and fill with 100% dry ETOH to top of holder.
-
2
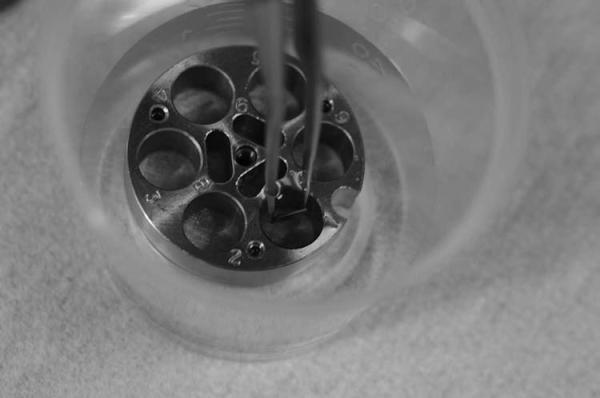
With a fine-tipped forceps, quickly remove and place chip or pre-trimmed coverslip in the slot of the CPD holder, being careful to avoid damaging and drying specimen as shown in figure 6.
-
3
Transwell membrane filter inserts can be removed by immersing the filter end in a dish containing 100% ETOH (to avoid drying) and carefully cutting around the rim of the filter with a scalpel as shown in Figure 7 A–C. The filter can then be picked up with fine tipped forceps and placed in the CPD container as described above.
-
4
Insert specimen holder into the chamber of the CPD instrument, filled per manufacturers' recommendations with 100% ETOH. The chamber should be cooled to approximately 10 degrees C or lower per manufacturer's specification.
Figure 6.
Placement of a chip in specimen vessel used in a Bal-Tec CPD.
Figure 7.
Membrane filter insert removed from 24 cell tissue culture plate (A) is quickly transferred and immersed for trimming in (B) and the membrane is removed with a fine-tipped tweezers (C) for placement in CPD container.
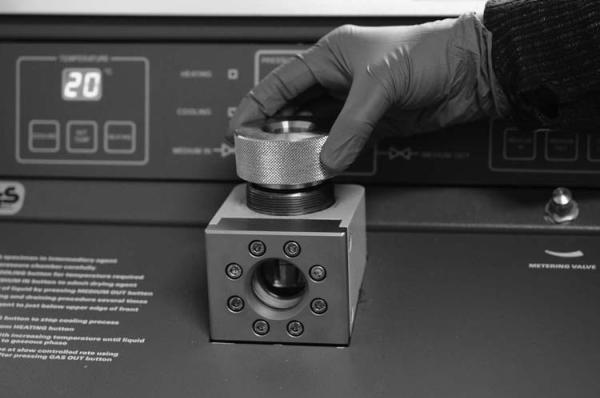
Caution: Inspect O-ring for damage or debris and clean or replace if necessary. Make sure the cover is properly placed and threaded as shown in Figure 8.
Figure 8.
Carefully place the lid on the specimen chamber and make sure it is properly threaded and closed tightly as this chamber reaches high pressure.
-
5
When chamber has reached 10 degrees C, the transition agent (i.e. CO2 from a siphon tank) can be administered as indicated by the manufacturer. The objective is to replace all of the ETOH with liquid CO2 prior to heating to the critical point under pressure.
This step requires patience. Incomplete exchange of the transition agent or use of “wet” ETOH can result in dehydration artifacts. Slurry lines (Schlieren lines) will be visible when mixing the transition agent with liquid CO2, and will no longer be apparent after complete replacement. As the ETOH is fully evacuated, CO2, which is less dense, will be released and form small dry ice pellets, causing startlingly loud popping noises. A few additional exchanges should be performed at this point. Larger specimens, i.e. tissues, may require additional and extended exchanges. It can be helpful for these specimens, to let the CO2 permeate for an additional 15 minutes prior to final exchange and heating.
Alternate Protocol 6: Chemical Alternative to Critical Point Drying
Critical point drying (CPD) is the most common and universal method for full dehydration of biological specimens, although it may be practical in some instances to use a chemical alternative. Obviously if a CPD is unavailable, it offers a less expensive alternative. In other cases, specimens may not fit into the dryer, or may be unable to tolerate the turbulence generated in the CPD. Other groups have examined chemical drying techniques for a variety of cell types including, insect cell lines, plant material, bulk tissues, or bacterial and mammalian cell lines. The advantages of using a chemical dehydrant like Hexamethyldisilazane (HMDS) include ease of use, relative quickness, and less expense than a CPD. For many specimens the results can be equivalent [Nation (1983), Braet et al.(1997), Lee and Chow (2011)]. The manner in which HMDS dehydrates without compromising the underlying structure is poorly understood. It is speculated that HMDS must crosslink proteins thereby strengthening the biological sample, enabling them to resist collapsing as HMDS evaporates out of the specimen [Nation (1983)]. The following compared the ultrastructure of HeLa cells after preparation with either a CPD or HMDS.
Additional Materials
Laboratory Microwave Oven with controllable wattage (optional)
Hexamethyldisilazane (HMDS)
Caution: HMDS is a highly volatile and flammable liquid. It is corrosive to skin, mucous membranes and eyes and should be used only in a chemical fume hood in well-ventilated areas with proper PPE and waste handling.
-
1
Fix specimen adhered to silicon chip or coverslips with 2.5% GA in 0.1M CAC buffer for 30 – 60 minutes.
-
2
Wash cells 3 × 5 minutes with 0.1 M CAC buffer.
-
3
Post fix cells with 1% OsO4/0.8% K4Fe(CN)6 in 0.1M CAC, pH 7.4 for 30 – 60 minutes or alternatively in a laboratory microwave oven (see Support Protocol 3).
-
4
Wash 1 × 2 minutes with 0.1 M CAC buffer and 2 × 2 minutes with dH2O.
-
5
Dehydrate in 95% ETOH for 1 × 1 minute followed by 3 × 5 minutes in 100% ETOH.
A graded ethanol series may yield better results. -
6
Dehydrate 1:1 (HMDS:ETOH) for 5–15 minutes.
Longer incubation times may be required for tissues or thick specimens. -
7
Dehydrate 2 × (5 –15 minutes) with 100% HMDS at room temperature OR in a laboratory power-controllable microwave oven at 250 Watts/24 degrees C, for 2 × 5 minutes, no vacuum.
-
8
Wick away excess liquid with filter paper and allow a minimum of 4 hr for drying before next step.
-
9
Proceed to sputter coating in Basic Protocol 3.
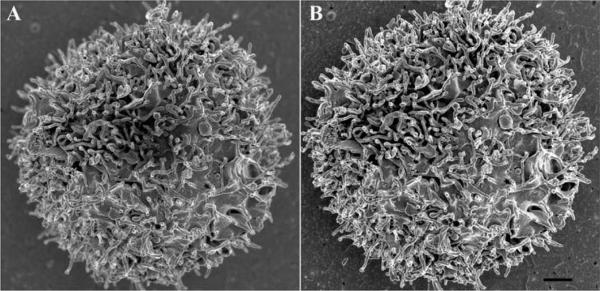
At low magnifications, both methods of sample preparation seem to yield similar results. However, when compared at higher magnifications, CPD processed samples (Figure 9 A), show fewer holes than the HMDS treated samples, an artifact most likely caused by damage during dehydration (Figure 9B).
Figure 9.
HeLa cells grown on silicon chips were dehydrated using either a CPD (A) or HMDS (B). Specimens were coated with 80 Angstroms of Ir. Scale bar = 1 μm.
Basic Protocol 3: Sputter Coating
When bombarded with electrons, biological specimens ineffectually dissipate the resulting charge, which can cause imaging artifacts. After fixing and drying specimens as described in Basic Protocols 1 & 2, coating specimens with a thin layer of a conductive metal minimizes damage to specimens and improves topographical contrast for improved imaging by SEM using secondary electron detection. In general there are two grades of sputter coating units available: low vacuum systems, which are adequate for low magnification/low resolution work, and high vacuum systems, which are necessary for high resolution imaging. Choice of metal should be carefully considered depending on the application. Gold, gold/palladium or platinum alloys, or platinum (Au, Au/Pd, Au/Pt, and Pt respectively) are common choices for low resolution imaging. Iridium (Ir), tungsten (W), or carbon (C), provides better coating for high-resolution imaging. When visualizing gold or other electron dense moieties, low-atomic number elements such as chromium (Cr) are required to allow distinct backscattered electron (BSE) detection. In all cases, application of a minimal layer is important to avoid obscuring structural details. Although many of the concepts are universal for all coating methods, the protocol described below is specifically outlined for an ion-beam sputtering device. Other types of sputter coaters are discussed in the commentary section.
Additional Materials
Microscope specific stage mount, i.e. aluminum stubs
Fine-tip tweezers
SEM stub tweezers
Conductive double-sided adhesive tape and/or conductive paint
Sputter coater
Metal target, i.e. Ir, Au/Pd, Cr, Pt, C
SEM specimen storage box
-
1
Place microscope-specific aluminum stub in storage container.
-
2
Apply double-sided conductive tape to stub, and remove protective layer as shown in Figure 10.
Conductive paint, i.e. silver or carbon can be applied, and specimen mounted before the paint dries. -
3
Place appropriately fixed and dried specimen (see Basic Protocols 1 & 2) where desired on stub.
Figure 10.
Double-sided adhesive tab place on aluminum SEM stub (A) and removal of protective layer with fine-tipped forceps (B).
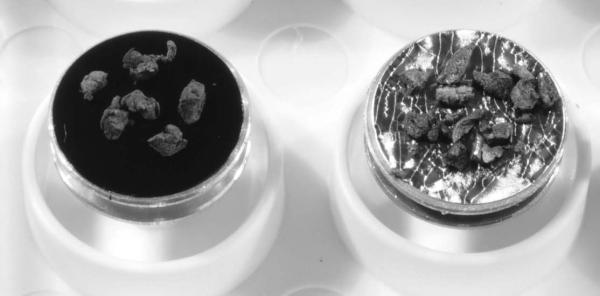
After drying in a CPD, filters will naturally roll with cell side internalized. To mount the specimen, simply lay the “roll” down and using a fine-forceps being careful to avoid damaging cells, unroll, pressing gently on the tape as shown in Figure 11 A–C. DO NOT USE silver paint for primary attachment of filters as it will be absorbed through membrane and ruin the specimen, although it can be applied sparingly around the filter!
Figure 11.
Transwell membrane filters curl up into a scroll after drying in a CPD (A). After placing on the adhesive, it can simply be rolled across the tape (cell layer rolls inward) (B) and gently apply pressure for improved contact. Silver paint can be CAREFULLY applied to increase contact of membrane to adhesive (C).
-
4
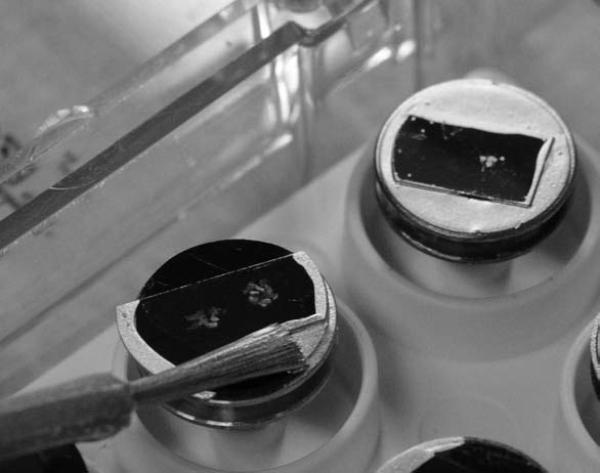
After placement of specimen, contact between the specimen substrate and stage mount can be improved by applying a thin layer of conductive paint around the specimen as shown in Figure 12. Allow sufficient drying time prior to placement under vacuum conditions in the sputter coater (i.e. 4h or overnight in a desiccator).
Figure 12.
Conductive paint is carefully applied with a brush to form complete contact with the underlying surface. If the substrate hangs slightly over the stub, extra paint can be applied on the bottom side of the coverslip.
Be sure to minimize the amount of paint on the applicator (i.e. brush) before application to avoid paint spreading too far across the specimen. Tissues are especially vulnerable as they may be particularly porous; it may be prudent to apply small dabs of paint around the base of the tissue before or after sputter coating (Basic Protocol 3) for improved contact (Figure 13).
In some instances, it may be easier to apply dabs of paint using a toothpick to tissue pieces.
Figure 13.
Silver paint was carefully applied after sputter-coating tissues mounted on prepared SEM stubs to improve contact between tissue and conductive surface.
-
5Place dried mount in sputter coater and proceed as advised by manufacturer. Basic steps include:
- Achieving sufficient vacuum
- Out-gas argon or gas line before applying voltage
- Make sure correct target is in place
- Set tilt and rotation conditions (i.e. usually +/− 90 degrees and 360 degree rotation according to desired result
- Apply voltage
- Open gas valves to specified emission
- Coat to desired thickness or time and turn off power supply
- Release vacuum
- Remove sample, place stub in SEM storage box, and preferably store in desiccator until ready for examination
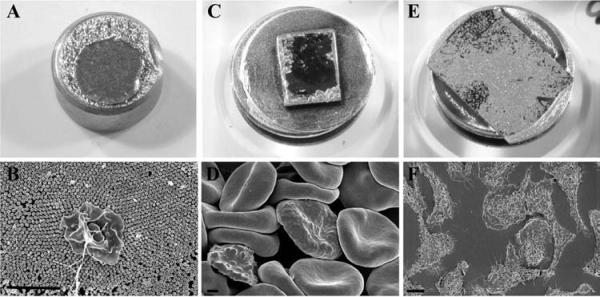
Figure 14 shows the appearance of specimens after coating on membrane filters (A, B), non-adherent cells on untreated silicon chips (C, D), and adherent cells on an aclar coverslip (E, F).
Specimens with rough or highly irregular surfaces may require thicker application of metals, or an increase in overall bulk conductivity or both, as described in the next section.
Figure 14.
Specimen appearance after coating with 75 angstroms of Ir by visual or SEM examination of Salmonella infected polarized HeLa cells grown on transwell membrane filters (A, B), non-adherent red blood cells infected with malarial parasites settled on a silicon chip (C, D) or macrophages grown on an aclar coverslip (E, F) prior to mounting on double-sided carbon tape, and stabilized further with Leitsilber silver paint. Scale bars (B & D) = 1 μm and E = 10 μm.
Alternate Protocol 7: Improved Bulk Conductivity through “OTOTO”
Biological specimens are notoriously non-conductive and require special preparations either through coating with a thin layer of metal and/or increasing the bulk conductivity of a specimen by impregnation with heavy metals to prevent or reduce damage and imaging artifacts for examination in an SEM. In some instances, it may be beneficial to minimize or obviate the need for sputter coating for better visualization of minute topographical details or improved visualization of gold particles used for immune labeling. Successive incubations alternating OsO4 - TA – OsO4 – TA - OsO4 can introduce enough conductivity into many specimens for direct examination in the SEM without further coating requirements. Saturated thiocarbohydrazide (TCH) can be substituted for TA. In this process, coined OTOTO, TA and TCH act as mordents for better adhesion of OsO4, laminating layers of metal on membranes in particular.
Wash and fix specimens on suitable mounting substrate as outlined in Basic Protocol 1, steps 1 – 7.
Rinse 3 × 2 minutes with appropriate rinsing buffer as described in Basic Protocol 1.
Stain 30 – 60 minutes with 1 % TA or saturated TCH in dH2O.
Rinse 3 × 2 minutes with rinsing buffer.
Repeat steps 2 and 3 until the following pattern has been achieved: OsO4 - TA – OsO4 – TA - OsO4.
Proceed to washing and dehydration as described in steps 8 – 9 of Basic Protocol 1, and proper drying as described in Basic Protocol 2.
-
Mount dried specimen on aluminum stub with conductive paint and allow thorough drying (i.e. overnight) prior to examination in the SEM as discussed in Basic Protocol 3. Specimens should be stored in a desiccator if possible.
These techniques will NOT make the mounting substrate conductive, and it may be helpful to apply a conductive coating to the mounting substrate prior to addition of specimen.
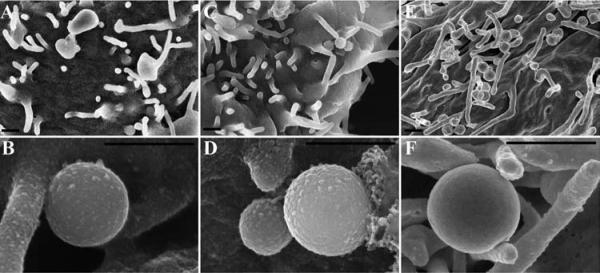
Figure 15 demonstrates the difference in visualization of surface topography of specimens prepared by OTOTO with no (Figure 15 A & B) or little (20 angstroms of Cr) (Figure 15 C & D) additional coating compared with the conventional fixation including one exposure to OsO4 and coating with 75 angstroms of Ir (Figure 15 E & F). Note the difference especially in the appearance of projections on the surface of the bacteria and host cell between the three different preparations, in particular how smooth the surface features appear in Figure 15 E & F. It should be noted that although the features in Figure 15 A – D may appear more representative of the native state, the imaging itself can be more challenging, often requiring lower voltage, mixed backscatter and secondary electron modes, and can still remain vulnerable to charging. It should also be pointed out that addition of successive rounds of more chemicals in itself lengthens processing time, and can induce structural changes. Again, the scientific question being asked will in part determine which protocol is optimal for a given specimen.
Figure 15.
Chlamydia infected HeLa cells were prepared by OTOTO and left uncoated for examination (A, B), minimally coated with 20 angstroms of Cr, (C, D) or conventionally processed and coated with 75 angstroms of Ir (E, F). Scale bars = 0.5 μm.
Basic Protocol 4: Immune Labeling Strategies
The ability to perform immunology and label specific antigens with an electron-dense probe provides a powerful tool for identification and site-specific localization for proteins of interest. Although it is beyond the scope of this unit to fully review immunological theory, there are some important considerations when labeling for visualization by SEM. Labeling for electron microscopy can be challenging in that preservation of structure and retention of antigen are often mutually exclusive. Labeling for SEM is generally performed on surface exposed antigens with the advantage immunology is performed prior to fixation with GA and OsO4. In this instance, the labeling can be done before fixation protocols for optimal structural preservation. For viewing internally labeled structures, it is possible to perform labeling after a mild fixation followed by cell fracture as discussed in Alternate Protocol 8 below.
Additional information found in trouble shooting guide and discussion section including proper controls, signal to noise, selection of gold probe size.
Additional Materials
Blocking buffer, i.e. serum free Bovine Serum Albumin (BSA) in 0.1 M Tris, PB, or PBS buffer (see recipes).
Primary antibodies
Secondary antibodies conjugated to electron dense probe, i.e. colloidal gold
Grow cells on the shiny side of a silicon chip in a 24 cell well plate.
Remove most of the liquid but not all to avoid drying of sample, which adversely affects the ultrastructure. In a hood, quickly but gently add 2% – 4% EM grade PFA fixative (~0.5 ml) in 0.1M PB, pH 6.8 –7.4 by dispensing a slow stream on the side of the well, avoiding direct pressure on the sample. Be careful to prevent the chips from floating (may need to press down on a corner using fine-tipped tweezers).
Let the specimen incubate for 20– 30 minutes in fixative, then wash 2 × 5 minutes in rinsing buffer (PB or CAC).
Block with 1% BSA/PBS for 10 minutes (pH buffered to approximately neutral).
-
Add primary antibody 1:100 in 1%BSA/PBS for 1 hr.
May need to determine both primary and secondary optimal concentrations empirically; often a 10–100 fold increase in concentration is required compared to LM or western blot concentrations. Rinse 2 × 5 minutes w/ 1% BSA/PBS.
Add secondary antibody: e.g. 1:20 colloidal gold in 1% BSA/PBS for 30 minutes - 1 hr.
Rinse 3 × 5 minutes w/ PBS.
Fix as described in Basic Protocol 1 if using Cr for sputter coating (see Basic Protocol 2) or Alternate Protocol 7 if the OTOTO method will be used.
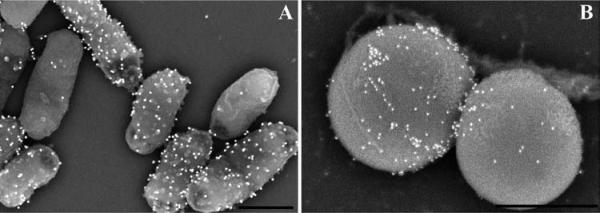
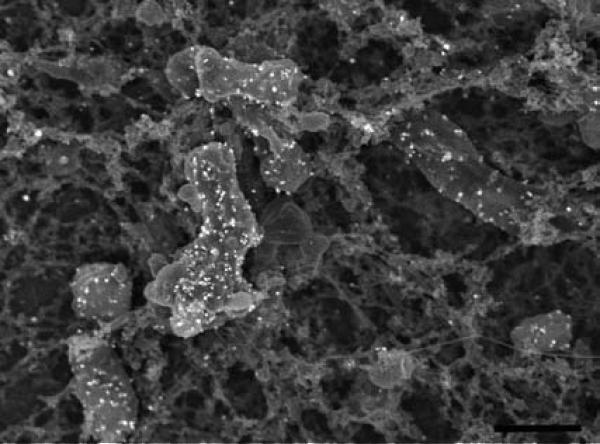
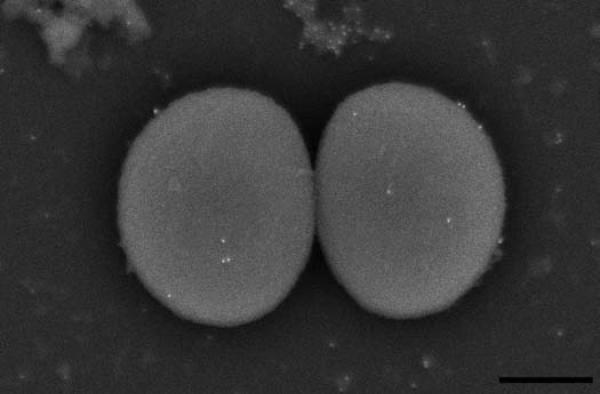
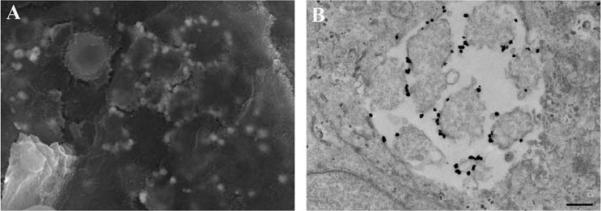
Size of gold should be carefully determined depending on the anticipated magnification being used. Typically 20 – 40 nm gold particles allow viewing at both low and high magnification (Figure 16 A), whereas smaller gold probes of 5 – 10 nm requires imaging at higher magnification (Figure 16 B).
Figure 16.
Yersinia pestis labeled with 20 nm gold, imaged at a nominal magnification of 35,000× (A) compared with Staphylococcus epidermidis labeled with 10 nm gold and visualized at a nominal magnification of 60,000× (B). Scale bars = 0.5 μm.
Alternate 8: Immune Labeling Internal Antigens with Small Gold Probes
Intracellular immune labeling requires additional considerations for accessing the antigens without excessive destruction of the specimen and subsequent fracture to reveal the structures of interest. Triton-X and methanol, common permeabilizing agents for LM, severely compromise membranes. Use of saponin, a mild detergent, allows diffusion of antibodies and small gold probes that can be subsequently enhanced with gold or silver for visualization by SEM. The following protocol has been adapted from an enzymatic method using horseradish peroxidase and 3,3'-Diaminobenzidine (DAB). [Brown & Farquhar (1989)].
Additional Materials
Small diameter (<1.5 nm) gold conjugates: Nanoprobes Nanogold or Aurion Ultrasmall gold
Fluorescent conjugates (optional): Invitrogen, etc.
Saponin, made fresh on day of use
Periodate-Lysine-PFA (PLP) fixative (see recipes)
Monobasic PB (see recipes)
Sodium chloride (NaCl)
Nanoprobes or Aurion's R-Gent silver enhancement kit
Deionized water
Plate cells on Thermanox™ coverslips or silicon chips in 24-cell well plates. Infect or treat as experimentally desired.
Rinse 2 × 5 minutes with HBSS.
-
Fix with 2–4% PFA + 0– 0.25% GA (titrate aldehydes for each antigen/antibody - if necessary) for 2 hr.
Optimal conditions can be experimentally determined by growing cells on glass coverslips and using a fluorescent secondary antibody before the more time consuming processing for SEM. Rinse 2 × 5 minutes with PBS (50 mM PB/150 mM NaCl; pH 7.4).
-
Incubate specimen for 5 minutes in 50 mM glycine in PBS (pH 7.4).
Addition of glycine can quench free aldehydes that contribute to non-specific binding. Permeabilize in PBS + 0.01% saponin (titrate saponin; range = 0.005 – 0.05) (Make fresh daily) for 5 minutes.
Block with 1% BSA/PBS for 10 minutes.
Add primary antibody 1:100 (antibody concentration may need to be titrated) in 1% BSA/PBS + 0.01% saponin for 1 hr.
Rinse 2 × 5 minutes with 1% BSA/PBS.
Add secondary antibody: 1:20 Nanogold (from Nanoprobes, Inc.) or Ultrasmall gold (from Aurion) in 1% BSA/PBS + 0.01% saponin for 1 hr.
Rinse 3 × 5 minutes with PBS.
Fix with 2.5% GA in 0.1 M PB for 1 hr.
Gold or silver enhancement step
Wash coverslips 3 × 5 minutes with buffer and then 5 × 5 minutes with dH2O.
Apply enhancement mixture for 15–30 minutes per manufacturer's instructions. Nanoprobes or Aurion's R-Gent silver enhancement kit.
Wash 5 × 5 minutes with deionized H2O.
-
Postfix with 1% OsO4 in dH2O for a minimal amount of time (i.e. 15 minutes for a monolayer).*
Avoid use of CAC buffer after enhancement as it diminishes the enhancement. Proceed as above for immune-labeled specimens using steps for OTOTO (Alternate Protocol 7) and then CPD (Basic Protocol 3 or its alternative). Following CPD, fracture cells to view internal structures as shown in Figure 17, and if OTOTO is not used, sputter coat with 15 – 20 angstroms of Cr as described in Basic Protocol 3.
Figure 17.
Bacteria in ovarian tissue labeled with Nanogold and silver enhanced for 15 minutes to improve visualization by SEM. Scale bar = 0.5 μm.
*Osmium tetroxide should be minimally used to avoid excessive etching of silver used for enhancement. Alternatively, etching can be avoided by performing gold enhancement. For this reason, it may be advantageous to omit the OTOTO step and coat with Cr if possible.
Alternate 9: Quantum Dot or Fluoronanogold Preparation for Correlative Techniques
During recent years, fluorescent nanocrystals known as quantum dots (Q-dots) have been adapted for specific biological labeling of a wide variety of molecules. Q-dots are readily detectable on standard fluorescent microscopes with little or no loss of photoluminescence over time. Furthermore, Q-dots are sufficiently electron dense for detection by TEM. Because emission wavelength is directly related to size, different size classes with distinct molecular targets can be applied to single samples, allowing identification of multiple targets simultaneously by either fluorescent or ultrastructural analysis. Using conductive fixation methods, carbon coating, and low electron beam potential, Q-dots can be detected on cells by SEM with significant spatial resolution, providing a useful tool for correlative techniques when identifying rare or transient events [DeLeo and Otto (2008)].
Additional Materials
Secondary antibody conjugate, for example, goat anti-rabbit 655 nm quantum dots (Invitrogen, Inc. or eBioscience)
Globulin-free BSA
Pre-fixation (suggested to immobilize specimen)
Wash samples adhered to silicon chip or coverslip 2 × 1 minute with an appropriate buffer such as PBS or HBSS, to remove residual medium components.
Fix with 4% PFA/ 0.1% GA in PBS for 15–30 minutes.
Wash 2 × 15 minutes with buffer.
Block with 2% globulin-free BSA in PBS for 15 minutes.
-
Replace the blocking solution with diluted primary antibody in blocking buffer 30 minutes at room temperature or overnight at 4 degrees C.
Titration of antibodies and incubation time may need adjustment to determine optimal conditions. -
Wash 2 ×15 minutes with blocking buffer.
Additional washing steps may be necessary to reduce background labeling. Replace the blocking solution with diluted secondary antibody (Q-dot conjugate) in blocking buffer for 1 hr.
Wash at least 2 × 15 minutes in blocking buffer and then 2 × 2 minutes with PBS to remove excess protein from blocking buffer.
-
Specimens can now be examined by fluorescence microscopy and then prepared for SEM by following the OTOTO procedure described in Alternate Protocol 7, and proper drying (see Basic Protocol 2). If necessary, a minimal (< 20 angstroms) of Cr or C can be applied to improve conductivity as described in Basic Protocol 3.
Q-dot specimens can also be prepared for TEM examination by conventional techniques, and Thermanox™ or aclar coverslips are the preferred substrate for adherent cells.
Figure 18 A – C demonstrates visualization of Q-dot labeled chlamydia infected HeLa cells by LM, TEM, and SEM respectively.
Fluorescently labeled small particle gold can also be used for correlative studies. Growing cells on glass coverslips and substituting fluoronangold as the secondary as described in alternate protocol 8 allows visualization by LM. Gridded coverslips can be particularly helpful in locating specimens in the SEM after viewing by LM.
Figure 18.
Q-dot labeling and detection by SEM. HeLa cells were infected with <i>Chlamydia trachomatis</i> elementary bodies, probed with anti-chlamydial rabbit serum, and labeled with anti-rabbit Q-dots (565nm peak emission). Panels A–C demonstrates examination of clustered elementary bodies on the surface of infected HeLa cells by fluorescence/light microscopy, TEM, and SEM, respectively. Scale bars = 500 nm unless designated).
Basic Protocol 5: Exposure of Internal Structures by Mechanical Fracturing
Visualization of internal structures by SEM provides useful information for topographical analysis of the relationship between structures not evident by TEM. Freeze-fracture techniques for cryo-SEM or replica generation, and Focused Ion Beam technologies provide exceptional methodologies but require expensive instrumentation and advanced skills. The “affordable” technique described below does not require either, and is suitable for many specimens.
Additional Materials
Scotch tape, syringe, scalpel, or micro-dissection scissors
Eyelash brush
After specimen is appropriately fixed and dried (see Basic Protocols 1 & 2 or alternatives), mount on SEM stub as described in Basic Protocol 3.
Prior to sputter coating (Basic Protocol 3), lightly touch mild adhesive tape (Figure 19) i.e. Scotch tape to surface of specimen to remove surface membranes or outer cell wall.
Alternatively, a syringe tip or scissors can be used to disrupt larger tissues, and the exposed areas should be lightly manipulated with an eyelash brush to desired location and pressed around the edges gently for good contact on adhesive mount.
-
Proceed to sputter coating steps as desired as described in Basic Protocol 3.
Care must be taken not to apply excessive pressure or too much material may be removed.
Figure 19.
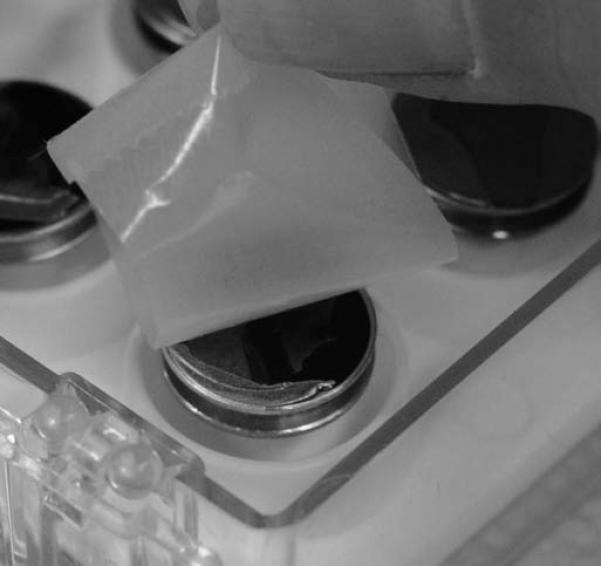
Scotch tape is gently applied to cell layer grown on Thermanox™ coverslips.
Figure 20 shows the random fractured appearance of specimens after disruption by Scotch tape (A), a syringe tip (B), or exposure after cutting with micro dissection scissor (C).
Figure 20.
Macrophages infected with Francisella tularensis fractured with adhesive tape to expose internalized bacteria (A), <i>Yersinia pestis</i> attached to internal spines of a flea proventriculus exposed by disruption with syringe tip (B), and malarial parasites invading the apical surface of a mosquito midgut after exposure using a micro dissection scissor (C). Scale bar = 1 μm.
Basic Protocol 6: Anaglyph Production from Stereo Pairs to Produce 3-d Images
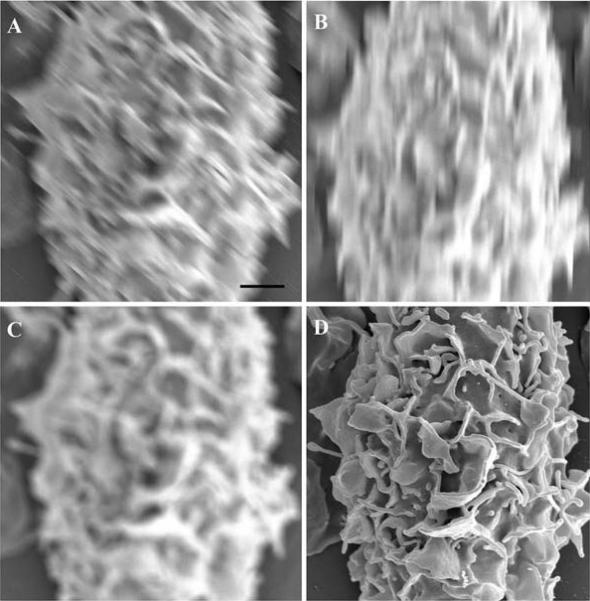
Stereo pairs can be viewed with red/blue 3-d glasses by producing anaglyphs with a computer imaging program capable of separating channels in RGB files such as Photoshop as demonstrated below [Adobe Photoshop]. The following anaglyph of an Ebola virus infected Vero cell was produced following established methods [Mannle, (see website)].
Additional Materials
Stereo pair*
Computer with imaging program, for instance Adobe Photoshop
Red/Blue 3-d glasses
*Stereo pairs are created by taking images of the same field of view from two different tilt angles. Typically, depending on the sample volume, the pair will include one image at 0 degree tilt and the second at 4–8 degrees, retaining the same field of view. Make sure that image rotation is off if applicable.
PC control key short cuts are utilized in the example below; Mac users should use the command key.
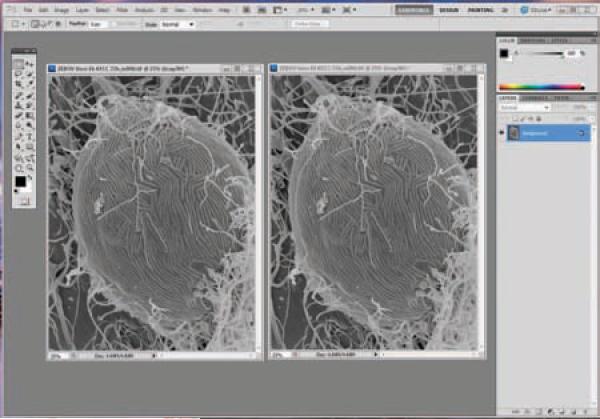
Align stereo pairs in an orientation such that when eyes are crossed, a 3-d image is observed. Typically this is achieved by rotating the image 90 degrees counter clockwise, and placing the 0 tilt image on the left, although dependent on microscope stage design. Sometime the tilt is already in the orientation illustrated above and rotation is not necessary. Adjust contrast and brightness of both images to desired levels. (Figure 21)
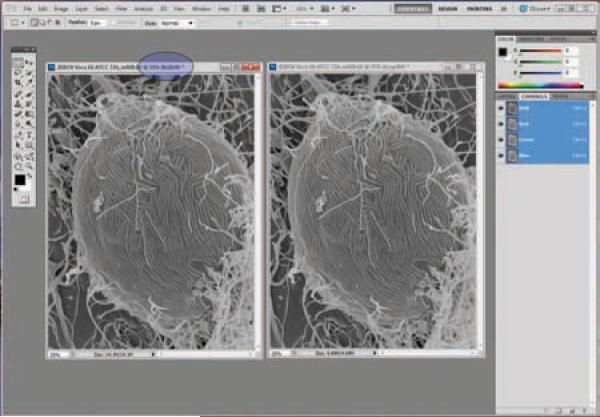
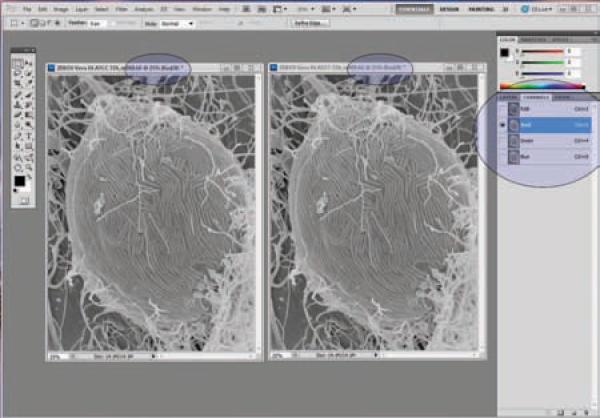
Convert both images to `RGB' to split the red, green, and blue channels. (Figure 22)
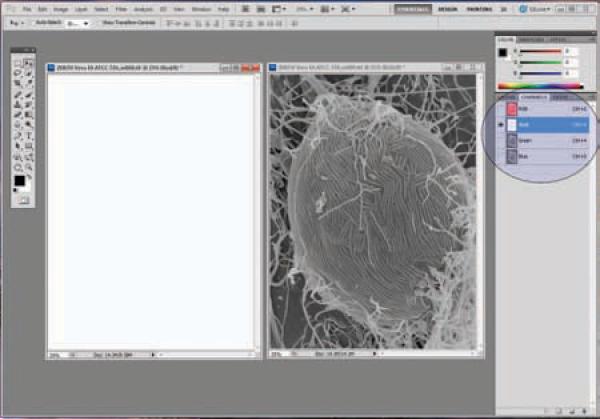
Click the image on the left; select the red channel, then select All (Ctrl + A), then cut (Ctrl + X) to remove the red channel from the image. Note that the red channel now appears blank. (Figure 23)
Click on the right image, select the red channel, then select All (Ctrl + A), then copy (Ctrl + C).
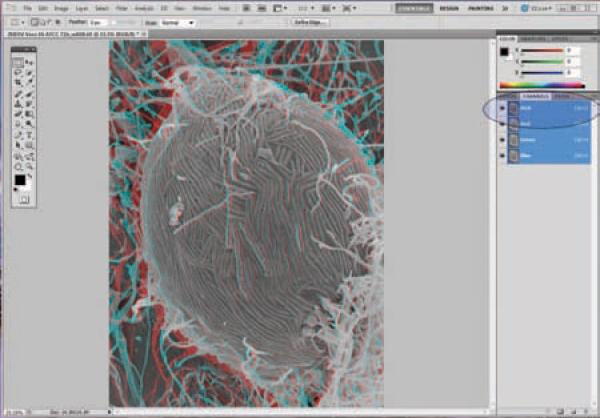
Click back on the left image, and then paste the previous selection (red channel from right image) on the left image by pasting the red channel (Ctrl + V). (Figure 24)
-
Now select the RGB channel on the right window, and view the anaglyph using red/blue glasses. (Figure 25)
With this particular orientation, the red lens is placed on the left eye. If the orientation was backwards, try using the red lens on the right eye, or flipping the image around 180 degrees. If image rotation was used during image capture, the anaglyph needs to be tilted accordingly.
Figure 21.
Aligned stereo pair.
Figure 22.
Images converted to RGB mode.
Figure 23.
Red channel removed from left image.
Figure 24.
Red image from right image copied on to left image.
Figure 25.
Selection of the RGB channel shows overlay of the new red channel, creating an anaglyph for 3-d viewing using red/blue glasses.
Reagents and Solutions
Primary fixatives
Glutaraldehyde and paraformaldehyde solutions
GA and PFA EM grade stock solutions are available from electron microscopy supply companies, (e.g. Electron Microscopy Sciences, and Ted Pella) and can be purchased as ready made kits, or diluted to desired concentrations using 0.2 M CAC or 0.2 PB and dH2O.
After exposure to air, GA and PFA begin to break down into glutaric and formic acid respectively, causing structural artifacts. Opened vials should be used within a day of opening. Working or stock solutions can be aliquoted into smaller volumes (i.e. 4 – 10 mls), into a freezer safe labeled container, i.e. PE tube, and sealed with parafilm. The solutions can be stored up to 6 months in a non-defrosting −20 degree C – (−80) degree C freezer.
PFA from powder
For 8% PFA stock solution, in 150 ml or larger beaker, add 8 grams of PFA powder (Fisher Scientific) to ~95 mls of dH2O. Heat to 60 degree C while stirring, then add 1N NaOH drop wise until solution clears. Bring up to 100 ml with dH2O and filter. Keep frozen aliquots in appropriate freezer vials sealed with parafilm at −20 – (−80) degrees C up to 6 months until ready to use.
Osmium or reduced osmium tetroxide
Osmium tetroxide stock solution is available commercially, typically as a 4% aqueous solution in 5ml or 10 mls glass ampoules sealed under nitrogen gas. Unopened, the stock solution can be kept at 4 degrees C for up to 12 months, although after opening, the stock solution should be kept in a container sealed with parafilm, and used within a few days, diluting with dH2O or CAC buffer to desired concentration. Osmium can be reduced by addition of potassium ferrocyanide from an 8% stock solution (w/v) just prior to use.
Alcian blue-lysine additive in GA/PFA fixative
In a fume hood using nitrile gloves, for 5.5 mls of fixative, add 750 μl of 0.5 M lysine-HCl to 1 ml of 10% PFA in dH2O. Add 2.75 mls of 0.2 M CAC, pH 7.2 and 500 μl of 0.75% (w/v) alcian blue. Mix solution. Just prior to adding fixative to your specimen, (it reacts immediately with the lysine) add 500 μl of 25% glutaraldehyde in dH2O.
The final concentration is 75 mM lysine in 0.075% (w/v) alcian blue, 2% PFA, 2.5% GA in 0.1M CAC, and should be used immediately. Alternative concentrations can be used [Fassel].
Periodate-Lysine-Paraformaldehyde (PLP) fixative
Solution A: 0.1 M lysine – sodium phosphate buffer
Add 1.83 g lysine-HCl to 50 ml dH2O
Add 0.1 M Na2HPO4 until pH 7.4 (~5 mls)
Bring up to 100 ml with 0.1 M NaPO4, pH 7.4 buffer
Solution B: 8% PFA in dH2O stock solution
Prepare this freshly on day of experiment:
Mix three parts solution A with one part solution B, and add sodium periodate (NaIO4) to a final concentration of 0.01 M (i.e. 2.13 mg NaIO4/ml of A + B mixture). Add the glutaraldehyde just prior to use. Final concentrations: 2% PFA, 0.01 M periodate, 0.075 M lysine, and 0.075 M PB. It is also possible to use a final concentration of 4% PFA for better ultrastructural preservation. GA can be added just prior to fixing, and the concentration should be titrated for each antigen (0–2%).
0.1 M Phosphate Buffer
PB is also commercially available, or can be easily made in the laboratory using the following recipe.
0.2 M monobasic stock solution
Add 13.9 g or sodium phosphate monobasic to 500 mls of dH2O
0.2 M dibasic stock solution
Add 53.65 g or sodium phosphate dibasic heptahydrate (or 28.4 g anhydrous) to 1L of dH2O
To make a 0.1M PB with approximate pH of 7.4, add 57 mls of monobasic stock to 243 mls of dibasic stock and bring up to final volume of 600 mls with dH2O. For a solution with pH of 7.2, 84 mls of monobasic stock solution can be mixed with 216 mls of dibasic stock solution and brought up to 600 mls as described above. PB buffers can be stored at room temperature or at 0 – 4 degree C, however they are susceptible to microbial contaminants, and should be freshly prepared monthly.
The pH can be lowered by increasing the proportion of monobasic volume relative to the proportion of dibasic volume [Hayat, 1993].
Antibody dilution buffer
Tris buffer with blocking agents
To 1L of dH2O, add 2.42 grams of Tris-acetate, 1.3 grams of sodium azide (NaN3), 9 grams of NaCl and mix until all solids have dissolved. Add 0.1% (w/v) BSA and 1% (v/v) Tween 20 to mixture to complete the solution for use in diluting antibody concentration. The addition of azide impedes bacterial growth, and the buffer can be stored at 4 degrees C for up to 12 months.
Additional 1 – 3% (w/v) BSA, non-fat dry milk, or (v/v) fish gelatin, normal serum from fetal calf, donkey, mouse, sheep, goat, or rabbit can be added to Tris or PBS to make the blocking solution. This can be stored at 4 degrees C, up to 3 months, although especially if using PBS should be monitored for bacterial contamination.
Commentary
Background information
Fixation techniques for SEM
The addition of inorganic compounds to stabilize and add contrast to biological materials by nature induces artifact. Despite this, steps can be taken to minimize the impact of chemical fixation to answer scientific questions. Early in the field of electron microscopy it was realized that fixation techniques utilized by light microscopists were inadequate for quality preservation of biological specimens at the resolution by EM. Seminal papers by Palade and Sabatini describe the benefits of OsO4 and aldehydes, respectively [Palade, (1951)] and [Sabatini, et al. (1963)]. Although many permutations have evolved, the basic protocols for chemically fixing biological specimens for electron microscopy still use aldehydes for primary fixation and OsO4 for secondary fixation. Ultimately, the specimen, the scientific questions being asked, and the availability of preparative and imaging tools determine the optimal protocol for a given experiment. An organism may require additives to the primary fixative to stabilize delicate structures; a tissue may require additional processing steps if immersion in primary fixative proves inadequate. Other specimens may require removal of components to expose a region of interest either through chemical or mechanical methods. Additional steps to increase the bulk conductivity of a specimen may be critical to prevent charging or improve the ability to visualize gold particles. The pH, temperature, and time are all factors that may need to be adjusted depending on specific requirements of the specimen.
Access to the most advanced instrumentation cannot improve poorly preserved specimens: garbage in = garbage out. Overgrown or “old” cell cultures can be structurally compromised before fixation begins, and when trying to make conclusions about pathology, proper controls are essential. Ultrastructural changes occur immediately post-mortem, and tissues should be harvested and placed into fixative as quickly as possible; perfusion may be necessary for optimal results. Great care must be taken to avoid exposure to air during fluid exchanges. Specimens should be fixed with minimal disruption to their optimal environmental conditions and consideration of preferred pH, salt concentration, and ionic requirements can assist greatly when selecting appropriate buffers for fixatives. Size of the specimen should be evaluated both for adequate penetration of fixative and for size limitations imposed by the microscope stage and lens geometry. The general guideline for adequate penetration of the primary fixative is a maximum of 1 mm in at least one dimension. However, this can vary tremendously depending on the specimen porosity, rigidity, and density. For example, lung tissue contains large void areas for gas exchange; luminal organs such as intestinal pieces may provide a port of entry through tubular space for better access to internal structures. Insects or other specimens with rigid cell walls may require only dehydration and coating for surface imaging. Bulk materials such as protein complexes may simply be air dried on a suitable substrate. Some specimens may be pre-treated to remove impeding structures. For instance, an epithelial airway may contain a mucous layer completely obscuring the surface of the cells. It may be necessary to mechanically or chemically remove such layers.
There are many extensive and comprehensive sources discussing and evaluating the chemistry for most compounds used for EM [Hayat (1993)], and of course familiarity with the literature on similar specimens can provide a starting point.
Critical point drying, specimen mounting, and sputter coating
Proper preparation does not end after the chemical fixation. Specimens need to be thoroughly dried. Most biological specimens require drying with either a critical point dryer, chemical dehydrants, or freeze-drying to avoid collapse. The specimen needs to be mounted on a suitable substrate for meeting microscope stage requirements, and additional considerations may include orientation, adherence properties, and enough surface contact with conductive mount to prevent charging. Specimens need to be coated or infused with conductive material to prevent radiation and thermal damage to structures.
Biological specimens are composed of low atomic number elements thus when the electron beam strikes the sample, the penetration is deep giving rise to a large interaction volume as the energy is absorbed within the specimen. The scattered electrons come from such a broad range around the point of entry that the resolution is greatly reduced. Deep penetration also contributes to loss of signal within the sample.
Non-conductive specimens, when bombarded with electrons, produce artifacts known as charging. This is manifested as image distortion, thermal damage, and dark areas within an image due to repulsion of electrons. Coating biological specimens with a thin layer of metal can reduce electrical charge build-up within a specimen. It can also improve mechanical stability and contrast, which if applied correctly in effect increases resolution by addition of larger atomic elements. This improves the probability of interaction with the electron beam to improve signal, although fine structures may be obscured. Balance between enough and excessive coating must be evaluated and is determined by the desired magnification and resolution. The major types of sputter coaters consist of low (<10 −3 Torr) or high vacuum (> 10−6 Torr) systems, and are briefly discussed below.
Evaporation systems are typically composed of a vacuum chamber connected to pumps able to achieve fairly low pressure. The target source is heated and, as the metal begins to evaporate, falls through the chamber onto the specimen. Since the flow is directional (material evaporates as an expanding void with the deposited portion comprising a range of solid angles from the source), the stage should be able to rotate and tilt for adequate deposition in areas that are not in direct line of site from the target. The films are generally quite thin, around 10 angstroms, but the system is limited to metals with a relatively low melting point as heat generated within the system can be damaging to a specimen.
Sputter coating with low vacuum systems coats by “chunk” deposition of metals to create large grain films that may be visible at high magnifications, although acceptable for viewing at low to mid-range magnifications. Magnetron sputter coaters are composed of a vacuum chamber but intentionally operate at higher pressure than evaporators. The chamber is evacuated and the system is then flooded with an inert gas such as argon. Ionization is caused by the voltage applied between the cathode and ground at low pressure. The current is a result of flow of ions between the cathode and ground. The target is composed of a metal usually in the shape of a donut or disc and a magnet. Negative ions are repelled by the cathode and travel toward grounded surfaces (those that pass through the magnetic field spiral and are deflected according to the ionic charge and momentum, and the density and orientation of the magnetic field). They are attracted to the magnet and divert away from the sample, avoiding damage. Positive ions are attracted to the cathode (metal target) and erode the metal, which falls by force of gravity to the bottom of the chamber onto the specimen. In this low vacuum system, there is a short mean path of travel causing metal to move erratically through the chamber, resulting in omni-directional coating of the specimen.
Ion beam sputter coating also erodes metals from a source for deposition on a sample but in a different manner. In this case, the system is under low pressure, and an electrostatic field is generated within a gun assembly. When argon is introduced into the field, gas ionizes and is directed into a collimated beam towards a target. The specimen should be tilted and rotated to achieve a continuous coating. Ion beam sputtering has an advantage over the magnetron system in being able to produce a very fine film and over the evaporator system in that it doesn't require the use of low-melting point metals. Final grain size and thickness of the film can be more accurately assessed by TEM analysis of sections cut from resin blocks on which a film has been deposited.
Immune labeling for SEM
In general, immune labeling of antigens is more easily achieved for SEM than for TEM since the labeling is usually done after mild fixation to deactivate and partially stabilize the specimen and subsequently fixed for “good” ultrastructure. This is not meant to imply the protocols are without inherent difficulties and concerns. Titration of primary and secondary antibodies is essential to avoid lack of labeling or excessive background staining; binding efficiency and steric hindrance may limit the number of sites labeled; determining appropriate gold size is critical for optimal imaging at preferred magnifications. Appropriate controls to confirm specificity are required. Too often in the literature a large arrow points at one gold bead with claims of specific labeling despite evidence of gold with similar concentration in the background (or worse, the surrounding area has been cropped out of the picture!) Correlative studies are becoming an increasingly important approach for relating structures to specific events or identification of specimens that cannot be labeled with an electron dense probe and may require modifications for visualization by both light and electron microscopy. Burghardt and Drolesky provide many useful insights and tips in their TEM protocols that can also be applied to immune labeling for SEM [Burghardt and Drolesky, (2006)].
Microscope parameters
When the specimen is finally ready for examination in the microscope there are several parameters controlled by the operator that can greatly affect the quality of an image. Optimization often involves compromise. Improved depth of field usually requires sacrifice in resolution; higher theoretical resolution achieved by higher voltage may be undone by increased depth of beam penetration. Spherical and chromatic aberrations and astigmatism are all factors that can prevent quality imaging. Basic adjustments that can be applied universally will be discussed in the following section.
Critical Parameters and Troubleshooting
Chemical fixation, drying, mounting, and coating specimens
Fixatives are an imperfect solution. They are highly extractive, and can induce rearrangement and disruption of cellular and subcellular structures. The goal is to minimize deleterious effects and preserve structures representative of their natural state. Table 1 provides a quick reference to address common problems, causes and possible solutions. Fixative penetration can be slow, and although more apparent in TEM, should still be considered a factor for SEM preparations as it may result in shrunken tissue or poorly fixed internal structures. Tissues require longer exposure time than cell monolayers. GA remains the most utilized primary fixative and is a strong cross-linker of proteins although dense materials may fix better if fresh PFA is added in conjunction with the GA [Karnovsky, (1965)]. Although PFA does not crosslink as quickly as GA it penetrates tissues more rapidly. This may be more critical for TEM preparations, but can be useful for SEM preparation of dense specimens. Addition of malachite green (MG) to the primary fixative with subsequent osmication stabilizes particular classes of lipids [Lawton, (1989)]. Addition of ruthenium red [Luft (1971)] or alcian blue/lysine [Fassel, et al. (1997)] mixtures to the primary fixative can stabilize polysaccharides that are routinely lost during conventional processing. Generally, room temperature addition of fixative is acceptable although in some cases it may be less extractive to perform the steps at 0 – 4 degrees C.
Table 1.
Troubleshooting guide for specimen preparation
| Problem | Possible Cause | Possible Remedy |
|---|---|---|
| Structures appear shrunken | Improper fixation | Alter strength or type of fixative |
| Hypertonic buffer | Adjust salt concentration | |
| Excessive holes in membranes | Inadequate dehydration | Start dehydration series with lower concentration of ethanol or acetone |
| Specimen exposed to air during fluid exchanges | Avoid unnecessary exposure to air. | |
| Avoid complete removal of solutions during exchange, do more exchanges | ||
| Inadequate exchange in critical point dryer | Do more and extended exchanges of fluids in the CPD | |
| Put under vacuum before completely dried | Allow specimen to dry overnight before placing under vacuum | |
| Debris on specimen | Incomplete washing with buffer | Additional wash steps prior to first fixations may be necessary |
| Use of mild detergents or other reagents may be required | ||
| Capsular material appears sloughed off in background | Inadequate fixation | Additives may be required for stabilization, i.e. alcian blue or ruthenium red. |
| Adjust pH or buffer appropriately | ||
| Specimen moves while imaging | Poor contact with mounting substrate | Add conductive paint around specimen to “seal the cracks” |
| Not enough material adhering to substrate | Concentration of specimen too low | Allow longer settling time before fixation |
| Increase initial concentration | ||
| Poor adherence properties | Pre-treat mounting substrate with adhesive | |
| Excessive charging of sample (SeeTable 4) | Poor contact of specimen to mount | Improve contact by more firm placement on conductive adhesive, and coat with conductive paint if appropriate |
| Inadequate metal coating | Increase thickness of metal coating | |
| Inadequate bulk conductivity | Increase bulk conductivity through OTOTO | |
| Fine detail seems obscured And/or surface appears “chunky” | Excess metal applied during sputter coating | Apply thinner layer of metal |
| Use finer grain or lower atomic number element |
There are a variety of buffer choices used for EM specimen processing. The most commonly used are PB and CAC buffers, which are thought to be less extractive than other buffers. PB buffers are thought to most mimic cytoplasmic environments but have a short shelf life as they easily support bacterial growth and can contaminate specimens when they produce electron dense precipitates in the presence of calcium ions. CAC buffer works equivalently to PB without the concern for precipitates. However, it contains arsenic, and thus is a hazardous waste, but it has a longer shelf life. Buffers such as HEPES and PIPES are non-toxic and ions can easily be added although they may not be as effective in buffering capacity as CAC or PB. The buffer must be compatible with the specimen of interest.
Tris should not be used during primary fixation with aldehydes as it reacts with GA
Addition of heavy metals to biological specimens provides both structural stability and elemental contrast that is important for imaging by electron microscopy. OsO4 stabilizes both lipids and proteins. Addition of TA and UA can also increase bulk conductivity of a specimen, enhance membrane stabilization, and improve overall contrast. With successive rounds of OsO4 and TA or TCH as outlined in the OTOTO protocol, enough metal may be infused in the specimen to obviate the need for additional metal coating.
Although this Unit is limited to room temperature sample prep for SEM, Figure 26 demonstrates the extraction of cytoplasmic elements in chlamydia infected HeLa cells that were high pressure frozen and freeze fractured following either a brief exposure to PFA (A) or fixation with GA /0.1% MG followed by OTOTO (B). Note the obvious extraction of cytoplasmic elements in the more extensively fixed specimen, which for some studies may be preferred to expose features of interest.
Figure 26.
Chlamydia infected HeLa cells high pressure frozen and freeze fractured after fixing with PFA only (A) or with 2.5% GA/0.1% MG and OTOTO treatment (B). Scale bar = 5 microns.
Adequate dehydration of specimens is critical to avoid collapse of structure under vacuum. Biological specimens are composed primarily of water, which needs to be removed from the specimen without introducing shrinkage artifacts (think of plums versus prunes!). Water has strong surface tension due to hydrogen bonds and when evaporated from a biological specimen, the adhesion forces of the water cause crinkling or breakage of membranes or both. Figure 27 shows polarized HeLa cells after insufficient dehydration. The large cracks in (A) could be dehydration artifacts, although these cells were grown on a membrane filter, and mechanical damage during specimen mounting may have contributed to the breakage. The holes in (B) are most likely due to incomplete removal of water or full exchange of the transition agent in the CPD. Surface tension can be reduced with ETOH or acetone. For delicate specimens, a graded series of solvent may be required to prevent damage, and then subsequently replaced with CO2, which can reach its critical point, reducing surface tension to zero under tolerable temperature and pressure for most biological specimens. The gas is slowly released and the structure should remain largely intact.
Figure 27.
Polarized epithelial cells grown on membrane filters after drying and coating, revealed damage to the monolayer (A) and at higher magnification damage to the membrane was evident (B). Scale bars = 0.5 micron.
Some specimens may not fit in a CPD, or may be unable to withstand the turbulence for which there are chemical alternatives such as HMDS. Although best application is for rigid specimens, chemical alternatives can be useful for some delicate specimens.
After drying, specimens are mounted on a SEM mount or stub that is microscope specific. The specimen can be placed on a conductive adhesive and/or attached using conductive paint and allowed to dry. Tissues or cell layers can be mechanically fractured to expose internal structures using an adhesive tape gently applied to the surface or with a scalpel or syringe tip depending on the tissue. The sample should be coated after fracturing so a conductive layer is applied to newly exposed surfaces.
Metal selection will be somewhat determined by available equipment although there are several points to consider. Conductivity is of major importance. Metals such as silver, gold, and copper all have good conductivity. During metal deposition, the metal coats the surface of the specimen and initially serves to nucleate a film as more metal is deposited. Gold is susceptible to thermal fluctuation, expanding and contracting which can cause cracks and impede conductivity. It also has a strong cohesive force with itself, and as it migrates can form puddles of gold interfering with surface topography. Frequently gold targets are mixed 60:40 with palladium (Au/Pd) to reduce the cohesiveness and prevent clustering. With improved resolution of modern microscopes, the Au/Pd mixture can interfere with high-resolution imaging. Alternatives that provide consistent and more refined layers include iridium and chromium. Iridium provides better elemental contrast and chromium with its lower atomic number doesn't interfere with gold visualization, although is more easily oxidized and not as stable over time. Charge variation on the specimen surface can prevent even distribution of the metal, and wettability can be improved by depositing a light layer of carbon or chromium prior to addition of the heavier metal.
Topography of a specimen can be enhanced by coating at a fixed angle with a heavy metal and then adding a continuous film of a lighter element. For instance, in Figure 28, proteins were fixed on a silicon chip, critical point dried, and then rotary shadowed with iridium (A) or shadowed with Pt followed by rotary shadowing with carbon to improve conductivity (B). Note the difference in apparent dimensionality created by application of Pt from a fixed angle to create a shadow effect. It should be noted that at higher magnification, the grain size of the Pt becomes obvious.
Figure 28.
Protein globules adhered to an untreated silicon chip were either rotary coated (tilted +/− 90 degrees, 360 degree rotation) with 40 angstroms of Ir (A) or shadowed at a 15 degree fixed angle with 20 angstroms of Pt followed by rotary coating +/− 85 degrees with 20 angstroms of C (B). Scale bar = 0.5 micron.
In some instances such as gold or quantum dot labeling, impregnating specimens with heavy metals may provide enough conductivity to a specimen making coating unnecessary as described in Alternate Protocol 7.
Immunology
The ability to localize antigens is an incredibly powerful tool. Electron dense probes such as colloidal gold, Nanogold, Aurion Ultrasmall gold, or quantum dots, allow high spatial resolution of macromolecular structures to provide superior insights into cellular and subcellular composition and functional relationships. Although there are many reagents to choose from and permutations to improve labeling, it is helpful to understand some basic strategies including the labeling, chemical and mechanical post-processing, necessary controls, and interpretation of results.
All protocols involve specific labeling with a primary antibody or probe, either directly conjugated to or subsequently labeled with an electron dense probe. Optimal concentrations should be experimentally determined through titration of both primary and secondary antibodies.
Primary antibodies can be polyclonal or monoclonal. Polyclonal antibodies may recognize multiple epitopes on the antigen of interest. Monoclonal antibodies typically recognize a single epitope. Many polyclonal and monoclonal antibodies to a variety of cellular antigens are commercially available but must be tested for activity under the appropriate conditions.
Gold colloids are usually complexed with species-specific secondary antibodies. In most cases it is time and cost effective to purchase commercially available probes. Gold probes can vary in size from <1 nm – >80 nm. For directly viewing gold in an SEM, 20 – 40 nm size particles are generally preferred for ease of visualization at mid-range magnifications. Steric hindrance may impede efficiency of binding and in this case smaller gold probes may be beneficial. If using Nanogold or Aurion Ultrasmall gold, the signal can be amplified through either gold or silver enhancement techniques.
Plan ahead! Proper controls are absolutely essential for proper analysis of the results. The controls should include, where appropriate, uninfected cells, non-expressing cells, isotype matched irrelevant primary antibody control, known positive antibody control, secondary only (substitute blocking buffer for primary), and if applicable, silver or gold enhancement only controls. Some degree of non-specific (background) binding is almost always inevitable. Tips for reducing background labeling are in Table 2. Figure 29 shows three different labeling outcomes. The focal plane in Figure 29 A suggests that the bacteria are well-labeled, although at closer inspection, excessive background gold is evident, clouding interpretation. Figure 29 B shows labeling that appears specific above a lesser amount of background levels, and (C) shows a highly specific interaction with little or no background labeling.
Table 2.
Troubleshooting guide for immune-labeling
| Problem | Possible Cause | Possible Remedy |
|---|---|---|
| Little or no label | Antigen not exposed | Use permeabilizing agent, i.e. saponin |
| Fixation disrupts/alters antigen | Titrate or change fixatives | |
| Primary or secondary concentration too low or not specific | Titrate antibodies, try alternative antibodies | |
| Steric hindrance of large antibodies | Use smaller probes | |
| Loss of structure | Find alternative fixation additives, i.e. alcian blue or ruthenium red | |
| Cross-reactivity | Change ab species | |
| Excessive label on specimen | Concentration of primary and/or secondary ab too high | Dilute antibody concentration |
| Increase NaCl concentration | ||
| Non- specific binding to specimen | Change blocking buffer | |
| Quench aldehydes by adding 0.1% glycine | ||
| Excessive label on background substrate | Concentration of primary or secondary ab too high | Titrate ab concentration |
| Add or change blocking agent | ||
| Poor elemental contrast in microscope | Gold size too small | Use larger gold size or enhance with silver or gold |
| Sub-optimal microscope settings | Use larger aperture, greater voltage, bigger spot size, shorter working distance | |
| Coating or OTOTO masked gold | Apply lighter coat of low atomic number metal and/or reduce OTOTO incubation time. | |
Figure 29.
Immune-labeled bacteria demonstrating excessive background labeling in the out of focus regions (A), moderate background labeling (B) or minimal levels of background labeling (C). Scale bars = 0.5 micron.
Immune-labeling for SEM, in general, labels surface exposed antigens and the immunology is usually performed following mild fixation, usually 2 – 4% PFA in suitable buffer to immobilize a cell (this is not always necessary for viruses, bacteria, or macromolecular complexes unless required for biosafety or for stabilization). Figure 30 demonstrates specific labeling of material that appears to have sloughed off during preparation, suggested by what appears to be specific labeled material on the mounting substrate. Stabilization of the structure, by addition of alcian blue-lysine to the primary fixative, resulted in successful retention of structures as shown previously in Figure 4.
Figure 30.
Immune-labeled Staphylococcus epidermidis prepared by conventional EM techniques demonstrates detachment of structure of interest. Scale bar = 0.25 micron.
Blocking steps often help reduce non-specific binding and can include nonfat milk, fish gelatin, globulin-free bovine serum albumin or fetal calf serum. Addition of salts such as sodium chloride or potassium chloride, or mild detergents such as Tween 20 can help reduce background excess. The blocking buffer or a reduced protein version should be used as a vehicle for the primary and secondary antibodies, and the washing steps in between. The number and duration of washes can help reduce excess binding. After labeling, specimens should be thoroughly rinsed with buffer and dH2O to remove excess gold, and then the specimen processed according to preferred protocol.
Choice of gold size and metal coatings should be carefully considered. Chromium or the OTOTO methods do not obscure most gold particles. Enhancement of the gold prior to coating can add elemental contrast for viewing. Microscope specific parameters will be discussed in the following section.
Although cryo-SEM techniques are not discussed in the Unit, it is worth pointing out that this technique also allows viewing labeled specimens by freeze fracture after high pressure freezing and could be useful for complementary techniques as shown by cryo-SEM and room temperature TEM in Figure 31 A & B respectively.
Figure 31.
Chlamydia infected HeLa cells were immune-labeled intracellularly for antigens against a bacterial surface protein using Nanogold followed by silver enhancement and viewed by either cryo-SEM (A) or TEM (B). Scale bar = 0.5 micron.
Microscope Settings
The following section offers practical guidelines for imaging biological specimens by SEM and Table 3 and 4 offer suggestions for ameliorating specific conditions. A more complete discussion behind the theory and limitations of microscope resolution and operations can be found in a variety of sources [Goldstein, et al (2002)].
Table 3.
Troubleshooting guide for microscope parameters
| Problem | Possible Cause | Possible Remedy |
|---|---|---|
| Specimen moves while imaging | Poor contact with mounting substrate | Press specimen more firmly on surface of mount |
| Poor contact of specimen to mount | Apply conductive paint around specimen to improve contact | |
| Excessive charging of sample | Inadequate bulk conductivity | Decrease number of electrons entering sample or Increase number of electrons exiting sample (See Supplemental Table 1) |
| Specimen oxidized | ||
| Image appears stretched | Astigmatism from contaminants | Stigmate aperture |
| Unable to stigmate | Misaligned objective aperture | Center beam and aperture |
Table 4.
Troubleshooting guide to decrease charge artifacts
| Decrease electrons entering | Increase electrons exiting |
|---|---|
| Decrease voltage | Good contact between sample and mount (if necessary use conductive paint) |
| Increase bias | Screw mount to stage for better grounding |
| Reduce spot size | Thicker or different metal coating |
| Insert smaller aperture If available, change detector (e.g. lower instead of upper) | Increase bulk conductivity (i.e. OTOTO) Shorten distance of travel to detector by tilting specimen towards detector |
| Increase scanning speed or use frame buffering system | |
| Adjust beam current (usually reduced) |
In theory, higher voltages, smaller apertures, smaller spot sizes, and shorter working distances are tantamount to better resolution. In practice, however, optimal settings vary widely depending on the application. Of course, a well-aligned microscope is essential in producing high quality images, and alignments, focusing and proper stigmation, should be performed at magnifications higher than used for imaging.
Voltage
Abbe's Law defines resolution as directly proportional to the wavelength used for imaging; the shorter the wavelength, the closer two objects can be and still remain distinct. Electrons travel in much shorter wavelengths, by a factor of x<103, compared to photons, giving electron microscopes much higher resolving power than light microscopes. Electrons have an increasingly shorter wavelength as the voltage increases, corresponding to better resolution. However, they also travel with more energy and the beam penetrates more deeply, especially into biological specimens, which degrades resolution.
There are two types of scattering events that occur as the electron beam strikes a surface, elastic or inelastic, and depending on the event, cause either backscattered or secondary electrons that can be preferentially detected. Elastic scattering events occur when the electron beam strikes the specimen and deflects with little or no loss of energy, and the electron “bounces” off the sample as a backscattered electron (BSE). BSE generation is greater for higher atomic numbered elements and the frequency of interactions in a biological specimen labeled with 20–40 nm colloidal gold is much greater with the gold atoms than on adjacent carbon atoms. Thus, more BSEs are generated providing elemental contrast to allow identification of gold particles on biological specimens. BSEs are selectively collected by backscatter detectors. Inelastic events occur when electrons striking a sample interact with other electrons, and with great loss of energy, cause emission of secondary electrons and characteristic X-rays (which can be used for elemental analysis). Secondary electron images are produced based on specimen topography and detector geometry, and thus are collected to image surface contour. Biological specimens are susceptible to deep penetration by the electron beam, and the resulting interaction volume can result in loss of signal or generation of secondary electrons from a broad depth that degrades resolution. Adequate coating, metal impregnation, and appropriate voltage requirements based on the specimen should be considered to optimize imaging conditions.
A lower voltage beam is more susceptible to the effects of chromatic aberration, results in lower signal, but does not penetrate the specimen as deeply. The “correct” voltage is sample dependent (Figure 32). For lightly coated specimens, imaging with a field emission SEM at 2 kV (Figure 32 A) provides adequate signal and good definition of surface features. For cell monolayers or most tissues with adequate coating, 5 kV generally provides better signal without excessive beam penetration (Figure 32 B). Higher voltage at 10 kV in this case may result in loss of resolution due to deep penetration of the electron beam. Note the ghost-like appearance in Figure 32 C.
Figure 32.
Macrophages grown on aclar coverslips, conventionally prepared and coated with 75 angstroms of Ir were imaged by SEM at 2 kV (A), 5 kV (B) or 10 kV (C). Scale bar = 1 micron.
Conversely for specimens that lack depth, increasing voltage may improve both signal and resolution as shown in Figure 33. In this case protein fibrils processed by OTOTO that were uncoated showed charging artifacts (Figure 33 A). When the same preparation was coated with 20 angstroms of chromium, imaging at higher voltage allowed better visualization of surface topography (Figure 33 B – E). Specimens shadowed with 15 angstroms of Pt and rotary coated with 20 angstroms of carbon obscured fine detail and metal grains became more evident (Figure 33 F).
Figure 33.
Amyloid protein fibrils were processed by OTOTO and then left uncoated, (A), or coated with 20 angstroms of Cr and examined at 5 kV (B), 10kV (C), 30 kV (D–E). Also examined at 30 kV were fibrils coated with 15 angstroms of Pt and 20 angstroms of C (F). Scale bars = 0.05 micron.
Depth of field
One of the great features of SEMs is the tremendous depth of field capacity. Relatively large objects can be imaged entirely in focus if the working distance is set accordingly. Again, compromise may be required. Placing an object closer to the objective lens will increase the resolution but it also limits the focal plane. The “correct” working distance is established by the desired imaging effect or limitations of the stage. For high-resolution imaging of relatively flat surfaces, 0.1 mm – 5 mm distances are generally quite good. For larger specimens, the working distance may be increased to 45 mm, and for specimens in between, 8–15 mm distances are usually preferred. Of course some of this will also depend on detector geometry and how much signal is sacrificed when using long working distances. Figure 34 shows an HIV infected lymphocyte at 5 mm versus 17 mm distance from the objective lens. Note that although the “top” of the cell is well focused in Figure 34 A, the image becomes blurred quickly in the background compared to the cell in Figure 34 B, where the cell and background substrate are both in focus.
Figure 34.
HIV infected T-lymphocyte imaged with 5 kV at a working distance of 5 mm (A) or 17 mm (B). Scale bar = 1 micron.
Apertures are inserted to reduce spherical aberration. In theory smaller apertures are most effective, but the compromise is reduction in signal. Objective apertures typically range from 30 – 100 μm in diameter. Generally, 50 μm apertures are suitable for most applications. Since elemental contrast is dependent on number of beam interactions, a larger aperture may provide better signal and improved contrast. After the electron beam and apertures have been centered, it is important to correct for astigmatism. This is most easily accomplished by going through focus and using the stigmator control, correct the stretch in the image, first in one direction, and then in the other. Several iterations of this must sometimes be performed to refine the images. Figure 35 demonstrates the difference between astigmatism in the × direction (A), y direction (B), corrected but out of focus (C), well stigmated and focused (D).
Figure 35.
Images of a macrophage show astigmatism in the x direction (A), y direction (B), corrected (C), corrected and focused (D). Scale bar = 2 microns.
Charge artifact
Entropy is induced when the electron beam strikes a specimen, where regions of both positive and negative charge are produced. If an area becomes more positive, it displays as a dark region since it attracts more electrons. More commonly, negative regions show up very bright as they repel electrons, displayed as streaking, flattening and in extreme cases, smearing of electrons and damage to specimen, preventing quality visualization and imaging (Figure 36). Neutralizing a specimen requires the number of electrons entering a sample equaling the number leaving a sample. Charging occurs when the number of electrons leaving a sample, are greater or less than the number of electron entering. Table 4 provides methods to reduce charging by either decreasing the number entering or increase the number exiting a specimen.
Figure 36.
Mouse dendritic cells (A) and Plasmodium infected red blood cells (B) imaged at 2 kV display minor signs of charging seen as flattening or streaking respectively. The macrophage imaged at 2 kV in (C) shows more extreme charging, rendering the image useless. Scale bars = 0.5 micron.
Anticipated Results
General SEM preparation and imaging
Successful imaging by SEM begins with quality specimens whose structures have been preserved in a state representative of how they exist in nature. Specimens should be properly attached and fixed on a mounting substrate and coated or prepared in a manner such as OTOTO to reduce artifacts such as charging or movement. Dehydration artifacts should be minimized through proper dehydration techniques.
Selection of appropriate SEM voltage requires a balance between good signal to noise ratio, depth of penetration consideration, and resolution requirements. Working distance should be adjusted depending on the range of depth in the z-axis to achieve desired effects. For instance, in Figure 37, the feature of interest is the centered HeLa cell infected with both streptococcal bacteria and Varicella Zoster Virus (VZV). The working distance of the specimen is adjusted so that most of the cell is in focus, and the surrounding “background” cells are slightly out of focus. This draws the viewers' eyes to the region of interest and appears to add depth to the specimen.
Figure 37.
HeLa cell co-infected with VZV and Streptococcus. Scale bar = 1.5 microns.
Selection of voltage can greatly influence the ability to resolve small structural details, and the gain in resolution at high voltage can be undone by deep beam penetration within the specimen. Flat specimens, such as purified proteins or complexes well adhered to mounting substrate, can often be imaged at very high voltages since they have little depth to their structures.
Immune labeling, imaging, and interpretation
Although immune labeling provides a powerful tool for localization of cellular proteins, correct interpretation of results is dependent on the quality and quantity of the label, and proper controls. The amount of gold particles present should convincingly exceed background levels which should be visible in the image. Controls should include use of an irrelevant primary antibody, specimens that lack protein or structure of interest, and when appropriate, silver or gold only enhancement. Although it is tempting to use the amount of gold label for quantification studies, this cannot be done without normalization for variables such as binding efficiency and antigen accessibility, however qualitative observations can often be made.
Imaging with appropriate voltage, magnification, and other microscope parameters in BSE or mixed BSE/SE imaging modes are all important considerations for visualizing the gold particles. Note in Figure 38 A, SE imaging does not provide the elemental contrast needed to visualize the gold particles labeling a glycoprotein associated with the biofilm produced by staphylococcal bacteria. By increasing the amount of BSEs collected compared to SEs, the gold particles are readily identifiable as shown in Figure 38 B.
Figure 38.
Staphylococcus epidermidis immune labeled for biofilm localization shown in both SE (A) and mixed SE and BSE (B) imaging mode to allow visualization of gold particles. Scale bar = 0.5 micron.
Time Consideration
Conventional specimen preparation
SEM specimen preparation is relatively quick. Specimens are washed, fixed, and dehydrated within 2 hours. Bulk materials may require extended incubation time in the various fixative components, or additional steps to improve conductivity of the specimen, although overall chemical processing still takes less than one day. Microwave technologies have greatly reduced the time required for many as discussed in Support Protocol 3.
Improper dehydration is a primary culprit in deterioration of cell membranes, and special care should be taken with fragile specimens that may require a graded series of ethanol or acetone, and possibly longer exchanges in the CPD or chemical dehydrant. It is recommended that specimens be allowed to dry overnight in a desiccator prior to placement under vacuum.
Sputter coating, depending on the system, can take minutes or hours. In general, since a continuous film is built on nucleating events as the metal strikes the surface of the specimen, it is better to coat more quickly to avoid migration and “puddling” of the metal through more rapid deposition of nucleating centers.
Immune labeling
Successful immune labeling generally requires blocking, antibody incubations, and multiple washing steps prior to fixation and subsequent steps for general SEM processing. In the case of external antigens, the immunology can be performed in 2 – 3 hours, and the fixing and drying as described above may take an additional 2 – 3 hours. Titration of antibody concentration may be required to achieve optimal results and can require several attempts for satisfactory yield. It can be advantageous to perform preliminary experiments to determine optimal buffer and blocking conditions, and titration of aldehydes and antibodies, using fluorescent secondary abs.
Labeling internal antigens requires additional permeabiliziation steps, and if gold or silver enhancement is necessary, several hours will be added to the procedure.
Acknowledgments
The authors would like to thank Dr. Ted Hackstadt for critical review of the manuscript and Dr. Raymond Rosado for technical assistance with the MW protocol. Support and funding for this work is from the Intramural Research Program of the National Institute of Allergy and Infectious Diseases, National Institutes of Health.
Footnotes
Internet Resources
Below are some common sources for electron microscopy supplies, reagents and useful tips for immune-labeling and MW processing
http://www.emsdiasum.com/microscopy/
Particularly useful MW theory and protocols from University sites
Sanders, M. at the University of Minnesota
Advanced Microscopy Facility, University of Victoria
http://www.stehm.uvic.ca/docs/prep/microwave/protocols.php
Below are additional resources for commercially available antibodies and small gold probes
http://www.aurion.nl/products/gold_sols.php
Anaglyph method from Bob Mannle's website, Micro Format, Inc.
http://supercolorviewerpaper.com/advanced3-d.html
Adobe Photoshop
Literature Cited
- Boyd A, Franc F. Freeze-drying shrinkage of glutaraldehyde fixed liver. J. Micros. 1981;122:75–86. doi: 10.1111/j.1365-2818.1981.tb01244.x. [DOI] [PubMed] [Google Scholar]
- Boyd A, Maconnachie E. Freon 113 freeze-drying for SEM. Scanning. 1979;2:164–166. [Google Scholar]
- Braet F, deZanger R, Wisse E. Drying cells for SEM, AFM and TEM by hexamethyldisilazane: A study on hepatic endothelial cells. Journal of Micros. 1997;186:84–87. doi: 10.1046/j.1365-2818.1997.1940755.x. [DOI] [PubMed] [Google Scholar]
- Brown WJ, Farquhar MG, Cell Biology Immunoperoxidase methods for the localization of antigens in cultured cells and tissues by electron microscopy. Meth. Cell Biol. 1989;31:553–569. doi: 10.1016/s0091-679x(08)61626-x. [DOI] [PubMed] [Google Scholar]
- Burghardt RC, Droleskey R. Transmission Electron Microscopy. Currrent Prot. In Microbiol. 2006:2B.1.1–2B1.39. doi: 10.1002/9780471729259.mc02b01s03. [DOI] [PubMed] [Google Scholar]
- Corwin D. An improved method for cleaning and preparing ticks for examination with the electron microscope. J. Med. Entomol. 1979;16(4):352–353. doi: 10.1093/jmedent/16.4.352. [DOI] [PubMed] [Google Scholar]
- DeLeo FR, Otto M. Methods in Molecular Biology, vol. 431:Bacterial pathogenesis: methods and protocols. Humana Press; Totowa, New Jersey: 2008. pp. 173–187. Dorward, D.W. [Google Scholar]
- Dixon BR, Petney TN, Andrews RH. A simplified method of cleaning Ixodid ticks for microscopy. J. Micros. 2000;197(2):317–319. doi: 10.1046/j.1365-2818.2000.00663.x. [DOI] [PubMed] [Google Scholar]
- Fassel TA, Mozdiak PE, Sanger JR, Edminston CE. Paraformaldehyde effect on ruthenium red and lysine preservation and staining of the staphylococcal glycocalyx. Microscop. Res. Tech. 1997;36:422–427. doi: 10.1002/(SICI)1097-0029(19970301)36:5<422::AID-JEMT12>3.0.CO;2-U. [DOI] [PubMed] [Google Scholar]
- Giberson RT, Demaree RS., Jr. Microwave techniques and protocols. Humana Press; Totowa, New Jersey: 2002. [Google Scholar]
- Goldstein JI, Newbury DE, Echlin P, Joy DC, Fiori C, Lifshin E. Scanning Electron Microscopy and X-Ray Microanalysis. Plenum Press; New York and London: 2002. [Google Scholar]
- Hayat MA. Stains and chemical methods. Plenum Press; New York and London: 1993. [Google Scholar]
- Karnovsky MJ. A formaldehyde-glutaraldehyde fixative of high osmolality for use in electron microscopy. J. Cell Bio. 1965;27:137A. [Google Scholar]
- Lawton JR. An investigation of the fixation and staining of lipids by a combination of malachite green or other triphenylmethane dyes with glutaraldehyde. J. Micros. 1989;154:83–92. doi: 10.1111/j.1365-2818.1989.tb00570.x. [DOI] [PubMed] [Google Scholar]
- Lee JTY, Chow KL. SEM sample preparation for cells on 3D scaffolds by freeze-drying and HMDS. Scanning. 2011;33:1–14. doi: 10.1002/sca.20271. [DOI] [PubMed] [Google Scholar]
- Luft JH. Ruthenium red and violet. Anatomical Record. 1971;171:347–377. doi: 10.1002/ar.1091710302. [DOI] [PubMed] [Google Scholar]
- Nation JL. A new method using hexamethyldisilazane for preparation of soft insect tissues for scanning electron-microscopy. Stain Technology. 1983;58:347–351. doi: 10.3109/10520298309066811. [DOI] [PubMed] [Google Scholar]
- Palade GE. A study of fixation for electron microscopy. J. Exp. Med. 1951;95:285–297. doi: 10.1084/jem.95.3.285. [DOI] [PMC free article] [PubMed] [Google Scholar]
- Sabatini DD, Bensch K, Barrnett RJ. Cytochemistry and electron microscopy: the preservation of cellular ultrastructure and enzymatic activity by aldehyde fixation. J. Cell. Bio. 1963;17:19–58. doi: 10.1083/jcb.17.1.19. [DOI] [PMC free article] [PubMed] [Google Scholar]
Key References
- The following books are excellent resources for general EM preparative techniques covering general principle for conventional and immunological preparation.
- Glauert AM. Fixation, dehydration, and embedding of biological specimens. Elsevier; Amsterdam: 1974. [Google Scholar]
- Hayat MA. Colloidal gold: principles, methods, and applications. Volume 1 – 3. Academic Press, Inc.; San Diego, New York, Berkeley, Boston, London, Sydney, Tokyo, Toronto: 1989. [Google Scholar]
- Hayat MA. Principles and techniques of electron microscopy: biological applications. Cambridge University Press; New York: 2000. [Google Scholar]


