

Abstract
Background
Measuring arterial stiffness using pulse wave velocity (PWV) has become an important tool to assess vascular function and cardiovascular mortality. For subject with hypertension, end-stage renal disease and diabetes, PWV has been shown to predict cardiovascular and all-cause mortality. We hypothesize that PWV would also predict mortality in subjects who have undergone kidney transplantation.
Methods
A cohort of 330 patients with renal transplantation was studied with a mean age at entry 51.4 ± 0.75 years. Mean follow-up was 3.8 years (± 0.7 years); 16 deaths occurred during follow-up. At entry, together with standard clinical and biochemical parameters, PWV was determined from pressure tracing over carotid and femoral arteries.
Results
With increasing PWV, there was a significant increase in age, systolic blood pressure and pulse pressure. In addition, subjects with higher PWV also exhibited more frequently the presence of coronary heart disease. On the basis of Cox analyses, PWV and systolic blood pressure emerged as predictors of all-cause mortality.
Conclusion
These results provide evidence that PWV is a strong predictor of all-cause mortality in the population of renal transplant recipients.
Keywords: Pulse Wave Velocity, Arterial Stiffness, Renal Transplantation, Mortality
Introduction
Measuring arterial stiffness has become a major tool for assessing arterial function and cardiovascular mortality [1]. In particular, pulse wave velocity (PWV) has been proposed to be a clinically useful stiffness marker due to its non-invasiveness and ease of use [2]. PWV not only reflects the overall atherosclerotic burden of the arterial tree but has also been shown to predict cardiovascular mortality in hypertension [3,4], end-stage renal disease [5,6], and diabetes mellitus [6,7].
Another population with high cardiovascular risk includes subjects who have undergone kidney transplantation. To date, only few studies have investigated arterial function in kidney transplant recipients, and little is known about the predictive value of PWV in this population. Therefore, we hypothesize that PWV may also predict mortality in this group of patients. In the present study, we evaluated the predictive value of PWV in 330 kidney transplant patients.
Material, methods and statistics
Study population
In this longitudinal study, 330 subjects with stable renal transplantation were recruited from our renal transplant outpatient clinic [8]. Height and weight were measured, and body mass index (BMI) was calculated as weight to height squared. Laboratory measurements were measured with commercially available kits in our central laboratory. The study was performed in accordance with the principles laid down in the Declaration of Helsinki.
Hemodynamic measurements
Measurements were performed in a quiet, temperature-controlled room after 10 minutes, in a supine position according to the recommendations for user procedures of clinical applications of arterial stiffness, task force III [9], using the SphygmoCor device (AtCor Medical, Sydney, Australia). Blood pressure and heart rate (mean of three readings) were measured with an automatic upper-arm oscillometric device (Omron 705IT, Omron Medizintechnik, Mannheim, Germany). Pulse pressure (PP) was calculated by subtracting diastolic (DBP) from systolic blood pressure (SBP).
Aortic pulse wave velocity (PWV) was calculated from sequentially recorded pressure waveforms of the carotid and femoral artery as reported previously by our group [10,11]. With a simultaneous ECG recording of the R-wave as reference, the integral software calculated the pulse wave transit time. Anatomical measurements of the distance between the carotid and femoral artery were made on the surface of the body. The distance between carotid artery recording site and the suprasternal notch was subtracted from the distance from the suprasternal notch over the umbilicus to the femoral artery recording site [12]. PWV [m × s-1] was calculated as ratio between the distance travelled by the pulse wave and pulse transmission time.
Statistical analysis
The outcome events studied was all-cause mortality. Survival curves were estimated by the Kaplan-Meier product-limit method. Prognostic factors of survival were identified by use of logistic regression analysis and the Cox proportional hazards regression model. The cohort was divided into 3 groups according to the PWV < 7.5 m/s in the lower third, between 7.5 and 10.0 in the second third, and > 10.0 in the upper third. Variables were considered to be prognostic when they were found to be statistically significant (P < 0.05) in the logistic regression or the Cox proportional hazards regression models of all-cause mortality.
P < 0.05 was considered statistically significant. Data are expressed as mean ± SD. Statistical analysis was performed using GraphPad Prism 4.0 for MS Windows (GraphPad Software, Inc., San Diego, CA, U.S.A.).
Results
The characteristics of the cohort population in total and according to tertiles of PWV are displayed in Table 1. With increasing PWV, there was a significant increase in age, systolic blood pressure and pulse pressure. In addition, subjects with higher PWV also exhibited more frequently the presence of coronary heart disease (Table 1).
Table 1.
Characteristics [mean ± SEM] of the study population at inclusion according to tertiles of PWV
| Parameter | Total (n = 330) |
PWV < 7.5 (n = 138) |
PWV > 7.5 < 10 (n = 99) |
PWV > 10 (n = 93) |
P, ANOVA |
|---|---|---|---|---|---|
| Age [years] | 51.4 ± 0.75 | 44.4 ± 12.9 | 51.6 ± 10.8 | 61.6 ± 10.7 | < 0.0001 |
| Gender (male/female) | 168/162 | 65/73 | 49/50 | 54/39 | 0.250 |
| Body mass index [kg/m2 ] | 25.3 ± 4.3 | 25.0 ± 4.5 | 25.8 ± 4.5 | 25.2 ± 3.6 | 0.366 |
| Hypertension | N = 298 | N = 120 | N = 98 | N = 91 | 0.076 |
| History of CHD | N = 79 | N = 18 | N = 26 | N = 35 | < 0.0001 |
| History of AOD | N = 26 | N = 5 | N = 10 | N = 11 | 0.082 |
| Cholesterol [mg/dl] | 213 ± 41 | 208 ± 46 | 218 ± 38 | 215 ± 36 | 0.247 |
| Triglycerides [mg/dl] | 187 ± 113 | 184 ± 109 | 194 ± 117 | 184 ± 115 | 0.262 |
| Glucose [mg/dl] | 108 ± 32 | 102 ± 31 | 108 ± 29 | 118 ± 36 | 0.0006 |
| Systolic blood pressure [mmHg] | 149 ± 20 | 142 ± 20 | 152 ± 20 | 157 ± 19 | < 0.0001 |
| Diastolic blood pressure [mmHg] | 83 ± 11 | 83 ± 11 | 83 ± 9 | 81 ± 18 | 0.372 |
| Pulse pressure [mmHg] | 67 ± 18 | 59 ± 15 | 69 ± 17 | 76 ± 18 | < 0.0001 |
| Heart rate [b.p.m.] | 67 ± 13 | 66 ± 12 | 68 ± 12 | 67 ± 15 | 0.473 |
| Pulse wave velocity [m/s] | 9.1 ± 3.3 | 6.2 ± 0.8 | 8.5 ± 0.8 | 13.1 ± 2.9 | < 0.0001 |
CHD, coronary heart disease; AOD, arterial occlusive disease.
Mean follow-up was 3.87 years (± 0.7 years); during this period, 16 deaths were recorded. According to the Cox analysis, the significant covariates retained by the model were PWV and SBP (Table 2). Figure 1 shows the probabilities of all-cause survival as a function of PWV values. Comparisons between survival curves were highly significant with better survival for those with lower PWV.
Table 2.
Proportional Hazards Regression Analysis of All-Cause Mortality
| Parameter | Regression Coefficient | SE | z Value | P |
|---|---|---|---|---|
| PWV | 0.066 | 0.024 | 2.704 | 0.0055 |
| Age | -0.006 | 0.006 | -1.038 | 0.3083 |
| SBP | -0.007 | 0.003 | -2.048 | 0.0406 |
| Glucose | -0.001 | 0.002 | -0.273 | 0.7846 |
| CHD | 0.138 | 0.152 | 0.912 | 0.3620 |
SBP, systolic blood pressure; CHD, coronary heart disease.
Figure 1.
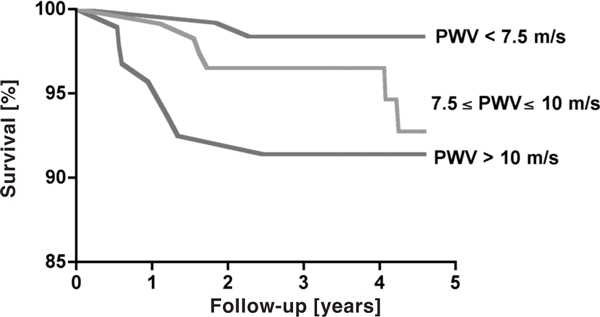
Probabilities of overall survival in study population according to level of PWV divided into tertiles. Comparisons between survival curves were statistically significant (P = 0.047).
Discussion
In the present study, we showed for the first time that PWV predicts all-cause mortaliy in renal transplant patients. We focused our analysis on all-cause mortality since only 16 deaths occurred during the mean follow-up time of 3.8 years. After renal transplantation, cardiovascular complications remain common, but a large number of patients also dies from infectious and tumoural diseases [13]. Therefore, it was unclear, whether PWV would predict mortality in this population. In the present study we could show that PWV predicts mortality in renal transplant patients even during a relatively short follow-up period of 3.8 years. These results are consistent with previous reports showing the strong predictive value of PWV in populations of hypertensives [3,4], patients with end-stage renal disease [5,6], and diabetes mellitus [6,7].
Hemodynamically, stiffening of the aortic tree results in characteristic changes of the blood pressure pattern [2]. Aortic stiffening leads to a rise of systolic and a fall of diastolic blood pressure resulting in a widening of the pulse pressure. Results from our study are consistent with such hemodynamic concept in that subjects with higher PWV also exhibited higher systolic blood pressure and pulse pressures as a consequence of arterial stiffening.
Several other studies have investigated stiffness markers in renal transplant patients. Bahous et al. followed up 106 transplant subjects, and found that tobacco consumption and acute renal rejection influence aortic stiffness as measured by PWV [14]. Two other studies have investigated the effect of renal transplantation on arterial stiffness, and demonstrated that renal transplantation improved PWV and augmentation index in subjects who underwent renal transplantation [15,16]. Recently, Schwenger et al. showed in a cohort of 76 kidney allograft patients that PWV, pulse pressure, and intima-media-thickness are independent determinants of the resistance index, a strong predictor of kidney allograft survival [17]. Our data on 330 renal transplant recipients extend these associations between stiffness markers, cardiovascular risk factors and renal disease to the predictive value of stiffness markes in this patient population.
In addition to PWV also systolic blood pressure predicted mortality. Hypertension in renal transplant recipients can originate from different sources including marginal renal function, use of immune suppressive drugs, and renal artery stenosis. Despite the inhomogeneous pathogenesis of arterial hypertension in renal transplant patients, this classical cardiovascular risk factor predicts mortality in renal transplant patients.
Clinical implication
The results of the present study show that the classical marker of arterial stiffness PWV predicts mortality in renal transplantation. Stiffness markers are increasingly used in population studies to evaluate cardiovascular morbidity and mortality. Our data suggest, that also in renal transplant subjects stiffness markers may be used as tools for the prediction of all-cause mortality. Even though it is very likely, further studies are required to evaluate the predictive value of PWV for cardiovascular mortality.
Conflict of interests/disclosure
The authors declare that they have no competing interests.
Acknowledgements
We would like to thank Petra Höhner for her help in recruiting patients. We would also like to thank Christa Sittartz for her technical assistance.
Sources of Funding
This study was supported, in part, by grants from the intramural research fund (IFORES) and the Jackstädt foundation.
References
- Laurent S, Cockcroft J, Van Bortel L, Boutouyrie P, Giannattasio C, Hayoz D. et al. Expert consensus document on arterial stiffness: methodological issues and clinical applications. Eur Heart J. 2006;27(21):2588–605. doi: 10.1093/eurheartj/ehl254. [DOI] [PubMed] [Google Scholar]
- Opazo Saez AM, Mitchell A, Philipp T, Nürnberger J. Arterial stiffness: a potential therapeutic target to reduce cardiovascular mortality. Curr Hypertens Rev. 2006;2(2):97–102. doi: 10.2174/157340206776877316. [DOI] [Google Scholar]
- Boutouyrie P, Tropeano AI, Asmar R, Gautier I, Benetos A, Lacolley P. et al. Aortic stiffness is an independent predictor of primary coronary events in hypertensive patients: a longitudinal study. Hypertension. 2002;39(1):10–5. doi: 10.1161/hy0102.099031. [DOI] [PubMed] [Google Scholar]
- Laurent S, Boutouyrie P, Asmar R, Gautier I, Laloux B, Guize L. et al. Aortic stiffness is an independent predictor of all-cause and cardiovascular mortality in hypertensive patients. Hypertension. 2001;37(5):1236–41. doi: 10.1161/01.hyp.37.5.1236. [DOI] [PubMed] [Google Scholar]
- Blacher J, Guerin AP, Pannier B, Marchais SJ, Safar ME, London GM. Impact of aortic stiffness on survival in end-stage renal disease. Circulation. 1999;99(18):2434–9. doi: 10.1161/01.cir.99.18.2434. [DOI] [PubMed] [Google Scholar]
- Shoji T, Emoto M, Shinohara K, Kakiya R, Tsujimoto Y, Kishimoto H. et al. Diabetes mellitus, aortic stiffness, and cardiovascular mortality in end-stage renal disease. J Am Soc Nephrol. 2001;12(10):2117–24. doi: 10.1681/ASN.V12102117. [DOI] [PubMed] [Google Scholar]
- Cruickshank K, Riste L, Anderson SG, Wright JS, Dunn G, Gosling RG. Aortic pulse-wave velocity and its relationship to mortality in diabetes and glucose intolerance: an integrated index of vascular function? Circulation. 2002;106(16):2085–90. doi: 10.1161/01.CIR.0000033824.02722.F7. [DOI] [PubMed] [Google Scholar]
- Opazo Saez A, Kos M, Witzke O, Kribben A, Nurnberger J. Effect of new-onset diabetes mellitus on arterial stiffness in renal transplantation. Transpl Int. 2008;21(10):930–5. doi: 10.1111/j.1432-2277.2008.00702.x. [DOI] [PubMed] [Google Scholar]
- Van Bortel LM, Duprez D, Starmans-Kool MJ, Safar ME, Giannattasio C, Cockcroft J. et al. Clinical applications of arterial stiffness, Task Force III: recommendations for user procedures. Am J Hypertens. 2002;15(5):445–52. doi: 10.1016/S0895-7061(01)02326-3. [DOI] [PubMed] [Google Scholar]
- Nurnberger J, Opazo Saez A, Dammer S, Mitchell A, Wenzel RR, Philipp T. et al. Left ventricular ejection time: a potential determinant of pulse wave velocity in young, healthy males. J Hypertens. 2003;21(11):2125–32. doi: 10.1097/00004872-200311000-00022. [DOI] [PubMed] [Google Scholar]
- Nurnberger J, Dammer S, Opazo Saez A, Philipp T, Schafers RF. Diastolic blood pressure is an important determinant of augmentation index and pulse wave velocity in young, healthy males. J Hum Hypertens. 2003;17(3):153–8. doi: 10.1038/sj.jhh.1001526. [DOI] [PubMed] [Google Scholar]
- Weber T, Ammer M, Rammer M, Adji A, O'Rourke MF, Wassertheurer S. et al. Noninvasive determination of carotid-femoral pulse wave velocity depends critically on assessment of travel distance: a comparison with invasive measurement. J Hypertens. 2009;27(8):1624–30. doi: 10.1097/HJH.0b013e32832cb04e. [DOI] [PubMed] [Google Scholar]
- Berthoux F, Mariat C. Cardiovascular death after renal transplantation remains the first cause despite significant quantitative and qualitative changes. Transplantation. 2010;89(7):851–7. doi: 10.1097/TP.0b013e3181caeead. [DOI] [PubMed] [Google Scholar]
- Bahous SA, Stephan A, Barakat W, Blacher J, Asmar R, Safar ME. Aortic pulse wave velocity in renal transplant patients. Kidney Int. 2004;66(4):1486–92. doi: 10.1111/j.1523-1755.2004.00912.x. [DOI] [PubMed] [Google Scholar]
- Covic A, Goldsmith DJ, Gusbeth-Tatomir P, Buhaescu I, Covic M. Successful renal transplantation decreases aortic stiffness and increases vascular reactivity in dialysis patients. Transplantation. 2003;76(11):1573–7. doi: 10.1097/01.TP.0000086343.32903.A8. [DOI] [PubMed] [Google Scholar]
- Zoungas S, Kerr PG, Chadban S, Muske C, Ristevski S, Atkins RC. et al. Arterial function after successful renal transplantation. Kidney Int. 2004;65(5):1882–9. doi: 10.1111/j.1523-1755.2004.00595.x. [DOI] [PubMed] [Google Scholar]
- Schwenger V, Keller T, Hofmann N, Hoffmann O, Sommerer C, Nahm AM. et al. Color Doppler indices of renal allografts depend on vascular stiffness of the transplant recipients. Am J Transplant. 2006;6(11):2721–4. doi: 10.1111/j.1600-6143.2006.01524.x. [DOI] [PubMed] [Google Scholar]