

Abstract
As invading species expand, they eventually encounter physical and biotic stressors that limit their spread. We examine latitudinal and climatic variation in physiological tolerance in one native and two invading populations of Drosophila subobscura. These flies are native to the Palearctic region, but invaded both South and North America around 1980 and spread rapidly across 15° of latitude on each continent. Invading flies rapidly evolved latitudinal clines in chromosome inversion frequencies and in wing size that parallel those of native populations in the Old World. Here we investigate whether flies on all three continents have evolved parallel clines in desiccation and starvation tolerance, such that flies in low-latitude regions (hot, dry) might have increased stress resistance. Starvation tolerance does not vary with latitude or climate on any continent. In contrast, desiccation tolerance varies clinally with latitude on all three continents, although not in parallel. In North American and Europe, desiccation tolerance is inversely related to latitude, as expected. But in South America, desiccation tolerance increases with latitude and is greatest in relatively cool and wet areas. Differences among continents in latitudinal patterns of interspecific-competition potentially influence clinal selection for physiological resistance, but no simple pattern is evident on these continents.
Keywords: cline, desiccation tolerance, invasive species, physiological tolerance, rapid evolution, starvation tolerance, stress resistance
Introduction
Invasive species are a growing ecological concern. As they spread into a new region, they inevitably encounter physical stresses, as well as novel biological interactions, that may slow or even limit further range expansion (Gaston 2003). Nevertheless, invaders having sufficient genetic variation can potentially adapt to these new stresses and, if so, will be able to resume range expansion. Invasive species that have recently colonized large areas encompassing diverse climates thus provide a special opportunity to evaluate the role of adaptation to physical stresses. If environmental stressors vary clinally with climate, then evolution of stress tolerance likely facilitates (or at least helps maintain) range expansion. But if stress tolerance is independent of climate, then invaders probably rely on behavioral adjustments that effectively ameliorate phenotypic selection (Huey et al. 2003) – or gene flow may be swamping local adaptation (Kirkpatrick and Barton 1997).
Many established species show clinal variation in stress tolerance, suggesting that purely behavioral alternations such as changes in diurnal activity patterns or microhabitat preferences may be insufficient to fully accommodate climatic gradients (Karan and Parkash 1998; Gaston 2003; Hoffmann et al. 2003b). But whether an invasive species will adapt to climatic gradients – and thus to continue to expand its range – is largely an open question (Hoffmann and Weeks 2007). Often invaders experience major genetic bottlenecks, and may adapt slowly because of the lost genetic variation (Hoffmann et al. 2003a; Magiafoglou and Hoffmann 2003). Moreover, geographic variation in the patterns of selection on other traits (genetically correlated with stress tolerance) might also affect evolutionary trajectories. For example, selection at low latitudes (or at warm temperatures in the lab) may lead to decreased body size; but decreased size might lead to reduced stress tolerance. In this case, direct selection at low latitude may promote increased stress tolerance, but indirect selection on size will lead to decreased stress tolerance. Therefore, whether one sees clinal variation in tolerance of stress – or even the direction of the variation – will depend on whether selection for increased tolerance dominates selection on body size.
Drosophila subobscura is a recently invasive species that is suitable for exploring these issues. This species is native to the Old World, where it ranges from North Africa to Scandinavia (Krimbas 1993). These flies invaded Chile in the late 1970s and experienced a severe bottleneck in the process: in fact, only ∼7–10 flies founded the South American population (Brncic et al. 1981; Rozas et al. 1990; Pascual et al. 2007). Nevertheless, this species quickly colonized a broad latitudinal range (Brncic et al. 1981; Prevosti et al. 1985). From Chile, a second propagule soon invaded North America (∼100–150 effective founders, Pascual et al. 2007) and quickly colonized the west coast (Beckenbach and Prevosti 1986).
This three-continent system provides remarkable opportunities to monitor rapid evolution on a broad geographic scale (Ayala et al. 1989). The native Old World populations offer an evolutionary baseline, as these flies have had millennia to adapt to climatic gradients. Moreover, the North and South American populations have been evolving in situ for only three decades and thus serve as replicates for monitoring both the speed and predictability of adaptation to novel environments (Ayala et al. 1989; Huey et al. 2000). Despite the bottleneck (above), D. subobscura quickly evolved latitudinal clines in chromosomal arrangements that are generally parallel in sign to those in the Old World (Prevosti et al. 1985; Beckenbach and Prevosti 1986; Balanyà et al. 2003). Within two decades, the New World flies evolved latitudinal clines in wing size that are remarkably similar to the Old World ones (Huey et al. 2000; Gilchrist et al. 2001, 2004), at least for females. Whether D. subobscura have also rapidly evolved clines in stress tolerance is unknown: that is the subject of our study here. We collected flies from multiple populations on all three continents, reared them in a common garden for several generations and then compared their tolerance to desiccation and to starvation.
Several previous studies have investigated geographic clines in physiological resistance in other Drosophila species (Karan et al. 1998; Robinson et al. 2000; Hoffmann et al. 2002; Anderson et al. 2003; Schmidt et al. 2005; Sorensen et al. 2005). These studies generally document that physiological tolerance of desiccation and starvation is highest in low-latitude populations, suggesting that selection on tolerance is partially independent of selection on body size. These previous studies do document physiological clines, but they provide limited insight on the issue of how fast such clines evolve, as the studied populations may have been evolving for thousands of years. In the case of Drosophila melanogaster, however, clines must have evolved within the past 100 years (Hoffmann and Weeks 2007); but whether they evolve much faster than that is unknown.
Materials and methods
Drosophila subobscura were collected in the field from Europe (April–May 1998), South America (November 1999) and North America (April-May 2002). The populations studied here are shown in Fig. 1 and location details are provided in Appendix 1. Details of the methods used to establish the lines are provided in Gilchrist et al. (2004). These experiments were undertaken approximately 1 year (<15 generations) after population cages were established by combining 20–25 isofemale lines in equal numbers. One population cage (24 cm × 14 cm × 12 cm) was maintained for each locale at ∼1000 adults on continuous, overlapping generations with larvae reared at low density on 14L:10D at 20°C.
Figure 1.
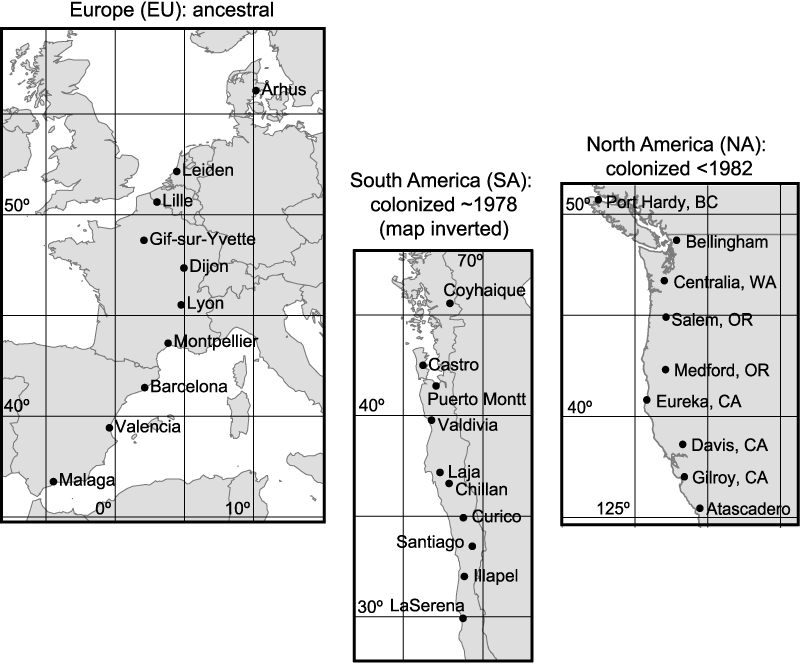
Maps of study populations aligned at 40° latitude, with South America inverted such that high-latitude populations are all at the top of the figure.
Desiccation tolerance
For each experimental block, flies were reared at controlled density (50 ± 5 eggs/vial) at 20°C (14L:10D). Within a few hours after flies enclosed, we separated males and females (under light CO2 anesthesia) and set up five vials (with yeasted media) of males and five vials of females, each with 10 flies per vial. When the flies were 3- to 5-days old, we transferred them into vials containing Drierite (a desiccant, separated from the flies by a foam stopper) and sealed with Parafilm. Thus, flies had no access to food or water. We then checked vials every 3 h and recorded the median time of death (LT50, lethal time to 50% mortality) for flies in each vial. We replicated the experiment in two blocks, such that each sex from each population was represented by 10 vials.
For a subset of three locales from ancestral Europe and three from invaded South America (Table 1), we desiccated 20 individuals of each sex per population in individual vials. We recorded wet mass at the start of desiccation and every 4 h for 40 h, noting the time of death to test for a relationship between body size and desiccation tolerance.
Table 1.
Regression slopes of ln time of death on ln wet mass for female and male Drosophila subosbscura from ancestral European and invasive South American populations.
| Sex | Continent | Location | Latitude | n | Slope | SE | t | P |
|---|---|---|---|---|---|---|---|---|
| Female | Europe | Malaga | 36.75 | 20 | 1.70 | 0.493 | 3.44 | 0.0007 |
| Dijon | 47.35 | 21 | 0.91 | 0.451 | 2.02 | 0.0447 | ||
| Arhus | 56.15 | 21 | 0.26 | 0.355 | 0.73 | 0.4648 | ||
| South America | La Serena | 29.92 | 17 | 1.90 | 0.516 | 3.69 | 0.0003 | |
| Chilan | 36.62 | 19 | 0.85 | 0.587 | 1.45 | 0.1486 | ||
| Coyhaique | 45.58 | 21 | 0.56 | 0.483 | 1.15 | 0.2501 | ||
| Male | Europe | Malaga | 36.75 | 20 | 1.29 | 0.544 | 2.38 | 0.0184 |
| Dijon | 47.35 | 19 | 0.41 | 0.878 | 0.46 | 0.6435 | ||
| Arhus | 56.15 | 19 | 1.52 | 0.432 | 3.52 | 0.0005 | ||
| South America | La Serena | 29.92 | 23 | 1.09 | 0.432 | 2.53 | 0.0122 | |
| Chilan | 36.62 | 21 | 0.61 | 0.511 | 1.19 | 0.2374 | ||
| Coyhaique | 45.58 | 19 | 1.01 | 0.464 | 2.18 | 0.0303 |
Significant results are indicated in bold.
Starvation tolerance
Flies were reared as above and maintained until the adults were 3–5 days of age at 20°C (12:12 L:D). For each population, we separated males and females (as above) and set up six vials (with yeasted media) of males and six vials of females (∼10 flies per vial) in each of two blocks. The next day, we transferred the flies into vials with moist sponges, but no media. We then checked the vials every 6 h (0600, 1200, 1800 and 2400 h) and then recorded the median time of death of flies (LT50, lethal time to 50% mortality) in each vial. We replicated the experiment twice, such that each sex and population was represented by 24 values. We later dried the flies and computed an average dry mass.
Weather data
Weather data were gathered using the NOAA Global Daily Record (http://cdo.ncdc.noaa.gov/CDO/cdo) for our sites, or sites as similar in latitude, longitude and elevation as possible, over years 1977–1991. For each site, we computed the average minimum and maximum temperatures and the average daily precipitation for each of the four seasons. We selected these variables because other instrument values, such as relative humidity, were not available for many of the sites. We used the inverse of De Martonne’s (1925) aridity index, 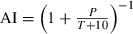 (so that higher scores mean greater aridity), where P is the total precipitation (cm, Fig. 2A.) over the period of interest and T is the mean maximum daily temperature (°C) during that period. An AI value of 1 means no precipitation fell during the period of interest. We focus on the summer AI, as summer is the driest season at most sites. De Martonne’s index combines the available temperature and precipitation data in a single variable that varies linearly with latitude (Fig. 2B). In contrast, precipitation data alone was best described by a cubic polynomial (Fig. 2A). The summer AI decreases in parallel (heterogeneity of slopes: F2,25 = 0.32, P = 0.731) with latitude on all three continents (Fig. 2B.), with North America being more arid than Europe, which is more arid than South America (ANCOVA: F2,27 = 6.04, P = 0.0068). Note that the highest latitude sites in Europe and South America are somewhat more arid than the next highest sites. Excluding those sites made no significant difference in any of the analyses presented below; therefore we elected to retain them.
Figure 2.
Geographic variation in (A) summer precipitation and (B) aridity index for sites in Europe (circles), South America (downward triangles) and North America (upward triangles).
Statistical analysis
Clinal variation in desiccation tolerance was analyzed using mixed linear models of the LT50 score (square-root transformed to stabilize the variance and improve normality). We treated sex and continent as fixed factors, latitude or the AI as covariates, and population and block as random factors. Examination of desiccation tolerance as a function of the AI effectively controls for variation in the latitudinal range on each continent. Using the individual body mass and time to death data, we tested for clinal, continental and sex differences using mixed linear models, with population as a random factor. In these and subsequent analyses, we focus primarily on comparing slopes among experimental blocks. What we are interested in is whether or not clinal patterns are consistent across blocks, indicating relative differences among the populations in desiccation tolerance. In effect, we are using the multiple measures within a continent as internal controls. Although we do analyze the intercepts among populations through analysis of covariance, we cannot rule out the possibility that significant differences were due to some unmeasured aspect of the test conditions among replicate blocks. Logistical considerations prevented simultaneous assays of all three continents.
Clinal variation in starvation tolerance was analyzed using similar mixed linear models of the LT50 score (square-root transformed to stabilize the variance and improve normality). We treated sex and continent as fixed factors, latitude or weather statistics as covariates, and population and block as random factors. We report mean ± 1 SE for all summary statistics. All statistics were carried out using R 2.51 (R Development Core Team 2006).
Results
Desiccation tolerance: clinal patterns
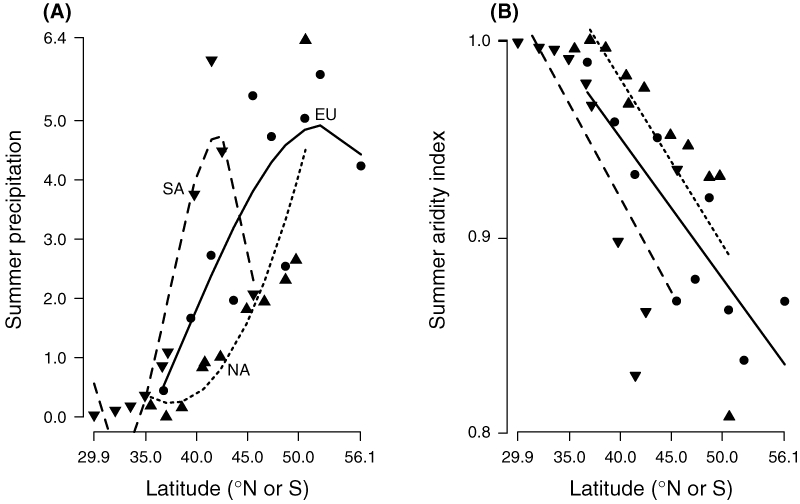
Significant clinal variation in desiccation tolerance, as measured by the LT50, was observed for females from all continents. Both ancestral European (slope = −0.042 ± 0.0088, t96 = −4.748, P = 0.000015) and invasive North American females (slope = −0.019 ± 0.0096, t108 = −2.034, P = 0.047) show negative latitudinal clines in desiccation tolerance (Fig. 3). South American females, however, show a trend toward a positive cline (slope = 0.020 ± 0.0108, t96 = 1.832, P = 0.0694). Males show nonsignificant, but parallel (to female patterns), clinal variation for each continent (Fig. 3). For females, but not males, there is a significant heterogeneity of slopes among the continents (females: F55,2 = 9.85, P = 0.0002; males: F2,55 = 1.1632, P = 0.3201). Although the heterogeneity among females precludes an analysis of covariance, it is clear that desiccation tolerance is generally higher at any given latitude in the invasive North American populations than in the ancestral Europeans for both sexes. Within sites, females have a much higher desiccation tolerance than males.
Figure 3.
Clinal variation in the LT50 of desiccation time across latitudes for females (solid symbols) and males (open symbols) from Europe, South and North America. Regression lines are shown with ±1 SE curves.
Desiccation tolerance increased with the summer AI in both ancestral Europe and North America. A second-order polynomial regression provided a better fit to the data, suggesting that increased desiccation tolerance only evolved above a certain aridity threshold (Fig. 4). Both females and males from Europe show a significant linear increase in desiccation tolerance with increasing aridity (females: 7.12 ± 1.578, t96 = 4.51, P = 0.0000079; males: 3.71 ± 1.579, t96 = 2.35, P = 0.019). North American flies show a trend toward aridity clines in the same direction (females: 2.57 ± 1.4220, t108 = 1.81, P = 0.071; males: 2.37 ± 1.422, t108 = 1.66, P = 0.097). South American flies, on the other hand, show no significant tolerance pattern with aridity (females: −1.44 ± 1.286, t96 = −1.12, P = 0.26; males: 0.064 ± 1.283, t96 = 0.05, P = 0.96).
Figure 4.
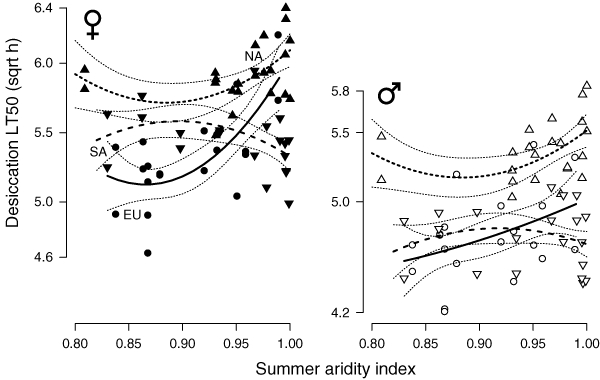
Variation in desiccation tolerance as a function of the aridity index for females and males from Europe, South and North America. Regression lines are shown with ±1 SE curves.
Body size and desiccation tolerance
Two approaches were used to assess whether or not body mass contributed to desiccation tolerance. We first regressed the mean desiccation index for each population in each block on mean wet body mass from our previous studies (1–2 years prior to this study) to test the hypothesis that populations with a larger mean body size might have higher desiccation tolerance solely due to size. None of the slopes was significantly different from zero (Fig. 5, P-values ranging from 0.13 to 0.68), meaning that we could not reject the null hypothesis that body mass did not predict desiccation tolerance.
Figure 5.

Variation in mean desiccation tolerance as a function of mean mass for males and females from populations in Europe, South and North America. Regression lines are shown with ±1 SE curves.
We also examined changes in body mass during dessication for individuals sampled from three ancestral European and three invasive South American populations to see if body mass influenced desiccation tolerance at an individual level and to test for differences among populations and continents. In this study, the median time to death showed little latitudinal variation (P = 0.613), but was strongly and positively associated with the loss of body mass within some populations (Table 1). Large females from low-latitude populations in both the ancestral and invasive populations were the most desiccation tolerant (Table 1), whereas males from both low- and high-latitude populations showed a significant positive relationship between body size and desiccation tolerance (Table 1).
Starvation tolerance: clinal patterns
No significant clines are apparent for starvation tolerance except for North American males (Fig. 6; slope ± SE: −0.021 ± 0.0089, t163 = −3.237, P = 0.0162). Females had significantly higher starvation tolerance than males. Overall, the invasive North American females appear to be much more starvation tolerant than native European or invasive South American females (Fig. 6). There is no significant linear relationship between average wet mass and starvation LT50 within continents for either sex (all P > 0.11).
Figure 6.
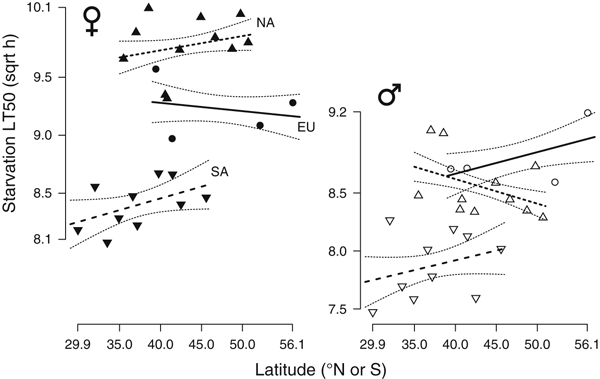
Geographic variation in starvation tolerance for females and males from Europe, South and North America. Regression lines are shown with ±1 SE curves.
Discussion
A central question in invasion biology is whether or not one can predict the evolutionary responses of an invasive population to climatic gradients. Contemporary evolution has been observed in many invasive species with diverse life histories (Stockwell et al. 2003; Huey et al. 2005; Carroll et al. 2007), suggesting that one might expect rapid evolution following a shift in environments. Ancestral and invasive clinal populations offer a unique opportunity to examine evolving patterns of morphological (Gilchrist et al. 2001, 2004), physiological (Hoffmann et al. 2002) and genetic variation (Balanyà et al. 2003) across geographic gradients. Moreover, comparison of ancestral and invasive clines of known divergence time can yield insights on the minimal rates of evolution possible for a given system (Gilchrist et al. 2004; Hoffmann and Weeks 2007). The dual introduction of D. subobscura into South and North America sometime around 1980 presents an exceptional opportunity to compare evolutionary trajectories.
Ancestral European populations show a clear clinal pattern in desiccation tolerance (Figs 3 and 4), with especially high values for females from lower, more arid populations as predicted by the adaptive hypothesis. North American populations show a similar clinal pattern and a significantly higher overall level of desiccation tolerance (Figs 3 and 4). South America, however, shows a nonsignificant increase in desiccation tolerance with latitude (Fig. 3) and a decrease with aridity (Fig. 4), contrary to the hypothesis of adaptation. One possible explanation is a genetic bottleneck that restricted the genetic variation available to mount an adaptive response. Indeed, Hoffmann and colleagues (Hoffmann et al. 2003a; Kellermann et al. 2006) suggested that low genetic variation might be an explanation for the lack of a desiccation cline in Australian Drosophila birchii. For the introduced populations of D. subobscura, South America was probably founded first, by 4–12 flies, with a large propagule (100+) transferred to North America within 5 years (Pascual et al. 2007). The New World populations have undergone a reduction in genetic diversity, with South and North America today sharing only 18 of the 90 or so chromosomal arrangements present in ancestral Europe, yet parallel clinal patterns have evolved within a few generations on all three continents (Prevosti et al. 1988; Balanyà et al. 2003). In spite of the loss of many chromosome arrangements, allozyme polymorphisms are not dramatically reduced in the New World (Balanyà et al. 1994). The loss of the high levels of genetic variation present in European populations did not dramatically reduce the adaptive potential of the colonists, perhaps due to the rapid expansion of the New World populations. Furthermore, if there was a significant bottleneck, it appears to have occurred during the founding of the New World populations, not in the transfer between the Americas (Pascual et al. 2007). The genetic similarity of the two New World populations coupled with the similar climatic regimes offers no clue as to why one continent would evolve what looks like an adaptive pattern of desiccation tolerance while the other did not.
Previous studies of other traits suggest that genetic constraints have not severely limited adaptive evolution in D. subobscura in the New World. Chromosome arrangement clines evolved within a few years of the founding in both South and North America (Balanyà et al. 2003) and, consistent with a high adaptive potential, the clinal patterns on all three continents have shifted in parallel toward chromosomal patterns indicative of more equatorial habitats, suggesting a significant evolutionary response to climate change (Balanyà et al. 2006). Clines of increasing body size with latitude have been known in the Old World since the 1950s (Prevosti 1955; Misra and Reeve 1964; Pegueroles et al. 1995), and parallel clines in female wing size had evolved in the New World within two decades of the introduction (Huey et al. 2000; Gilchrist et al. 2004). The adaptive significant of these size clines remains elusive (Santos et al. 2005); however, there is a general trend (Bergmann’s rule) among animals in general (Atkinson 1994; Ashton et al. 2000; Ashton and Feldman 2003; but see Blanckenhorn and Demont 2004) to increase in body size at high latitudes.
These parallel changes superficially suggest that observations of clinal patterns in native populations might yield a good prediction of evolving patterns in invasive populations; however, a closer look at the details suggests otherwise. Although the clinal patterns in chromosomal arrangements of D. subobscura are similar in sign on all three continents, the slopes in the New World are generally shallower and show little sign of evolving steeper slopes like their European conspecifics (Balanyà et al. 2003). Although female wing size forms virtually identical clinal patterns on all three continents, parallel male clines have not evolved in the New World (Gilchrist et al. 2004). In other drosophilids, the genetic correlation between male and female size is nearly one; however, the observed response in one sex to selection on the other sex lags behind predictions made by quantitative genetics (Reeve and Fairbairn 1996), suggesting that the contrast in female and male clinal patterns might not be unexpected. Larger wings could evolve either by increasing cell size or by increasing cell number. Whereas European and South America wings generally increase in cell number toward the poles, North American wings increase in cell size (Calboli et al. 2003). This suggests fundamentally different proximal processes acting in the two colonizing populations.
One particularly striking aspect of desiccation tolerance is its potential relationship with body size. All else being equal, organisms with a larger body size will have a reduced surface area to volume ratio and a potential advantage in desiccating environments. The typical clinal increase in wing size seems antithetical. The cool high-latitude populations where the largest size is obtained are the least arid environments (Fig. 2) in the geographic range of Drosophila subosbscura, with significantly higher summer precipitation than more equatorial populations (with the exception of Coyhaique in South America). If we look at clinal variation in wet body mass, however, we find a quite different story than the clear clinal patterns in wing size: mass does not scale with latitude in either ancestral Europe or invasive North America; only in South America is there any sign of a relationship (Gilchrist and Huey 2004). Yet when we examined individual flies within high-, mid-, and low-latitude populations in ancestral Europe and South America, we found a strong relationship, particularly among the low-latitude populations on both continents, for larger individuals to have higher desiccation tolerance. This suggests that selection on desiccation tolerance may, in fact, favor larger body mass at lower latitude; however, this is opposed by some other selective factor favoring smaller body or wing size in the same habitats. Several studies (Azevedo et al. 1998; Morin et al. 1999; Gilchrist and Huey 2004) have documented clinal variation in wing loading, the ratio of body mass to wing size, with populations from low latitudes generally having higher wing loadings than those from high latitudes, largely due to increases in wing size at high latitudes. Relatively low wing loading confers a flight performance advantage in cool temperatures (Roberts et al. 2001); however, the advantage of higher wing loading in warmer, low-latitude populations is unknown. Australian D. melanogaster with relatively short wings and larger thoraxes appear to have an advantage in local foraging, whereas those with longer wings and smaller thoraxes are stronger dispersers (Hoffmann et al. 2007); whether or not this offers insight into the forces generating clinal patterns is less certain. More relevant to this paper is the observation that some key traits are under relatively complex selection regimes that may vary among clines, even though the clines share similar climatic gradients.
We found no clinal variation in starvation tolerance. Moreover, the larger flies from high latitudes were not significantly more starvation tolerant than low-latitude flies; in fact no significant relationship between body mass and starvation tolerance was found within any continent. One might predict that the abundance of food resources would be inversely proportional to the aridity of a habitat, as primary productivity is generally low in arid regions.
In this study, we have focused on the clinal patterns (slopes) within and among continents to a greater degree than the overall differences in desiccation tolerance (y intercepts) among continents because of concerns about laboratory adaptation. Studies of clinal variation in stress tolerance in D. melanogaster from Australia suggest a relatively rapid adaptation to laboratory conditions (Hoffmann et al. 2001), resulting in a reduced LT50 in starvation and desiccation tolerance over the course of a few generations. Other studies show an increase in starvation or desiccation tolerance (Bharathi et al. 2003; Griffiths et al. 2005). We acknowledge that some laboratory adaptation may have occurred in our D. subobscura lines; however, within a continent, all populations were established at the same time and, among continents, the number of generations in the laboratory was similar in all experiments, such that one might expect parallel changes among populations on the various continents. Our previous studies of wing and body size variation in D. subobscura (Huey et al. 2000; Gilchrist and Huey 2004; Gilchrist et al. 2004) show clinal variation persisting for at least 1 year; clines in wing size are readily detectable after 3 years in culture (unpublished data).
Even with this caveat, there is a striking pattern: D. subobscura from the invasive North American populations have much higher desiccation and starvation tolerance than those from Europe and South America, although the precipitation patterns and aridity indices generally overlap with the range in ancestral Europe. We speculate that the variation in stress tolerance among the continents may be related to biotic factors. In Europe, there are no other obscura-group competitors in the more arid, low-latitude populations. Likewise in South America, there are no other obscura-group flies, and interspecific competition with other dipterans over much of the year is relatively light (Budnik and Brncic 1983; Ricci and Budnik 1984). In North America, however, D. subobscura’s range overlaps with several obscura-group species, and competition with Drosophilia pseudoobscura, particularly in the warmer, dryer low-latitude populations, is probably intense (Pascual et al. 1993). Laboratory studies find that under warmer conditions, D. subobscura is competitively inferior to D. pseudoobscura (Orengo and Prevosti 1994; Pascual et al. 1998). This suggests that low-latitude North American populations of D. subobscura may regularly be forced into marginal habitat by D. pseudoobscura (M. Noor, pers. comm.), potentially placing these animals under strong selection for desiccation and starvation tolerance. The extensive gene flow among D. subobscura populations (Pascual et al. 2001, 2007) would spread alleles favoring higher desiccation and starvation tolerance among populations within North America. Unfortunately, little is known about the temporal dynamics of the invasion on either continent other than that the South American populations colonized most of their current range within 3 years after their discovery in Puerto Montt, Chile (Ayala et al. 1989).
In this paper, we document the rapid evolution of stress tolerance along a latitudinal cline in introduced North American D. subobscura that closely parallels the clinal variation in ancestral Europe. South American populations with a similar introduction history, however, do not show a similar pattern of clinal variation. In contrast, previous studies of wing size clines demonstrated remarkably parallel patterns on all three continents, especially among females. The difference is striking suggesting that, even under similar climatic gradients in native and invaded habitats, parallel patterns of stress tolerance may not evolve. This ‘grand experiment in evolution’ (Ayala et al. 1989) suggests that, although some aspects of the physical environment may select on traits in a relatively predictable fashion across multiple introduced populations, local factors including competitors and other biotic modifiers may exert an influence on aspects of stress tolerance that cannot be anticipated. Indeed, changes in clinal temperature and precipitation patterns that are occurring as a result of greenhouse warming are clearly exerting selection on stress tolerance in this and other species. This study and genetical studies on D. subobscura (e.g. Balanyà et al. 2006) show that some degree of contemporary adaptation to climate change is possible; whether or not it will be enough to maintain viable populations in the years ahead is not known.
Acknowledgments
This research has been supported by the National Science Foundation grants DEB0242313 and EF0328594 (GWG), DEB9981598 (RBH), DEB9629822 (RBH & GWG) and a Jeffress Foundation Research Grant (GWG). We thank three anonymous reviewers for their thoughtful comments that have improved this paper.
Collecting sites, latitudes and longitudes (decimal degrees) and altitudes (m above sea level)
| Population | Latitude | Longitude | Altitude |
|---|---|---|---|
| Europe | |||
| Århus, DK | 56.15 | 10.22 | 0 |
| Leiden, ND | 52.15 | 4.50 | −1 |
| Lille, FR | 50.63 | 3.07 | 24 |
| Gif-sur-Yvette, FR | 48.73 | 2.13 | 127 |
| Dijon, FR | 47.35 | 5.02 | 235 |
| Lyon, FR | 45.52 | 4.83 | 260 |
| Monpellier, FR | 43.63 | 3.88 | 18 |
| Barcelona, SP | 41.42 | 2.18 | 0 |
| Valencia, SP | 39.43 | −0.37 | 7 |
| Malaga, SP | 36.75 | −4.42 | 0 |
| North America | |||
| Port Hardy, BC | 50.70 | −127.42 | 24 |
| Peachland, BC | 49.77 | −119.73 | 342 |
| Bellingham, WA | 48.74 | −122.47 | 30 |
| Centralia, WA | 46.66 | −122.97 | 58 |
| Salem, OR | 44.92 | −123.02 | 47 |
| Medford, OR | 42.34 | −122.85 | 117 |
| Eureka, CA | 40.80 | −124.16 | 13 |
| Redding, CA | 40.57 | −122.36 | 170 |
| Davis, CA | 38.55 | −121.74 | 15 |
| Gilroy, CA | 37.01 | −121.58 | 61 |
| Atascadero, CA | 35.49 | −120.69 | 268 |
| South America | |||
| Coyhaique, CH | 45.58 | −72.07 | 302 |
| Castro, CH | 42.50 | −73.77 | 0 |
| Puerto_Montt, CH | 41.47 | −72.94 | 0 |
| Valdivia, CH | 39.77 | −73.23 | 4 |
| Laja, CH | 37.17 | −72.70 | 49 |
| Chillan, CH | 36.62 | −72.12 | 129 |
| Curico, CH | 34.92 | −71.23 | 214 |
| Santiago, CH | 33.50 | −70.67 | 521 |
| Illapel, CH | 32.00 | −71.17 | 388 |
| La Serena, CH | 29.92 | −71.25 | 28 |
Literature cited
- Anderson AR, Collinge JE, Hoffmann AA, Kellett M, McKechnie SW. Thermal tolerance trade-offs associated with the right arm of chromosome 3 and marked by the hsr-omega gene in Drosophila melanogaster. Heredity. 2003;90:194–202. doi: 10.1038/sj.hdy.6800220. [DOI] [PubMed] [Google Scholar]
- Ashton KG, Feldman CR. Bergmann’s rule in nonavian reptiles: turtles follow it, lizards and snakes reverse it. Evolution. 2003;57:1151–1163. doi: 10.1111/j.0014-3820.2003.tb00324.x. [DOI] [PubMed] [Google Scholar]
- Ashton KG, Tracy MC, De Queiroz A. Is Bergmann’s rule valid for mammals? American Naturalist. 2000;156:390–415. doi: 10.1086/303400. [DOI] [PubMed] [Google Scholar]
- Atkinson D. Temperature and organism size – a biological law for ectotherms? Advances in Ecological Research. 1994;25:1–58. [Google Scholar]
- Ayala FJ, Serra L, Prevosti A. A grand experiment in evolution: the Drosophila subobscura colonization of the Americas. Genome. 1989;31:246–255. [Google Scholar]
- Azevedo RBR, James AC, McCabe J, Partridge L. Latitudinal variation of wing:thorax size ratio and wing-apsect ratio in Drosophila melanogaster. Evolution. 1998;52:1353–1362. doi: 10.1111/j.1558-5646.1998.tb02017.x. [DOI] [PubMed] [Google Scholar]
- Balanyà J, Segarra C, Prevosti A, Serra L. Colonization of America by Drosophila subobscura: the founder event and a rapid expansion. Journal of Heredity. 1994;85:427–432. doi: 10.1093/oxfordjournals.jhered.a111496. [DOI] [PubMed] [Google Scholar]
- Balanyà J, Serra L, Gilchrist GW, Huey RB, Pascual M, Mestres F, Sole E. Evolutionary pace of chromosomal polymorphism in colonizing populations of Drosophila subobscura: an evolutionary time series. Evolution. 2003;57:1837–1845. doi: 10.1111/j.0014-3820.2003.tb00591.x. [DOI] [PubMed] [Google Scholar]
- Balanyà J, Oller JM, Huey RB, Gilchrist GW, Serra L. Global genetic change tracks global climate warming in Drosophila subobscura. Science. 2006;313:1773–1775. doi: 10.1126/science.1131002. [DOI] [PubMed] [Google Scholar]
- Beckenbach AT, Prevosti A. Colonization of North America by the European species, Drosophila subobscura and D. ambigua. American Midland Naturalist. 1986;115:10–18. [Google Scholar]
- Bharathi NS, Prasad NG, Shakarad M, Joshi A. Variation in adult life history and stress resistance across five species of Drosophila. Journal of Genetics. 2003;82:191–205. doi: 10.1007/BF02715818. [DOI] [PubMed] [Google Scholar]
- Blanckenhorn WU, Demont M. Bergmann and converse Bergmann latitudinal clines in arthropods: two ends of a continuum? Integrative and Comparative Biology. 2004;44:413–424. doi: 10.1093/icb/44.6.413. [DOI] [PubMed] [Google Scholar]
- Brncic D, Prevosti A, Budnik M, Monclus M, Ocaña J. Colonization of Drosophila subobscura in Chile. I. First population and cytogenetic studies. Genetica. 1981;56:3–9. [Google Scholar]
- Budnik M, Brncic D. Preadult competition between colonizing populations of Drosophila subobscura and established populations of Drosophila simulans in Chile. Oecologia (Berlin) 1983;58:137–140. doi: 10.1007/BF00384554. [DOI] [PubMed] [Google Scholar]
- Calboli FCF, Gilchrist GW, Partridge L. Different cell size and cell number contribution in two newly established and one ancient body size cline of Drosophila subobscura. Evolution. 2003;57:566–573. doi: 10.1111/j.0014-3820.2003.tb01548.x. [DOI] [PubMed] [Google Scholar]
- Carroll SP, Hendry AP, Reznick DN, Fox CW. Evolution on ecological time-scales. Functional Ecology. 2007;21:387–393. [Google Scholar]
- De Martonne E. Traité de Géographie Physique. Paris: Armand Colin; 1925. [Google Scholar]
- Gaston KJ. The Structure and Dynamics of Geographic Ranges. Oxford: Oxford University Press; 2003. [Google Scholar]
- Gilchrist GW, Huey RB. Plastic and genetic variation in wing loading as a function of temperature within and among parallel clines in Drosophila subobscura. Integrative and Comparative Biology. 2004;44:461–470. doi: 10.1093/icb/44.6.461. [DOI] [PubMed] [Google Scholar]
- Gilchrist GW, Huey RB, Serra L. Rapid evolution of wing size clines in Drosophila subobscura. Genetica. 2001;112–113:273–286. [PubMed] [Google Scholar]
- Gilchrist GW, Huey RB, Balanyá J, Pascual M, Serra L. A time series of evolution in action: a latitudinal cline in wing size In South American Drosophila subobscura. Evolution. 2004;58:768–780. doi: 10.1111/j.0014-3820.2004.tb00410.x. [DOI] [PubMed] [Google Scholar]
- Griffiths JA, Schiffer M, Hoffmann AA. Clinal variation and laboratory adaptation in the rainforest species Drosophila birchii for stress resistance, wing size, wing shape and development time. Journal of Evolutionary Biology. 2005;18:213–222. doi: 10.1111/j.1420-9101.2004.00782.x. [DOI] [PubMed] [Google Scholar]
- Hoffmann AA, Weeks AR. Climatic selection on genes and traits after a 100 year-old invasion: a critical look at the temperate-tropical clines in Drosophila melanogaster from eastern Australia. Genetica. 2007;129:133–147. doi: 10.1007/s10709-006-9010-z. [DOI] [PubMed] [Google Scholar]
- Hoffmann AA, Hallas R, Sinclair C, Partridge L. Rapid loss of stress resistance in Drosophila melanogaster under adaptation to laboratory culture. Evolution. 2001;55:436–438. doi: 10.1111/j.0014-3820.2001.tb01305.x. [DOI] [PubMed] [Google Scholar]
- Hoffmann AA, Anderson A, Hallas R. Opposing clines for high and low temperature resistance in Drosophila melanogaster. Ecology Letters. 2002;5:614–618. [Google Scholar]
- Hoffmann AA, Hallas RJ, Dean JA, Schiffer M. Low potential for climatic stress adaptation in a rainforest Drosophila species. Science. 2003a;301:100–102. doi: 10.1126/science.1084296. [DOI] [PubMed] [Google Scholar]
- Hoffmann AA, Sørensen JG, Loeschcke V. Adaptation of Drosophila to temperature extremes: bringing together quantitative and molecular approaches. Journal of Thermal Biology. 2003b;28:175–216. [Google Scholar]
- Hoffmann AA, Ratna E, Sgro CM, Barton M, Blacket M, Hallas R, De Garis S, et al. Antagonistic selection between adult thorax and wing size in field released Drosophila melanogaster independent of thermal conditions. Journal of Evolutionary Biology. 2007;20:2219–2227. doi: 10.1111/j.1420-9101.2007.01422.x. [DOI] [PubMed] [Google Scholar]
- Huey RB, Gilchrist GW, Carlson ML, Berrigan D, Serra L. Rapid evolution of a geographic cline in size in an introduced fly. Science. 2000;287:308–309. doi: 10.1126/science.287.5451.308. [DOI] [PubMed] [Google Scholar]
- Huey RB, Hertz PE, Sinervo B. Behavioral drive versus behavioral inertia in evolution: a null model approach. American Naturalist. 2003;161:357–366. doi: 10.1086/346135. [DOI] [PubMed] [Google Scholar]
- Huey RB, Gilchrist GW, Hendry AP. Using invasive species to study evolution. In: Sax DF, Gaines SD, Stachowicz JJ, editors. Species Invasions: Insights into Ecology, Evolution, and Biogeography. Sunderland, MA: Sinauer Associates; 2005. pp. 139–164. [Google Scholar]
- Karan D, Parkash R. Desiccation tolerance and starvation resistance exhibit opposite latitudinal clines in Drosophila kikkawai. Ecological Entomology. 1998;23:391–396. [Google Scholar]
- Karan D, Dahiya N, Munjal AK, Gibert P, Moreteau B, Parkash R, David JR. Desiccation and starvation tolerance of adult Drosophila: opposite latitudinal clines in natural populations of three different species. Evolution. 1998;52:825–831. doi: 10.1111/j.1558-5646.1998.tb03706.x. [DOI] [PubMed] [Google Scholar]
- Kellermann VM, Van Heerwaarden B, Hoffmann AA, Sgro CM. Very low additive genetic variance and evolutionary potential in multiple populations of two rainforest Drosophila species. Evolution. 2006;60:1104–1108. doi: 10.1554/05-710.1. [DOI] [PubMed] [Google Scholar]
- Kirkpatrick M, Barton NH. Evolution of a species’ range. American Naturalist. 1997;150:1–23. doi: 10.1086/286054. [DOI] [PubMed] [Google Scholar]
- Krimbas CB. Drosophila Subobscura: Biology, Genetics, and Inversion Polymorphism. Hamburg: Verlag Dr Kovac; 1993. [Google Scholar]
- Magiafoglou A, Hoffmann A. Thermal adaptation in Drosophila serrata under conditions linked to its southern border: unexpected patterns from laboratory selection suggest limited evolutionary potential. Journal of Genetics J. Genet. 2003;82:179–189. doi: 10.1007/BF02715817. [DOI] [PubMed] [Google Scholar]
- Misra RK, Reeve ECR. Clines in body dimensions in populations of Drosophila subobscura. Genetical Research, Cambridge. 1964;5:240–256. [Google Scholar]
- Morin JP, Moreteau B, Petavy G, David JR. Divergence of reaction norms of size characters between tropical and temperate populations of Drosophila melanogaster and D. simulans. Journal of Evolutionary Biology. 1999;12:329–339. [Google Scholar]
- Orengo DJ, Prevosti A. Preadult competition between Drosophila subobscura and Drosophila pseudoobscura. Zeitschrift fuer Zoologische Systematik und Evolutionsforschung. 1994;32:44–50. [Google Scholar]
- Pascual M, Ayala FJ, Prevosti A, Serra L. Colonization of North America by Drosophila subobscura: ecological analysis of three communities of drosophilids in California. Zeitschrift fuer Zoologische Systematik und Evolutionsforschung. 1993;31:216–226. [Google Scholar]
- Pascual M, Serra L, Ayala FJ. Interspecific laboratory competition of the recently sympatric species Drosophila subobscura and Drosophila pseudoobscura. Evolution. 1998;52:269–274. doi: 10.1111/j.1558-5646.1998.tb05162.x. [DOI] [PubMed] [Google Scholar]
- Pascual M, Aquadro CF, Soto V, Serra L. Microsatellite variation in colonizing and palearctic populations of Drosophila subobscura. Molecular Biology and Evolution. 2001;18:731–740. doi: 10.1093/oxfordjournals.molbev.a003855. [DOI] [PubMed] [Google Scholar]
- Pascual M, Chapuis MP, Mestres F, Balanya J, Huey RB, Gilchrist GW, Serra L, et al. Introduction history of Drosophila subobscura in the New World: a microsatellite-based survey using ABC methods. Molecular Ecology. 2007;16:3069–3083. doi: 10.1111/j.1365-294X.2007.03336.x. [DOI] [PubMed] [Google Scholar]
- Pegueroles G, Papaceit M, Quintana A, Guillén A, Prevosti A, Serra L. An experimental study of evolution in progress: clines for quantitative traits in colonizing and Palearctic populations of Drosophila. Evolutionary Ecology. 1995;9:453–465. [Google Scholar]
- Prevosti A. Geographic variability in quantitative traits in populations of Drosophila subobscura. Cold Spring Harbor Symposia on Quantitative Biology. 1955;20:294–298. doi: 10.1101/sqb.1955.020.01.028. [DOI] [PubMed] [Google Scholar]
- Prevosti A, Serra L, Ribo G, Aguade M, Sagarra E, Monclus M, Garcia MP. The colonization of Drosophila subobscura in Chile. II. Clines in the chromosomal arrangements. Evolution. 1985;39:838–844. doi: 10.1111/j.1558-5646.1985.tb00425.x. [DOI] [PubMed] [Google Scholar]
- Prevosti A, Ribo G, Serra L, Aguade M, Balañà J, Monclus M, Mestres F. Colonization of America by Drosophila subobscura: experiment in natural populations that supports the adaptive role of chromosomal-inversion polymorphism. Proceedings of the National Academy of Science USA. 1988;85:5597–5600. doi: 10.1073/pnas.85.15.5597. [DOI] [PMC free article] [PubMed] [Google Scholar]
- R Development Core Team. R: A Language and Environment for Statistical Computing. Vienna, Austria: 2006. http://www.R-project.org. [Google Scholar]
- Reeve JP, Fairbairn DJ. Sexual size dimorphism as a correlated response to selection on body size: an empirical test of the quantitative genetic model. Evolution. 1996;50:1927–1938. doi: 10.1111/j.1558-5646.1996.tb03580.x. [DOI] [PubMed] [Google Scholar]
- Ricci M, Budnik M. Influence of temperature, density and interspecific competition on the preadult development of Chilean populations of Drosophila subobscura and Drosophila immigrans. Brazilian Journal of Genetics. 1984;7:255–264. [Google Scholar]
- Roberts SP, Frazier MR, Kirkton SD, Harrison JF. Temperature sensitivity of Drosophila development and flight performance. American Zoologist. 2001;41:1570. [Google Scholar]
- Robinson SJW, Zwaan B, Partridge L. Starvation resistance and adult body composition in a latitudinal cline of Drosophila melanogaster. Evolution. 2000;54:1819–1824. doi: 10.1111/j.0014-3820.2000.tb00726.x. [DOI] [PubMed] [Google Scholar]
- Rozas J, Hernendez M, Cabrera VM, Prevosti A. Colonization of America by Drosophila subobscura: effect of the founder event on the mitochondrial DNA polymorphism. Molecular Biology and Evolution. 1990;7:103–109. doi: 10.1093/oxfordjournals.molbev.a040584. [DOI] [PubMed] [Google Scholar]
- Santos M, Cespedes W, Balanyá J, Trotta V, Calboli FCF, Fontdevila A, Serra L. Temperature-related genetic changes in laboratory populations of Drosophila subobscura: evidence against simple climatic-based explanations for latitudinal clines. American Naturalist. 2005;165:258–273. doi: 10.1086/427093. [DOI] [PubMed] [Google Scholar]
- Schmidt PS, Matzkin L, Ippolito M, Eanes WF. Geographic variation in diapause incidence, life-history traits, and climatic adaptation in Drosophila melanogaster. Evolution. 2005;59:1721–1732. [PubMed] [Google Scholar]
- Sorensen JG, Norry FM, Scannapieco AC, Loeschcke V. Altitudinal variation for stress resistance traits and thermal adaptation in adult Drosophila buzzatii from the New World. Journal of Evolutionary Biology. 2005;18:829–837. doi: 10.1111/j.1420-9101.2004.00876.x. [DOI] [PubMed] [Google Scholar]
- Stockwell CA, Hendry AP, Kinnison MT. Contemporary evolution meets conservation biology. Trends in Ecology and Evolution. 2003;18:94–101. [Google Scholar]