

Abstract
The evolutionary processes at play between island and mainland populations of the malaria mosquito vector Anopheles gambiae sensu stricto are of great interest as islands may be suitable sites for preliminary application of transgenic-based vector control strategies. São Tomé and Príncipe, located off the West African coast, have received such attention in recent years. This study investigates the degree of isolation of An. gambiae s.s. populations between these islands and the mainland based on mitochondrial and ribosomal DNA molecular data. We identify possible continental localities from which these island populations derived. For these purposes, we used FST values, haplotype networks, and nested clade analysis to estimate migration rates and patterns. Haplotypes from both markers are geographically widespread across the African continent. Results indicate that the populations from São Tomé and Príncipe are relatively isolated from continental African populations, suggesting they are promising sites for test releases of transgenic individuals. These island populations are possibly derived from two separate continental migrations. This result is discussed in the context of the history of the African slave trade with respect to São Tomé and Príncipe.
Keywords: Anopheles gambiae, island colonization, malaria, mitochondrial DNA, phylogeography, ribosomal DNA
Introduction
Despite many years of research and control efforts, malaria remains a major health problem. It kills more than a million people a year and costs Sub-Saharan Africa an estimated US$12 billion in gross domestic product annually (Mocumbi 2004). The development and application of transgenic mosquitoes refractory to transmission into natural populations is one vector control strategy currently under consideration (Collins et al. 2000). However, before such strategies are adopted researchers must have a firm knowledge of the vector's ecology and its genetic basis. Understanding current and past evolutionary processes in this complex may help in the battle against malaria by directing vector control programs in a way that will maximize their efficiency and minimize their potential risks. Further, before any releases of transgenic organisms are undertaken on a continental scale, preliminary studies in relatively controlled environments need to be conducted.
The Anopheles gambiae mosquito complex is the major African malaria vector and has served as a model in the study of speciation. Genetic studies mainly within Anopheles gambiae sensu stricto have revealed complex patterns of population structure (Lehmann et al. 2003; della Torre et al. 2005). Patterns of paracentric inversions in chromosome 2 suggested that this species could be divided into distinct chromosomal forms (Coluzzi et al. 1979, 1985; Bryan et al. 1982; Coluzzi 1982). However, subsequent studies found little concordance between chromosome forms and molecular markers (Besansky et al. 1995; Mukabayire et al. 1996, 2001; Gentile et al. 2001). More recently, two distinct molecular forms, termed M and S, were described based on fixed differences in the intergenic spacer gene region (IGS) of the ribosomal DNA (rDNA) (Favia et al. 1997; della Torre et al. 2001). Notably, heterozygote individuals of the molecular forms are rarely observed even in sympatric populations (della Torre et al. 2005; Tripet et al. 2001; Wondji et al. 2002; Diabate et al. 2003; Barnes et al. 2005). Although several other nuclear markers show either near complete linkage disequilibrium, significant genetic distance, or large frequency differences between the molecular forms (Weill et al. 2000; Gentile et al. 2001, 2002, 2004; Diabate et al. 2003; Barnes et al. 2005; della Torre et al. 2005), many other loci show little differentiation between the molecular forms (Gentile et al. 2001; Lehmann et al. 2003). Turner et al. (2005) hybridized population samples of genomic DNA from each molecular form to microarrays and found that three regions (<2.8 Mb) are the only locations where these forms are significantly differentiated. Therefore, neither recent reproductive isolation nor locus specific selection alone seems to be able to explain the genetic patterns and population structure between the M and S forms.
The archipelago of São Tomé and Príncipe (STP), in the Gulf of Guinea off the west coast of Africa may be a suitable location for the initial release of transgenic mosquitoes (Pinto et al. 2002, 2003). At the time of their discovery in 1471 ad, the islands were uninhabited (Tenreiro 1961). Anthropophilic mosquitoes are likely to have reached the islands in the late 15th century when the islands were first colonized, as malaria was a major health problem from the earliest days of human settlement (Baptista 1996). In 1946, five species of anopheline mosquitoes were recorded from the islands, two of which, An. gambiae and Anopheles funestus, are malaria vectors (Mesquita 1946). However, following an intensive intra-domiciliary DDT spraying campaign from 1980 to 1982, a survey conducted in 1986 found only An. gambiae and Anopheles coustani (Ribeiro et al. 1990). More recently, an extensive survey utilizing both cytogenetics and PCR techniques found the FOREST chromosomal form and M molecular form of An. gambiae s.s. to be the only malaria vector present on the islands (Pinto et al. 2000). Pinto et al. (2003) found no evidence of an impact from the DDT campaign on the effective population size of An. gambiae s.s. on the island of São Tomé. This study also found significant differentiation between the southernmost and the northern localities on São Tomé. These island populations are also significantly differentiated from An. gambiae S molecular form populations from mainland Africa (Gabon), but no comparisons with the continental M forms were carried out in that study (Pinto et al. 2002).
In this study, we generated mitochondrial and nuclear rDNA sequences for a large number of An. gambiae s.s. from mainland Africa (including both S and M molecular forms) and STP island populations [673 mitochondrial DNA (mtDNA) and 634 rDNA]. We then combined these sequences with sequences already generated in previous studies (160 mtDNA/147 rDNA) to compare them with sequence data generated from STP (Table 1, Fig. 1). The aims of this study were to: (i) determine the likely mainland origin of the mosquito populations of STP and how this relates to human migration patterns and (ii) assess the degree of isolation and restrictions to gene flow between the islands and the continent to determine STP's suitability as a potential release site for genetically modified mosquitoes.
Table 1.
Localities sampled in this study by country. Locality numbers listed correspond to those illustrated in Fig. 1. Samples found in close proximity were pooled into localities in conformity to the large-scale sampling scheme of this study. Sample sizes (N) for both the ND5 and ITS samples are given separately and where possible molecular forms are given. GPS coordinates are given in degrees and minutes. Sources of the original samples and/or sequence data are given in the last column
| Country and population | GPS coordinates | Locality no.-molecular form | NND5 | NITS | Sample source |
|---|---|---|---|---|---|
| Angola | |||||
| Namibe | 15°10′S, 12°09′E | Ang01-M | 15 | 19 | Calzetta et al. (2008) |
| Luanda area | 08°50′S, 13°14′E | Ang02-M | 41 | 36 | Calzetta et al. (2008) |
| Lunda sud | 09°39′S, 20°26′E | Ang02-S | 2 | 2 | Calzetta et al. (2008) |
| Prov. of Zaire | 06°07′S, 12°22′E | Ang03-S | 14 | 22 | Calzetta et al. (2008) |
| Benin | |||||
| Bohicon, Dassa, Lema, etc. | 07°01′N, 02°17′E | Ben04-M/S | 59 | 58 | della Torre et al. (2001); Gentile et al. (2001, 2002) |
| Cameroon | |||||
| Tiko, Buea, Doula | 04°04′N, 09°36′E | Cam05-M | 56 | 60 | F. Simard Wondji et al. (2002, 2005) |
| Ebebda, Obala | 04°10′N, 11°25′E | Cam06-S | 31 | 30 | F. Simard Wondji et al. (2002, 2005) |
| Simbock, Mbanjock | 03°45′N, 10°95′E | Cam07-M | 32 | 29 | F. Simard Wondji et al. (2002, 2005) |
| CAR | |||||
| Bayanga | 02°55′N, 16°15′E | CAR08-M/S | 8 | 9 | V. Medjibe |
| DRC | |||||
| Kinshasa | 04°19′S, 15°17′E | CG09-M/S | 8 | 6 | Lehmann et al. (2003) |
| EG | |||||
| Malabo | 03°45′N, 08°46′E | EG10-M | 30 | 30 | F. Simard |
| Bata | 01°51′N, 09°45′E | EG11-M | 29 | 13 | F. Simard |
| Gabon | |||||
| Dienga | 01°52′S, 12°41′E | Gab12-S | 36 | 38 | Pinto et al. (2002); Donnelly et al. (2004) |
| Libreville | 00°23′N, 09°27′E | Gab13-S | 22 | 26 | Pinto et al. (2002) |
| Ghana | |||||
| Navrongo | 10°53′N, 01°05′W | Gh14-M | 6* | 8* | Lehmann et al. (2003); Donnelly et al. (2004) |
| Mampong area | 05°24′N, 00°37′W | Gh15-S | 30 | 20 | Yawson et al. (2004); Gentile et al. (2002) |
| Ivory Coast | |||||
| Danta, M'be, Ziglo, etc. | 07°07′N, 07°10′W | IC16-M/S | 24 | 25 | della Torre et al. (2001); Gentile et al. (2001, 2002) |
| Mozambique | |||||
| Furvela | 23°43′S, 35°18′E | Mz17-S | 21 | 21 | J. D. Charlwood |
| Nigeria | |||||
| Kobape | 07°07′N, 03°18′E | Nig18-M/S | 36 | 28 | Kristan et al. (2003); Gentile et al. (2002) |
| Gwamlar | 08°50′N, 07°52′E | Nig19-S | 9* | – | Donnelly et al. (2004) |
| São Tomé | |||||
| Puerto Alegre | 00°02′N, 06°32′E | St20-M | 57 | 56 | Pinto et al. (2002); Donnelly et al. (2004) |
| Riboque | 00°20′N, 06°44′E | St21-M | 60 | 58 | Pinto et al. (2002) |
| Príncipe | |||||
| Trabajodores | 01°39′N, 07°25′E | Pr22-M | 62 | 48 | Pinto et al. (2002); Donnelly et al. (2004) |
| Kenya | |||||
| Asembo, Kisian, Muhroni, Nyakoch, Wathrego | 00°11′S, 34°54′E | Ken23-S | 80* | 21* | Besansky et al. (1997); Donnelly et al. (2001); Gentile et al. (2002); Lehmann et al. (2003) |
| Jego | 03°13′S, 40°07′E | Ken24-S | 5* | 9* | Besansky et al. (1997); Gentile et al. (2002) |
| Malawi | |||||
| Mkali, Mangochi | 14°28′S, 35°00′E | Mal25-S | 2* | 9* | Besansky et al. (1997); Donnelly et al. (2004) |
| Thyolo, Seseo | 16°04′S, 35°08′E | Mal26-S | 17* | – | Donnelly et al. (2004) |
| Senegal | |||||
| Barkedji | 15°10′N, 14°52′W | Sen27-M | 13* | – | Besansky et al. (1997); Donnelly et al. (2004) |
| Dielmo, Ndiop | 13°43′N, 16°25′W | Sen28-M | 19* | – | Besansky et al. (1997) |
| Ndialakar | 16°08′N, 16°27′W | Sen29-M | – | 5* | Gentile et al. (2002) |
| Tanzania | |||||
| Kyela | 09°34′S, 33°51′E | Tz30-S | 9* | 11* | Donnelly et al. (2004) |
| Nyakariro | 03°40′S, 33°26′E | Tz31-S | – | 8* | Gentile et al. (2002) |
| The Gambia | |||||
| Kaur, Bassé, Farafenni | 13°28′N, 15°50′W | Gam32-M | – | 17* | della Torre et al. (2001); Gentile et al. (2001, 2002) |
| GC | |||||
| Sombili,Timbi Madina | 11°24′N, 12°16′W | Gc33-S | – | 10* | della Torre et al. (2001); Gentile et al. (2002) |
| Mali | |||||
| Banambani, Moribabougou | 12°47′N, 08°02′W | Mali34-M/S | – | 33* | Favia et al. (1997); Gentile et al. (2001, 2002) |
| Pimperena | 11°28′N, 05°42′W | Mali35-S | – | 5* | Favia et al. (1997); Gentile et al. (2001, 2002) |
| Burkina Faso | |||||
| Goundry | 12°30′N, 01°20′W | Bf36-M | – | 5* | Favia et al. (1997); Gentile et al. (2001, 2002) |
| Bf36-S | – | 1* | Favia et al. (1997); Gentile et al. (2001, 2002) | ||
| Madagascar | |||||
| Beforona | 18°58′S, 46°34′E | Mad37-S | – | 5* | della Torre et al. (2001); Gentile et al. (2001, 2002) |
| Totals | 833 | 781 | |||
GPS coordinates were taken by hand in field, taken from previous publications, or attained via Global Gazetteer Version 2.1 (http://www.fallingrain.com/world/).
Côte d'Ivoire is labeled by the English name Ivory Coast. CAR, Central African Republic; DRC, Democratic Republic of Congo; EG, Equatorial Guinea; GC, Guinea Conakry. Chromosome forms are identified as follows: FOR, forest; MOP, Mopti; SAV, Savanna. Molecular forms are either not known, not scored, or uncertain.
DNA sequences that have been added from previously published papers.
Figure 1.
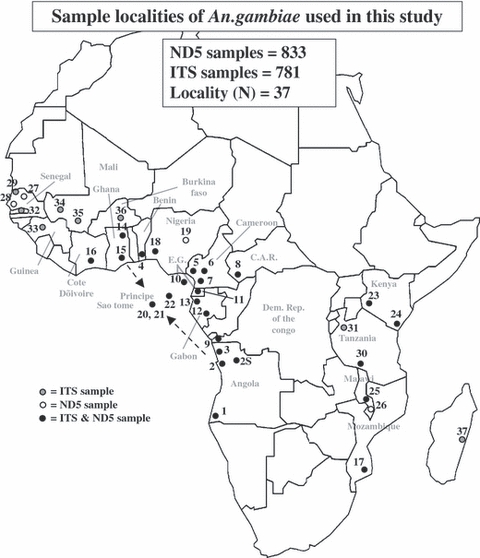
Map of Africa showing the localities where Anopheles gambiae sensu stricto were sampled. Population numbers correspond to population numbers given in Table 1 and the shade of the dots (black or white) indicates whether ND5 and/or ITS sequences were generated from individuals from said locality. Dashed arrows show general historical slave route to STP.
Our markers of choice for this study were based on several important factors. To examine the origins of mosquito introduction to the islands and its relationship to human history, we needed several markers that differed in their rate of evolution but evolved sufficiently slow to capture historical gene flow. The use of mtDNA coupled with the fast evolving internal transcribed spacer – ITS (rDNA) seemed to satisfy this need and at the same time avoid focusing exclusively on current gene flow as is estimated by frequency-based approaches associated with microsatellite marker use (Sunnucks 2000). Also, inherent difficulties with using such fast evolving markers like microsatellites in a situation like ours, where evidence indicates a recent population expansion for the continental populations, and the fact that the island populations are likely not in mutation-drift-equilibria makes unbiased gene flow estimation challenging. However, even with these limitations, such work is currently underway (Pinto, personal communication).
Additionally, ITS has been used extensively in determining differences at and below the species level in anophelines (Hackett et al. 2000; Torres et al. 2000; Beebe et al. 2001; Manonmani et al. 2001). Within interbreeding populations these tandem arrays go through rapid homogenization through concerted evolution and give rise to differences between noninterbreeding populations. Both rDNA markers ITS and IGS segregate into distinct molecular forms (M and S) and seem to have the level of variation appropriate to track recent but historic gene flow (Lehmann et al. 2003) in contrast to other regions that retain the ancestral signal of a rapid range expansion across Africa coincident with human agricultural expansion (Coluzzi et al. 1979; Coluzzi et al. 1985). This region is one of the most used markers for work on intraspecific differentiation in the An. gambiae complex. As such, we were able to compile ample data from other studies and analyze them with our newly generated data, something that is in practice nearly impossible with microsatellite data generated in different laboratories. In addition, the ‘universality’ of the use of ITS marker in Anopheles studies makes it easy for other researchers to relate directly their work with our results.
Lastly, a previous study (Gentile et al. 2001) has described a novel type of ITS-rDNA (type III) in São Tomé that had not been found on the mainland. This could indicate strong isolation but deserves further attention via a much more extensive sampling of the continental populations. Without shortcomings for all of the above mentioned reasons we believe that the combination of the use of ITS-rDNA and mtDNA can provide novel insights into the origin and genetic structure of An. gambiae s.s. populations on the islands of San Tomé and Príncipe.
Materials and methods
Samples and data collection
Anopheles gambiae s.s. samples were collected and pooled into 37 sites from across Africa. DNA sequence data were also obtained from published studies (ITS; Gentile et al. 2001, 2002; NADH dehydrogenase subunit 5 – ND5; Donnelly et al. 2001, 2004). DNA extractions were performed using DNeasy Tissue Kit (Qiagen Sciences, Germantown, MD, USA). Specimens were assigned to species and molecular form using the PCR-RFLP method developed by Fanello et al. (2002). Table 1 lists localities and sample sizes and indicates which DNA sequences were produced de novo and which were gathered from GenBank/previous studies.
A 570 base-pair (bp) segment of the mitochondrial ND5 gene was amplified following the protocols of Besansky et al. (1997) with minor changes. We used the primers pair 7013/Dmp3A and altered the thermocycling conditions to an initial 10-min denaturation at 94°C, followed by 35 cycles of a 45-s denaturation at 94°C, 45-s annealing at 47°C, and a 1-min extension at 72°C, followed by a final 5-min extension at 72°C. A 840-bp fragment of rDNA including the internal transcribed spacers (ITS) and the intervening 5.8S rDNA was amplified using the protocols and primers sets of Gentile et al. (2001). PCR products were cleaned using QIAquick PCR Purification Kit (Qiagen Sciences). Sequencing was carried out at the DNA Analysis Facility on Science Hill (Yale University, CT, USA).
Data analysis
All DNA sequences were edited using sequencher 4.1 (Gene Codes Corp., Inc., Ann Arbor, MI, USA). All sequences (ND5 and ITS) were aligned using the high throughput multiple sequence alignment program MUSCLE (Edgar 2004). The ITS gene is an X-linked region and therefore diploid only in females. In addition, it shows an extremely low frequency of heterozygotes and has a very complex evolutionary history (Gentile et al. 2001, 2002). For these reasons, we treated the ITS data as haploid markers.
We estimated genealogic relationships between both ND5 and ITS haplotypes by constructing a parsimony network using the tcs software version 1.21 (Clement et al. 2000). At the population level, this method is preferred over traditional phylogenetic tree reconstruction as it does not require bifurcating relationships and does not assume that the ancestral sequence/s are missing. We also used the tcs software (Clement et al. 2000) to identify the most probable ancestral haplotypes.
ND5 sequence data
We used the ND5 sequence data to test the degree of separation between island and continental populations through the estimation of frequency-based FST values. Although shared ancestral polymorphisms, which are very likely to occur in this data set, often confound the effects of population history with current gene flow, we determined these values and used them to obtain ‘gross’ estimates of separation to guide further analyses. The FST values were calculated using the program DnaSP (Rozas et al. 2003). FST matrices were imported into paup* (Swofford 2002) to estimate a neighbor-joining (NJ) tree to visualize the degree of separation of the populations. To run statistical permutation tests of population subdivision between the STP populations and the continental populations with the smallest FST values, we used DnaSP (Rozas et al. 2003) to estimate three statistics: χ2, a haplotype frequency-based statistic recommended for nonrecombining data (Hudson et al. 1992); KST*, a sequence-based statistic that utilizes information on the number of differences between haplotypes and not just the frequencies of haplotypes, giving less weight to large number of differences than other sequence-based statistics (Hudson et al. 1992); and Snn, the nearest-neighbor statistic (Hudson 2000).
ITS sequence data
The ITS marker is one of the few markers shown to be divergent between the An. gambiae s.s. molecular forms and thus most likely to reflect current rather than historical population structure (della Torre et al. 2005). As such, we used our ITS sequence data to assess current patterns of genetic variation between island and mainland populations.
We used a two-step analytical strategy. We first identified the continental populations that were the most likely source for the STP populations by estimating traditional frequency-based FST values, using the program DnaSP (Rozas et al. 2003) and visualized their relationship by constructing a NJ tree (paup*, Swofford 2002). Locality samples containing both molecular forms were treated as distinct subsets. The lowest island–continental pairwise FST values identified continental populations of potential origin.
Second, we used nested clade analysis (NCA) to assess these patterns within our total ITS data set. When assessing patterns of genetic variation at the intraspecific level it is often difficult to distinguish current population structure from population history using traditional population genetic estimates such as FST (Templeton et al. 1995). For instance, two populations sharing similar alleles at similar frequencies could be the product of ongoing gene flow (current population structure) or a past range expansion of the organism (population history). NCA uses haplotype frequencies in conjunction with the genealogic relationships and geographic distribution of the haplotypes to distinguish current structure from historical events (Templeton et al. 1995). Although NCA has received some recent criticism (Knowles and Maddison 2002), it provides valuable information when inferences are supported by independent biologic knowledge of the system and caution is used in assessing the results. In the present situation, we were particularly interested in inferences of significant fragmentation or range expansion between island and continental populations.
To implement the NCA, an ITS network was first constructed using the program tcs (Clement et al. 2000). Haplotypes were connected using a 95% parsimony limit. A number of ambiguous connections or loops in the resulting haplotype networks were broken using the criteria in Crandall and Templeton (1993). The total network was then nested (Templeton 1998) and input into geodis version 2.4 (Posada et al. 2000) together with sample location information. We then performed 1000 permutations tests to test for association between phylogeny and geographic distribution. Clade distances (Dc) and nested clade distances (Dn) were measured and interior and tip clade differences estimated. Templeton (2004) revised inference key (Modified 11 November 2005) was applied to the clades with significant results from geodis to determine the outcome of the NCA.
Results
ND5 analysis
Our sequences of the ND5 mtDNA gene were combined with previously published sequence data presented in Donnelly et al. (2001, 2004) to make a total of 833 samples. To have a complete overlap of sequences, all fragments were trimmed to a length of 472 bp. A total of 131 distinct haplotypes resulted (Appendix 1), 51 of which were shared between two or more individuals and 17 shared between both M and S molecular forms. Of the 472 bp, 80 were variable and 52 parsimony-informative. Overall, the most common haplotypes (1, 8, and 11, Appendix 1) were found to be widespread suggesting a shallow population substructuring of mtDNA across most of the geographic distribution of An. gambiae s.s.
Figure 2A shows the clustering of populations based on FST values derived from the ND5 sequence data. Neither molecular forms nor localities with mixed molecular forms formed clusters. STP populations did cluster with populations from West Africa. Table 2 shows the results of the statistical tests of population subdivision (χ2, KST*, Snn) between the STP populations and the continental populations with the smallest FST. Almost all comparisons for all statistics were significant except for χ2 and Snn between St20 and St21, Snn between IC16M and St20, and KST* and Snn between IC16M and St21. The nonsignificant results for the IC16M are not surprising given the small sample size (N = 3) of this locality. The tcs parsimony network generated from ND5 was complex with over 35 reticulation loops and, as with the NJ tree in Fig. 2A, neither molecular type formed clusters on any part of the network (Appendix 2).
Figure 2.
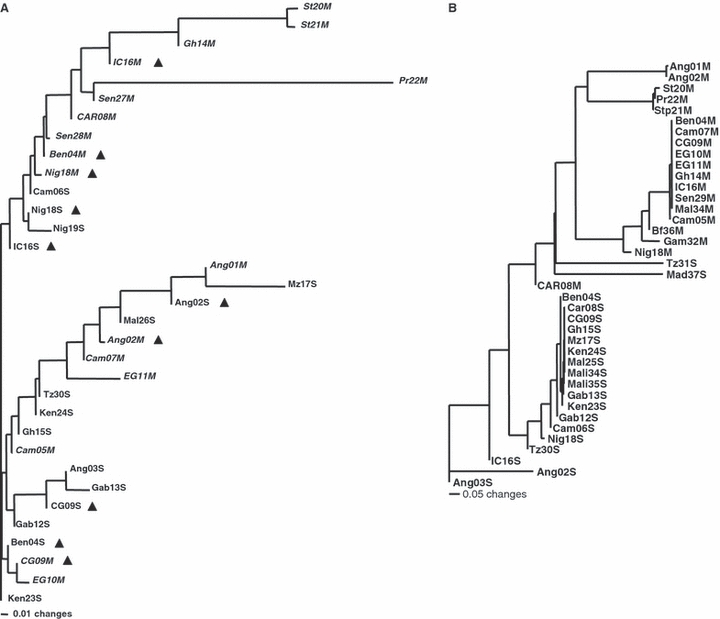
(A) Neighbor-joining tree based on pair-wise FST values between populations of Anopheles gambiae sensu stricto estimated using the ND5 mitochondrial gene. To better distinguish the M and S populations, M-form populations are written in italics. Triangles indicate populations that have been split into an S-form population and an M-form population. (B) Neighbor-joining tree based on pair-wise FST values between populations of Anopheles gambiae estimated using the ITS sequence data. NJ trees are not intended to infer phylogenetic relationships but rather to show clusters of FST values. Taxa are labeled as in Table 1.
Table 2.
Statistical permutation tests of population subdivision between STP populations and the continental population with smallest FST values between STP and continental population comparisons
| St21(60) | Pr22(62) | GH14M(6) | IC16M(3) | Sen27M(13) | CAR08(7) | Ben04M(41) | |
|---|---|---|---|---|---|---|---|
| St20(57) | ns/*/ns | ***/***/*** | ***/*/** | ***/*/ns | ***/**/** | ***/***/*** | ***/***/*** |
| St21 | – | ***/***/*** | ***/*/** | ***/ns/ns | ***/***/*** | ***/**/*** | ***/***/*** |
| Pr22 | – | – | ***/***/*** | ***/***/*** | ***/***/*** | ***/***/*** | ***/***/*** |
Three statistics are given χ2, a haplotype frequency-based statistic, KST*, a sequence-based statistic, and Snn. Levels of significance are coded as follows: ns, not significant; *0.01 < P < 0.05; **0.001 < P < 0.01; ***P < 0.001. For each population, comparison the results are given as χ2/KST*/Snn. Populations are coded as in Table 1 and Fig. 2A. Numbers in parenthesis are sample sizes.
One-thousand permutations were made per test. Here, we perform 18 pair-wise comparisons, with 18 tests there is a 60.28% probability of finding a significant result by chance. Calculation of a strict Bonferroni adjustment without correlation, something we view as overly conservative in our situation, would require an alpha of 0.05, a P-value of 0.0027.
ITS sequence analysis
We combined our ITS sequence data with the published ones (Gentile et al. 2001, 2002) to form a data set consisting of 781 samples of 840 bp fragments. This resulted in 24 different haplotypes, 12 of which have not been previously described (haplotypes 6, 7, 8, 11, 12, 13, 15, 16, 17, 18, 19, and 22, Appendix 3). Figure 3 shows the phylogenetic relationships between ITS haplotypes using a tcs network (Templeton et al. 1995). The topology of this network is similar to the one described by Gentile et al. (2002) with the exception of a new loop formed through In3, which connects the Type I and Type II haplotypes more directly than in the previously published network. In S-form An. gambiae, haplotypes IA and ID were found through western and eastern Africa (Fig. 4). In the M-form, haplotype IIA was found across western Africa (Fig. 4). Notably haplotype IIIB, previously found only on São Tomé (Gentile et al. 2002) was found for the first time in the continental populations from Angola. The samples Ang01M and Ang02M (Table 1) both contain this haplotype. The existence of haplotype IIIB in Angola suggests potential for current gene flow and/or the origin for the STP populations. This is also supported by the topology of the NJ tree in Fig. 2B.
Figure 3.
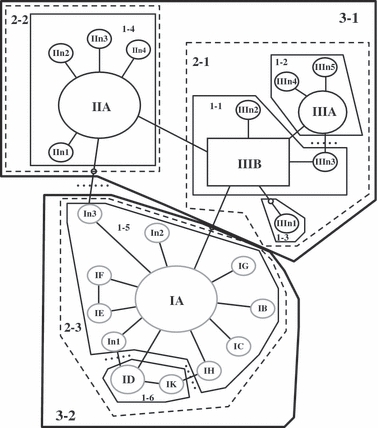
tcs network for the ITS sequence data labeled following Gentile et al. 2002. Number of taxa = 781, number of haplotypes = 24. Haplotypes n1–n5 indicate new haplotypes. The black square and the ovals represent M molecular types; grey ovals are S molecular types. Haplotypes labeled II and III are M forms. Haplotypes labeled I are S forms. Small empty ovals represent missing haplotypes. The square haplotype (IIIB), representing the inferred ancestral haplotype, was found in populations St20 (frequency = 0.21), St21 (0.34), Pr22 (0.21), Ang01 (1.00), and Ang02 (0.97). Size of haplotype roughly corresponds to frequency. Lines separating symbols represent mutational steps or single base-pair substitutions. Dotted lines show where loops were broken. Haplotypes are nested into hierarchical clades in preparation for the NCA analysis. Thin lines group haplotypes clustered into one-step clades, dashed lines into two-step clades, and thick lines into three-step clades. Clades are labeled by clade level and hyplotype number, for example, 1-2 is the second haplotype in the one-step clade.
Figure 4.
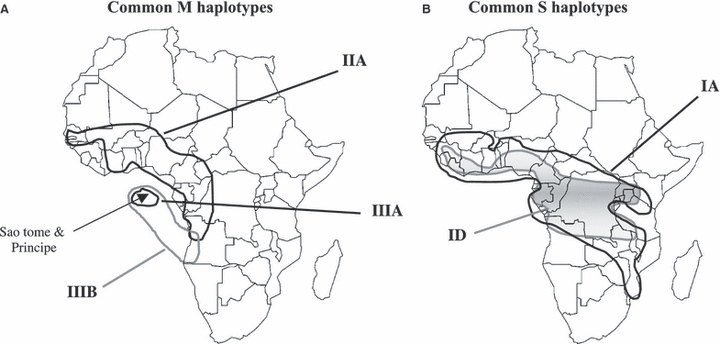
Geographical distribution of ITS haplotypes that were found in multiple localities. Where distributions of two haplotypes overlap one haplotype distribution is represented by shaded area. Haplotypes are widespread across large distances. Haplotype numbers correspond to those in Fig. 3. A single haplotype IIIB is found in both island (São Tomé and Príncipe) and continental populations in Angola.
Figure 3 shows the nested haplotype network used for NCA analysis (Templeton et al. 1995). NCA requires conversion of a haplotype network into a hierarchical set of nested clades following the set of rules given in Templeton et al. (1987) and Templeton and Sing (1993). We followed these rules but nested all STP haplotypes into their own group (clade 2-1, Fig. 3) before nesting them into the rest of the network. We also allowed all M molecular forms and all S molecular forms to nest into their own group (clades 3-1 and 3-2 in Fig. 3) before joining the two groups into the total network. This enabled comparisons between STP and mainland populations and M and S forms to be made. The final nesting (Fig. 3) deviates little from a strict application of the Templeton and Sing (1993) rules. The general pattern and conclusion from NCA for both the continental M and S molecular forms (clades 2-1 and 2-3 respectively) were very similar. Both clades showed widespread ancestral haplotypes with tip haplotypes restricted to single localities within the range of the widespread ancestral haplotypes. Using Templeton's modified inference key, restricted gene flow with isolation by distance (IBD) was inferred in both of these clades. Inferences for clade 1-5 indicated restricted gene flow/dispersal with some long distance dispersal for haplotype IC. Haplotype IC was restricted to the island of Madagascar. In Madagascar, like STP, we find unique or nearly unique haplotypes supporting the notion that oceanic barriers may be hindering gene flow from the continent. NCA results for significant clades are given in Table 3. These results indicate a range expansion for clades 2-1, from Angola to the island of São Tomé and Príncipe, and 2-2, across most mainland populations of Western Africa.
Table 3.
NCA results for all significant clades
| Nested clade permutation analysis | |||
|---|---|---|---|
| Clade 3-1 (observed χ2-statistic = 466.0855, P < 0.0001) | |||
| Type of distance | Distance | PSS | PSL |
| Clade 2-1 (Interior) | |||
| Within clade | 753.3448 | 0.0000 | 1.0000 |
| Nested clade | 1099.3743 | 0.1480 | 0.8520 |
| Clade 2-2 (Tip) | |||
| Within clade | 1135.2346 | 0.3770 | 0.6230 |
| Nested clade | 1186.7130 | 0.7290 | 0.2710 |
| Interior versus tip clades | I-T distance | PSS | PSL |
| Within clade | −381.8898 | 0.0010 | 0.9990 |
| Nested clade | −87.3387 | 0.2030 | 0.7970 |
| Inference = range expansion for clades 2-1 and 2-2 | |||
| Clade 2-1 (observed χ2-statistic = 91.6938, P < 0.0001) | |||
| Type of distance | Distance | PSS | PSL |
| Clade 1-1 (interior) | |||
| Within clade | 692.0376 | 0.1230 | 0.8770 |
| Nested clade | 865.0450 | 1.0000 | 0.0000 |
| Clade 1-2 (Tip) | |||
| Within clade | 84.2306 | 0.0000 | 1.0000 |
| Nested clade | 613.7558 | 0.0000 | 1.0000 |
| Clade 1-3 (Tip) | |||
| Within clade | 0.0000 | 1.0000 | 1.0000 |
| Nested clade | 691.1035 | 0.9220 | 0.3240 |
| Interior versus tip clades | I-T distance | PSS | PSL |
| Within clade | 608.5208 | 1.0000 | 0.0000 |
| Nested clade | 250.6338 | 1.0000 | 0.0000 |
| Inference = isolation by distance | |||
| Clade 2-3 (Observed χ2-statistic = 102.4387, P < 0.0001) | |||
| Type of distance | Distance | PSS | PSL |
| Clade 1-5 (interior) | |||
| Within clade | 2071.4351 | 0.9480 | 0.0520 |
| Nested clade | 2062.5834 | 0.9060 | 0.0940 |
| Clade 1-6 (Tip) | |||
| Within clade | 1546.9352 | 0.0440 | 0.9560 |
| Nested clade | 1711.8136 | 0.0760 | 0.9240 |
| Interior versus tip clades | I-T distance | PSS | PSL |
| Within clade | 524.5000 | 0.9580 | 0.0420 |
| Nested clade | 350.7698 | 0.9230 | 0.0770 |
| Inference = isolation by distance | |||
| Clade 1-5 (observed χ2-statistic = 762.4985, P < 0.0001) | |||
| Type of distance | Distance | PSS | PSL |
| Clade IA (Interior) | |||
| Within clade | 1903.6805 | 0.0000 | 1.0000 |
| Nested clade | 1974.1171 | 0.0000 | 1.0000 |
| Clade In1 (Tip) | |||
| Within clade | 0.0000 | 0.0730 | 1.0000 |
| Nested clade | 602.0199 | 0.0320 | 0.9880 |
| Clade IE (tip) | |||
| Within clade | 0.0000 | 1.0000 | 1.0000 |
| Nested clade | 1875.2362 | 0.4620 | 0.5970 |
| Clade IF (Tip) | |||
| Within clade | 0.0000 | 1.0000 | 1.0000 |
| Nested clade | 2015.3519 | 0.6390 | 0.4420 |
| Clade In3 (tip) | |||
| Within clade | 0.0000 | 1.0000 | 1.0000 |
| Nested clade | 602.0199 | 0.1680 | 0.9670 |
| Clade In2 (Tip) | |||
| Within clade | 0.0000 | 0.0010 | 1.0000 |
| Nested clade | 1923.7367 | 0.4870 | 0.5130 |
| Clade IG (tip) | |||
| Within clade | 0.0000 | 1.0000 | 1.0000 |
| Nested clade | 3020.2976 | 0.8230 | 0.1940 |
| Clade IB (Tip) | |||
| Within clade | 0.0000 | 0.0000 | 1.0000 |
| Nested clade | 1711.7679 | 0.2560 | 0.7440 |
| Clade IC (tip) | |||
| Within clade | 0.0000 | 0.0010 | 1.0000 |
| Nested clade | 3629.0913 | 1.0000 | 0.0000 |
| Clade IH (Tip) | |||
| Within clade | 0.0000 | 1.0000 | 1.0000 |
| Nested clade | 2975.8615 | 0.8290 | 0.2050 |
| Interior versus tip clades | I-T distance | PSS | PSL |
| Within clade | 1903.6805 | 1.0000 | 0.0000 |
| Nested clade | −160.3560 | 0.1260 | 0.8740 |
| Inference = restricted gene flow/dispersal with some long distance dispersal for clade IC. | |||
Within and nested clade distances are given, in miles, for both interior (I) and tip (T) clades. PSS, P-value for a significantly small value; PSL, P-value for a significantly large value. I-T distance is the interior clade distance minus the tip clade distance. Inferences based on Templeton key are given for each clade.
Discussion
Significant levels of genetic differentiation were determined between populations of An. gambiae s.s. on the islands of São Tomé and Príncipe and mainland Africa indicating that gene flow between them is restricted. We report large FST values obtained by mtDNA ND5 sequence data between island and continental populations, as well as between São Tomé and Príncipe. In addition, statistical tests confirmed that the STP island populations were significantly differentiated from those continental populations for which FST estimates had been the lowest (Table 2). However, a few nonsignificant results were obtained for comparisons with the M-form continental population of Ivory Coast (IC16-M). While this might suggest a closer relationship between STP and Ivory Coast, the low sample size (N = 3) of the latter may have influenced these nonsignificant results.
Results of the rDNA ITS sequence data also supported limited gene flow between STP populations and the continent. With the exception of haplotype IIIB that was also found in two mainland populations in Angola, all of the ITS haplotypes found on São Tomé and Príncipe are unique to the islands. Although a single mutational step separates Haplotype IIIB from two common widespread mainland haplotypes (IIA, IA), the fact that the only other place it is found is Angola suggests that An. gambiae s.s. from Angola may be a possible source from which the STP populations were derived.
Cuamba et al. (2006) sampled 403 An. gambiae from across Angola and found that 93.5% of them were M form, the same form that is found on STP. This pattern was also recently confirmed by Calzetta et al. (2008). In addition, recent findings by Slotman et al. (2007) based on microsatellite markers on chromosome 3 from samples in Cameroon suggest that the M molecular form may be further divided into M-forest chromosome type and M-mopti chromosome type. STP and Angola M-form population are both forest chromosome type. Figure 2B based on the ITS sequence data shows these localities clustering together, however, the two additional M-forest localities Cam05 and Cam07 cluster instead with other M-form localities. This suggests that further work is needed to understand the extent of further subdivision within the M molecular form.
The FST values estimated from the ND5 data were the smallest between STP and Ghana, Senegal, and the Ivory Coast but not Angola. Therefore, we cannot exclude that the west coast of Africa, in particular the Gulf of Guinea, may be another possible source of the STP colonizing populations. ND5 haplotypes were also shared between molecular forms and, where both molecular forms were in close geographic proximity, did not cluster on the NJ tree (Fig. 2A).
The discordance between patterns based on ITS and ND5 sequences is similar to the conflicting pattern between the rDNA markers and most other genomic markers (Lehmann et al. 2003; della Torre et al. 2005). Sperling (1994) suggests that X-linked differences tend to be associated with species boundaries and it appears that such is the case between molecular forms in An. gambiae (Stump et al. 2005). This discrepancy could be due to the different molecular processes at play and rates of evolution between the ND5 and ITS rDNA sequences, and/or may track two separate colonization events. The repetitive structure of rDNA is known to give rise to concerted evolution (Arnheim 1983) and therefore can spread new alleles much faster through a population than other markers (Arnheim 1983; Collins and Paskewitz 1996). The process by which rDNA variants arise and convert other copies into themselves would reduce the total genetic variation of the marker and hasten the fixation of alternative alleles. This is what we observed in our study. The ITS haplotype IIIB was found at very high frequencies in the Angola populations (Ang01-M = 100%, Ang02-M = 97%) but only at intermediate levels in the STP populations (St20M = 21%, St21-M = 34%, and Pr22-M = 21%) as expected when considering a more recent introduction of this haplotype into these islands from Angola migrants. It is therefore possible that the ND5 sequences represent the original colonization of An. gambiae into STP and the ITS sequences reflect a later colonization followed by on-going rapid gene conversion.
These results are interesting as they fit loosely with the history of early human migration to STP. Two major waves of human migration have occurred in the history of these islands. The first occurred between 1500 and 1521 ad during which 2500–5400 slaves a year were imported into São Tomé to provide labor for Portuguese efforts at sugar cane production (Lovejoy 2000). The northern arrow in Fig. 1 shows the general direction of this migration.
The islands’ sugar production was short-lived by the end of the 16th century. When the demand for cheap labor ended, no major human migration occurred for more than 200 years. This lull was broken when cocoa and coffee plantations were introduced on the islands. These crops, like sugar cane, needed a cheap labor force to be economically viable. The Portuguese brought laborers mainly from Angola and Cape Verde. By the 1860s over 1000 laborers a year were being transported to the islands, resulting in a second major human migration to the islands (Lovejoy 2000). The southern arrow in Fig. 1 shows the general direction of this migration.
Altogether, our results suggest that gene flow between the islands of STP and mainland Africa is likely to be restricted and that there have been only few events of migration of An. gambiae into these islands coincident with episodes of intense human migration. This is not surprising given the anthropophilic nature of this species and man-mediated transportation of insect vectors is a well-documented phenomenon (Lounibos 2002). These introductions have had important epidemiologic consequences, such as the occurrence of a malaria epidemic in northeast Brazil associated with the introduction of An. gambiae in the 1930s (Killeen et al. 2002; Parmakelis et al. 2008).
By performing NCA, we were able to confirm the range expansion between Angola the islands of São Tomé and Príncipe and also another expansion across central and northwest Africa (della Torre et al. 2005). Anopheles gambiae is thought to have only recently expanded across Africa around 4000–10 000 years ago coincident with human agricultural expansion (Coluzzi et al. 1979; Coluzzi 1982) and thus the historical evidence fits well with these inferences. NCA has provided a statistical framework for testing these events.
This study provides evidence supporting the notion that populations of An. gambiae from the islands of STP are genetically isolated from continental populations. This is in agreement with previous results based on microsatellite data (Pinto et al. 2002). Here, the inclusion of a more extensive data collection from 22 African countries and the use of two distinct genetic markers, mtDNA and rDNA, allowed us not only to confirm a significant degree of genetic isolation but also to infer that probably only a few major colonization events of An. gambiae occurred and that these may have been man-mediated. Gene flow is thus likely to be a rare event due to restrictions imposed by the ocean as a physical barrier preventing migration of insects, as previously observed in this and other mosquito vector species (Simard et al. 1999; Reimer et al. 2005; Turner et al. 2005; Ayala et al. 2006; Foley and Torres 2006). It appears contemporary man-mediated gene flow is negligible even given the fact that traffic between the mainland and the islands is substantial. However, given the potential for man-mediated introduction of vectors highlighted by this and other studies, particular care should be taken in implementing effective vector monitoring schemes in strategic points such as airports and harbors.
Advances in analytical methods and increased resolution of molecular markers are helping scientists to better understand this complicated vector system (Beidler et al. 2003;Barnes et al. 2005; della Torre et al. 2005). The high levels of genetic isolation found coupled with the strong evidence of restricted gene flow suggest that STP islands could be suitable sites for controlled experiments with genetically modified mosquitoes (Benedict and Robinson 2003). The recent upsurge of malaria in many parts of Africa is probably caused by a multitude of factors (climate change, drug resistance, etc.) that will require novel methods of vector control (Nchinda 1998). Genetic control methods offer new hope and the use of genetically modified mosquitoes to control the disease continues to gain support (Christophides 2005). It is important to couple such efforts with studies like ours that use population and phylogenetic analyses in selecting potential first release sites.
Acknowledgments
We would like to thank the following people: M Akogbeto (Benin), J Bryan (The Gambia), PJ Cani and GC Carrara (Angola), C Costantini (Burkina Faso), CF Curtis (UK), J Dossou-Yovo (Ivory Coast), N Elissa (CIRMF, Gabon), M Kristan (Nigeria), N'F Sagnon (Burkina Faso), and YT Touré for providing samples: JC Toto (field) and S Zebaze (lab) from Cameroon; C. Ferreira and VE do Rosário for logistic support in STP and Lisbon, respectively. M Calzetta for lab work in Rome. V Petrarca for useful discussions. This work was also supported by the following grants: NIH RO1 AI046018, Studies on mosquito vectors in West Africa, aimed at malaria epidemiology and control – INCO-DC/EU (IC18CT960030), Malaria vectors in islands, studies on genetic isolation – UNICEF/UNDP/World Bank/WHO Special Programme for Research and Training in Tropical Diseases (TDR) (ID no. A50239) to JP, and UNICEF/UNDP/World Bank/WHO Special Program for Research and Training in Tropical Diseases (TDR) (ID no. A10435) to AdT.
Supporting Information
Additional Supporting Information may be found in the online version of this article:
Appendix S1. ND5 haplotypes and frequency counts.
Appendix S2. tcs network represent the phylogenetic relationships between 131 ND5 mtDNA haplotypes.
Appendix S3. ITS haplotypes and frequency counts.
Please note: Wiley-Blackwell are not responsible for the content or functionality of any supporting materials supplied by the authors. Any queries (other than missing material) should be directed to the corresponding author for the article.
References
- Arnheim N. Concerted evolution of multigene families. In: Nei M, Kohn RK, editors. Evolution of Genes and Proteins. Sunderland, MA: Sinauer Associates; 1983. pp. 38–61. [Google Scholar]
- Ayala D, Goff GL, Robert V, De Jong P, Takken W. Population structure of the malaria vector Anopheles funestus (Diptera: Culicidae) in Madagascar and Comoros. Acta Tropica. 2006;97:292–300. doi: 10.1016/j.actatropica.2005.12.002. [DOI] [PubMed] [Google Scholar]
- Baptista JL. Subsídio para a história do paludismo em S. Tomé. Acta Medicina Portugal. 1996;9:259–265. [PubMed] [Google Scholar]
- Barnes MJ, Lobo NF, Coulibaly MB, Sagnon N'F, Cotantini C, Besansky NJ. SINE insertion polymorphism on the X chromosome differentiates Anopheles gambiae molecular forms. Insect Molecular Biology. 2005;14:353–363. doi: 10.1111/j.1365-2583.2005.00566.x. [DOI] [PubMed] [Google Scholar]
- Beebe NW, Foley DH, Cooper RD, Bryan JH, Cooper RD. Ribosomal DNA spacer genotypes of the Anopheles bancroftii group (Diptera: Culicidae) from Australia and Papua New Guinea. Insect Molecular Biology. 2001;10:407–413. doi: 10.1046/j.0962-1075.2001.00278.x. [DOI] [PubMed] [Google Scholar]
- Beidler J, Qi Y, Holligan D, Della Torre A, Wessler S, Tu Z. Transposable element (TE) display and rapid detection of TE insertion polymorphisms in the Anopheles gambiae species complex. Insect Molecular Biology. 2003;12:211–216. doi: 10.1046/j.1365-2583.2003.00403.x. [DOI] [PubMed] [Google Scholar]
- Benedict MQ, Robinson AS. The first release of transgenic mosquitoes: an argument for the sterile insect technique. Trends in Parasitology. 2003;19:349–355. doi: 10.1016/s1471-4922(03)00144-2. [DOI] [PubMed] [Google Scholar]
- Besansky NJ, Bedell JA, Benedict MQ, Mukabayire O, Hilfiker D, Collins FH. Cloning and characterization of the white gene from Anopheles gambiae. Insect Molecular Biology. 1995;4:217–231. doi: 10.1111/j.1365-2583.1995.tb00027.x. [DOI] [PubMed] [Google Scholar]
- Besansky NJ, Lehmann T, Fahey GT, Fontenille D, Braack LEO, Hawley WA, Collins FH. Patterns of mitochondrial variation within and between African malaria vectors, Anopheles gambiae, suggests extensive gene flow. Genetics. 1997;147:1817–1828. doi: 10.1093/genetics/147.4.1817. [DOI] [PMC free article] [PubMed] [Google Scholar]
- Bryan JH, Di Deco MA, Petrarca V. Inversion polymorphism and incipient speciation in Anopheles gambiae s.s in the Gambia, West Africa. Genetica. 1982;59:167–176. [Google Scholar]
- Calzetta M, Santolamazza F, Carrara GC, Cani PJ, Fortes F, Di Deco MA, Della Torre A. Distribution and chromosomal characterization of the Anopheles gambiae complex in Angola. American Journal of Tropical Medicine and Hygiene. 2008;78:169–175. [PubMed] [Google Scholar]
- Carrara GC, Calzetta M, Santolamazza F. Preliminary data on the distribution of species and forms of the Anopheles gambiae complex (Diptera: Culicidae) at sites of Angola. Parassitologia. 2004;46(Suppl. 1):85. [Google Scholar]
- Christophides GK. Transgenic mosquitoes and malaria transmission. Cellular Microbiology. 2005;7:325–333. doi: 10.1111/j.1462-5822.2005.00495.x. [DOI] [PubMed] [Google Scholar]
- Clement M, Posada D, Crandall KA. TCS: a computer program to estimate gene genealogies. Molecular Ecology. 2000;9:1657–1659. doi: 10.1046/j.1365-294x.2000.01020.x. [DOI] [PubMed] [Google Scholar]
- Collins FH, Paskewitz SM. A review of the use of ribosomal DNA (rDNA) to differentiate among cryptic Anopheles species. Insect Molecular Biology. 1996;5:1–9. doi: 10.1111/j.1365-2583.1996.tb00034.x. [DOI] [PubMed] [Google Scholar]
- Collins FH, Kamau L, Ranson HA, Vulule J. Molecular entomology and prospects for malaria control. Bulletin of the World Health Organization. 2000;78:1412–1423. [PMC free article] [PubMed] [Google Scholar]
- Coluzzi M. Spatial distribution of chromosomal inversions and speciation in anopheline mosquitoes. In: Bargozzi C, editor. Mechanisms of Speciation. New York: Alan R. Liss; 1982. pp. 143–153. [PubMed] [Google Scholar]
- Coluzzi M, Sabatini A, Petrarca V, Di Deco MA. Chromosomal differentiation and adaptation to human environments in the Anopheles gambiae complex. Transactions of the Royal Society of Tropical Medicine and Hygiene. 1979;73:483–497. doi: 10.1016/0035-9203(79)90036-1. [DOI] [PubMed] [Google Scholar]
- Coluzzi M, Petrarca V, Di Deco MA. Chromosomal inversion intergradation and incipient speciation in Anopheles gambiae. Bollettino di Zoologia. 1985;52:45–63. [Google Scholar]
- Crandall KA, Templeton AR. Empirical tests of some predictions from coalescent theory with applications to intraspecific phylogeny construction. Genetics. 1993;134:959–969. doi: 10.1093/genetics/134.3.959. [DOI] [PMC free article] [PubMed] [Google Scholar]
- Cuamba N, Choi KS, Townson H. Malaria vectors in Angola: distribution of species and molecular forms of the Anopheles gambiae complex, their pyrethroid insecticide knockdown resistance (kdr) status and Plasmodium falciparum sporozoite rates. Malaria Journal. 2006;5:1–6. doi: 10.1186/1475-2875-5-2. [DOI] [PMC free article] [PubMed] [Google Scholar]
- Della Torre A, Fanello C, Akogbeto M, Dossou-yovo J, Favia G, Petrarca V, Coluzzi M. Molecular evidence of incipient speciation within Anopheles gambiae s.s. in West Africa. Insect Molecular Biology. 2001;10:9–18. doi: 10.1046/j.1365-2583.2001.00235.x. [DOI] [PubMed] [Google Scholar]
- Della Torre A, Tu Z, Petrarca V. On the distribution and genetic differentiation of Anopheles gambiae s.s. molecular forms. Insect Biochemistry and Molecular Biology. 2005;35:755–769. doi: 10.1016/j.ibmb.2005.02.006. [DOI] [PubMed] [Google Scholar]
- Diabate A, Baldet T, Chandre C, Dabire KR, Kenge P, Guiguemde TR, Simard F, et al. Kdr mutation, a genetic marker to assess event of introgression between the molecular M and S forms of Anopheles gambiae (Diptera: culicidae) in the tropical savannah area of West Africa. Journal of Medical Entomology. 2003;40:195–198. doi: 10.1603/0022-2585-40.2.195. [DOI] [PubMed] [Google Scholar]
- Donnelly MJ, Licht MC, Lehmann T. Evidence for recent population expansion in the evolutionary history of the Malaria vectors Anopheles arabiensis and Anopheles gambiae. Molecular Biology and Evolution. 2001;18:1353–1364. doi: 10.1093/oxfordjournals.molbev.a003919. [DOI] [PubMed] [Google Scholar]
- Donnelly MJ, Pinto J, Girod R, Besansky NJ, Lehmann T. Revisiting the role of introgression vs. shared ancestral polymorphisms as key processes shaping genetic diversity in the recently separated sibling species of the Anopheles gambiae complex. Heredity. 2004;92:61–68. doi: 10.1038/sj.hdy.6800377. [DOI] [PubMed] [Google Scholar]
- Edgar RC. MUSCLE: multiple sequence alignment with high accuracy and high throughput. Nucleic Acids Research. 2004;32:1792–1979. doi: 10.1093/nar/gkh340. [DOI] [PMC free article] [PubMed] [Google Scholar]
- Fanello C, Santolamazza F, Della Torre A. PCR-RFLP methods for simultaneous detection of molecular forms of Anopheles gambiae s.s and other species of the complex. Medical and Veterinary Entomology. 2002;16:461–464. doi: 10.1046/j.1365-2915.2002.00393.x. [DOI] [PubMed] [Google Scholar]
- Favia G, Della Torre A, Bagayoko M, Lanfrancotti A, Sagnon NF, Toure YT, Coluzzi M. Molecular identification of sympatric chromosomal forms of Anopheles gambiae and further evidence of their reproductive isolation. Insect Molecular Biology. 1997;6:377–383. doi: 10.1046/j.1365-2583.1997.00189.x. [DOI] [PubMed] [Google Scholar]
- Foley DH, Torres EP. Population structure of an island malaria vector. Medical and Veterinary Entomology. 2006;20:393–401. doi: 10.1111/j.1365-2915.2006.00647.x. [DOI] [PubMed] [Google Scholar]
- Gentile G, Slotman M, Ketmaier V, Powell JR, Caccone A. Attempts to molecularly distinguish cryptic taxa in Anopheles gambiae s.s. Insect Molecular Biology. 2001;10:25–32. doi: 10.1046/j.1365-2583.2001.00237.x. [DOI] [PubMed] [Google Scholar]
- Gentile G, Della Torre A, Powell JR, Caccone A. Genetic differentiation in the African malaria vector, Anopheles gambiae s.s., and the problem of taxonomic status. Genetics. 2002;161:1561–1578. doi: 10.1093/genetics/161.4.1561. [DOI] [PMC free article] [PubMed] [Google Scholar]
- Gentile G, Santolamazza F, Fanello C, Petrarca V, Cacocone A, Della Torre A. Variation in an intron sequence of thee voltage-gated sodium channel gene correlates with genetic differentiation between Anopheles gambiae s.s. molecular forms. Insect Molecular Biology. 2004;13:371–377. doi: 10.1111/j.0962-1075.2004.00494.x. [DOI] [PubMed] [Google Scholar]
- Hackett BJ, Gimnig J, Guelbeogo W, Costantini C, Koekemoer LL, Coetze M, Collins FH, et al. Ribosomal DNA internal transcribed spacer (ITS2) sequences differentiate Anopheles funestus and An. rivulorum, and uncover a cryptic taxon. Insect Molecular Biology. 2000;9:369–374. doi: 10.1046/j.1365-2583.2000.00198.x. [DOI] [PubMed] [Google Scholar]
- Hudson RR. A new statistic for detecting genetic differentiation. Genetics. 2000;155:2011–2014. doi: 10.1093/genetics/155.4.2011. [DOI] [PMC free article] [PubMed] [Google Scholar]
- Hudson RR, Boos DD, Kaplan NL. A statistical test for detecting geographical subdivision. Molecular Biology and Evolution. 1992;9:138–151. doi: 10.1093/oxfordjournals.molbev.a040703. [DOI] [PubMed] [Google Scholar]
- Killeen GF, Fillinger U, Kiche I, Gouagna LC, Knols BG. Eradication of Anopheles gambiae from Brazil: lessons for malaria control in Africa? The Lancet Infectious Diseases. 2002;2:618–627. doi: 10.1016/s1473-3099(02)00397-3. [DOI] [PubMed] [Google Scholar]
- Knowles LL, Maddison WP. Statistical phylogeography. Molecular Ecology. 2002;11:2623–2635. doi: 10.1046/j.1365-294x.2002.01637.x. [DOI] [PubMed] [Google Scholar]
- Kristan M, Fleischmann H, Della Torre A, Stich A, Curtis CF. Pyrethroid resistance/susceptibility and differential urban/rural distribution of Anopheles arabiensis and An. gambiae s.s malaria vectors in Nigeria and Ghana. Medical and Veterinary Entomology. 2003;17:326–332. doi: 10.1046/j.1365-2915.2003.00449.x. [DOI] [PubMed] [Google Scholar]
- Lehmann T, Licht M, Elissa N, Maega BTA, Chimumbwa JM, Watsenga FT, Wondji CS, et al. Population structure of Anopheles gambiae in Africa. Journal of Heredity. 2003;94:133–147. doi: 10.1093/jhered/esg024. [DOI] [PubMed] [Google Scholar]
- Lounibos LP. Invasions by insect vectors of human disease. Annual Review of Entomology. 2002;47:233–266. doi: 10.1146/annurev.ento.47.091201.145206. [DOI] [PubMed] [Google Scholar]
- Lovejoy PE. Transformations in Slavery. 2nd edn. Cambridge: Cambridge Press; 2000. [Google Scholar]
- Manonmani A, Townson H, Adeniran T, Jambulingham P, Sahu S, Vijayakumar T. rDNA-ITS2 polymerase chain reaction assay for sibling species of Anopheles fluviatilis. Acta Tropical. 2001;78:3–9. doi: 10.1016/s0001-706x(00)00154-6. [DOI] [PubMed] [Google Scholar]
- Mesquita VHB. Contribuição para o estudo do sezonismo em. S. Tomé. Boletim Geral das Colónias. 1946;22:13–66. [Google Scholar]
- Mocumbi P. Plague of my people. Nature. 2004;430:925. doi: 10.1038/430925a. [DOI] [PubMed] [Google Scholar]
- Mukabayire O, Cornel AJ, Dotson EM, Collins FH, Besansky NJ. The tryptophan oxygenase gene of Anopheles gambiae. Insect Biochemistry and Molecular Biology. 1996;26:525–528. doi: 10.1016/s0965-1748(96)00026-4. [DOI] [PubMed] [Google Scholar]
- Mukabayire O, Caridi J, Wang X, Toure YT, Coluzzi M, Besansky NJ. Patterns of DNA sequence variation in chromosomally recognized taxa of Anopheles gambiae evidence from rDNA and single-copy loci. Insect Molecular Biology. 2001;10:33–46. doi: 10.1046/j.1365-2583.2001.00238.x. [DOI] [PubMed] [Google Scholar]
- Nchinda TC. Malaria: a reemerging disease in Arica. Emerging Infectious Diseases. 1998;4:398–403. doi: 10.3201/eid0403.980313. [DOI] [PMC free article] [PubMed] [Google Scholar]
- Parmakelis A, Russello MA, Caccone A, Brisola Marcondes C, Costa J, Forattini OP, Sallum M, Wilkerson RC, Powell JR. Historical analysis of a near disaster: Anopheles gambiae in Brazil. American Journal of Tropical Medicine and Hygiene. 2008;78:176–178. [PubMed] [Google Scholar]
- Pinto J, Sousa CA, Gil V, Ferreira C, Gonçalves L, Lopes D, Petrarca V, et al. Malaria in São Tomé and Príncipe: parasite prevalences and vector densities. Acta Tropica. 2000;76:185–193. doi: 10.1016/s0001-706x(00)00100-5. [DOI] [PubMed] [Google Scholar]
- Pinto J, Donnelly MJ, Sousa CA, Gil V, Ferreira C, Elissa N, Do Rosário VE. Genetic structure of Anopheles gambiae (Diptera: Culicidae) in São Tomé and Príncipe (West Africa): implications for malaria control. Molecular Ecology. 2002;11:2183–2187. doi: 10.1046/j.1365-294x.2002.01587.x. [DOI] [PubMed] [Google Scholar]
- Pinto J, Donnelly MJ, Sousa CA, Malta-Vacas J, Gil V, Ferreira C, Petrarca V. An island within an island: genetic differentiation of Anopheles gambiae in São Tomé, West Africa, and its relevance to malaria vector control. Heredity. 2003;91:407–414. doi: 10.1038/sj.hdy.6800348. [DOI] [PubMed] [Google Scholar]
- Posada D, Crandall KA, Templeton AR. GEODIS: a program for the cladistic nested analysis of the geographical distribution of genetic haplotypes. Molecular Ecology. 2000;9:487–488. doi: 10.1046/j.1365-294x.2000.00887.x. [DOI] [PubMed] [Google Scholar]
- Reimer LJ, Tripet F, Slotman M, Spielmann A, Lanzaro GC. An unusual distribution of the kdr gene among populations of Anopheles gambiae on the islands of Bioko, Equatorial Guinea. Insect Molecular Biology. 2005;14:683–688. doi: 10.1111/j.1365-2583.2005.00599.x. [DOI] [PubMed] [Google Scholar]
- Ribeiro H, Ramos HC, Pires CA. Sobre os vectores da malária em São Tomé e Príncipe. Garcia de Horta Serie de Zoologia. 1990;15:135–152. [Google Scholar]
- Rozas J, Sanchez-DelBarrio JC, Messeguer X, Rozas R. DnaSP, DNA polymorphism analyses by coalescent and other methods. Bioinformatics. 2003;19:2496–2497. doi: 10.1093/bioinformatics/btg359. [DOI] [PubMed] [Google Scholar]
- Simard F, Fontenille D, Lehmann T, Girod R, Brutus L, Gopaul R, Dournon C, et al. High amounts of genetic differentiation between populations of the malaria vector Anopheles arabiensis from West Africa and eastern islands. American Journal of Tropical Medicine and Hygiene. 1999;60:1000–1009. doi: 10.4269/ajtmh.1999.60.1000. [DOI] [PubMed] [Google Scholar]
- Slotman MA, Tripet F, Cornel AJ, Meneses CR, Lee Y, Reimer LJ, Thiemannan TC, Fondjo E, Fofana A, Traoré SF, Lanzaro GC. Evidence for subdivision within the M molecular form of Anopheles gambiae s.s. Molecular Ecology. 2007;7:168–171. doi: 10.1111/j.1365-294X.2006.03172.x. [DOI] [PubMed] [Google Scholar]
- Sperling FAH. Sex-linked genes and species differences in Lepidoptera. The Canadian Entomologist. 1994;126:807–818. [Google Scholar]
- Stump AD, Shoener JA, Costantini C, Sagnon N, Beshansky NJ. Sex-linked differentiation between incipient species of Anopheles gambiae. Genetics. 2005;169:1509–1519. doi: 10.1534/genetics.104.035303. [DOI] [PMC free article] [PubMed] [Google Scholar]
- Sunnucks P. Efficient genetic markers for population biology. Trends in Ecology and Evolution. 2000;15:199–203. doi: 10.1016/s0169-5347(00)01825-5. [DOI] [PubMed] [Google Scholar]
- Swofford DL. PAUP*: Phylogenetic Analysis Using Parsimony (* and Other Methods) Sunderland, MA: Sinauer Associates; 2002. [Google Scholar]
- Templeton AR. Nested clade analysis of phylogeographic data: testing hypotheses about gene flow and population history. Molecular Ecology. 1998;7:381–397. doi: 10.1046/j.1365-294x.1998.00308.x. [DOI] [PubMed] [Google Scholar]
- Templeton AR. Statistical phylogeography: methods of evaluating and minimizing inference errors. Molecular Ecology. 2004;13:789–809. doi: 10.1046/j.1365-294x.2003.02041.x. [DOI] [PubMed] [Google Scholar]
- Templeton AR, Sing CF. A cladistic analysis of phenotypic associations with haplotypes inferred from restriction endonuclease mapping. IV. Nested analysis with cladogram uncertainty and recombination. Genetics. 1993;134:659–669. doi: 10.1093/genetics/134.2.659. [DOI] [PMC free article] [PubMed] [Google Scholar]
- Templeton AR, Boerwinkle E, Sing CF. A cladistic analysis of phenotypic associations with haplotypes inferred from restriction endonuclease mapping. I. Basic theory and analysis of alcohol dehydrogenase activity in Drosophila. Genetics. 1987;117:343–351. doi: 10.1093/genetics/117.2.343. [DOI] [PMC free article] [PubMed] [Google Scholar]
- Templeton AR, Routman E, Phillips CA. Separating population structure from population history: a cladistic analysis of the geographical distribution of mitochondrial DNA haplotypes in the Tiger Salamander, Ambystoma tigrinum. Genetics. 1995;140:767–782. doi: 10.1093/genetics/140.2.767. [DOI] [PMC free article] [PubMed] [Google Scholar]
- Tenreiro F. A Ilha de São Tomé. Lisboa: Memórias da Junta de Investigação do Ultramar 2ª série n° 24; 1961. [Google Scholar]
- Torres EP, Foley DH, Saul A. Ribosomal DNA sequence markers differentiate two species of the Anopheles maculates (Diptera:Culicidae) complexes in the Philippines. Journal of Medical Entomology. 2000;37:933–937. doi: 10.1603/0022-2585-37.6.933. [DOI] [PubMed] [Google Scholar]
- Tripet F, Toure YT, Taylor CE. DNA analysis of transferred sperm reveals significant levels of gene flow between molecular forms of Anopheles gambiae. Molecular Ecology. 2001;10:1725–1732. doi: 10.1046/j.0962-1083.2001.01301.x. [DOI] [PubMed] [Google Scholar]
- Turner TL, Hahn MW, Nuzhdin SV. Genomic islands of speciation in Anopheles gambiae. PloS Biology. 2005;3:e285. doi: 10.1371/journal.pbio.0030285. [DOI] [PMC free article] [PubMed] [Google Scholar]
- Weill M, Chandre F, Brengues C, Mangum S, Akog-beto M, Pasteur N, Guillet P, et al. The kdr mutation occurs in the Mopti form of Anopheles gambiae s.s through introgression. Insect Molecular Biology. 2000;9:451–455. doi: 10.1046/j.1365-2583.2000.00206.x. [DOI] [PubMed] [Google Scholar]
- Wondji C, Simard F, Fontenille D. Evidence for genetic differentiation between the molecular forms M and S within the Forest chromosomal form of Anopheles gambiae in an area of sympatry. Insect Molecular Biology. 2002;10:11–19. doi: 10.1046/j.0962-1075.2001.00306.x. [DOI] [PubMed] [Google Scholar]
- Wondji C, Simard F, Petrarca V, Etang J, Santolamazza F, Della Toree A, Fontenille D. Species and populations of the Anopheles gambiae complex in Cameroon with special emphasis on chromosomal and molecular forms of Anopheles gambiae s.s. Journal of Medical Entomology. 2005;42:998–1005. doi: 10.1093/jmedent/42.6.998. [DOI] [PubMed] [Google Scholar]
- Yawson AE, McCall PJ, Wilson MD, Donnelly MJ. Species abundance and insecticide resistance of Anopheles gambiae in selected areas of Ghana and Burkina Faso. Medical and Veterinary Entomology. 2004;18:372–377. doi: 10.1111/j.0269-283X.2004.00519.x. [DOI] [PubMed] [Google Scholar]
Associated Data
This section collects any data citations, data availability statements, or supplementary materials included in this article.