

Abstract
Life history traits of wild animals can be strongly influenced, both phenotypically and evolutionarily, by hunting and fishing. However, few studies have quantified fishery selection over long time periods. We used 57 years of catch and escapement data to document the magnitude of and trends in gillnet selection on age and size at maturity of a commercially and biologically important sockeye salmon stock. Overall, the fishery has caught larger fish than have escaped to spawn, but selection has varied over time, becoming weaker and less consistent recently. Selection patterns were strongly affected by fish age and sex, in addition to extrinsic factors including fish abundance, mesh size regulations, and fish length variability. These results revealed a more complex and changing pattern of selective harvest than the ‘larger is more vulnerable’ model, emphasizing the need for quantified, multi-year studies before conclusions can be drawn about potential evolutionary and ecological effects of fishery selection. Furthermore, the results indicate that biologically robust escapement goals and prevention of harvest of the largest individuals may help prevent negative effects of size-selective harvest.
Keywords: fisheries management, fishery selection, harvest, life history evolution, Pacific salmon, size selection
Introduction
Anthropogenic activities have affected life history traits of a variety of species over time. Humans have domesticated animals and plants through selective breeding, producing individuals with specific traits deemed beneficial (Hazel 1950). Hunting and plant harvesting can have selective, evolutionary effects on wildlife behavior and wildlife and plant morphology (Skogland 1989; McGraw 2001; Harris et al. 2002; Coltman et al. 2003). Fishing can also be selective on certain life history traits; many types of fishing gear are designed to remove some individuals in preference to others (Todd and Larkin 1971; Hamley 1975; Law 2000; Kuparinen et al. 2009). Overall, human exploitation can cause significant changes to life history and morphological traits of wild populations, including fish (Darimont et al. 2009).
Fishing may be deliberately size-selective for economic and biological reasons. Larger fish are preferentially harvested to (i) avoid growth and recruitment overfishing, (ii) reduce harvesting and processing costs, and (iii) meet market demands for bigger fish (Walters and Martell 2004). The common phenotypic effect of fishing (i.e., reduction in mean age and size) is widely known (Trippel 1995; Hutchings 2004), but more recently the possible genetic effects of fishery selection on life history traits such as age and size at maturity have received attention (Policansky 1991; Law 2000; Olsen et al. 2004; Kuparinen and Merila 2007).
Experimental exploitation studies on captive Atlantic silversides (Menidia menidia) showed evolutionary effects of size-selective mortality on somatic growth, yield, and population biomass, among other traits (Conover and Munch 2002; Walsh et al. 2006). The researchers concluded that these effects were caused by selection of genotypes with variable growth rates. Among wild populations, significant reductions in age and size at maturity in many Canadian Atlantic cod (Gadus morhua) stocks coincided with dramatic decreases in abundance, and some scientists have suggested that heavy, size-selective fishing contributed to these life history changes (Hutchings and Myers 1994; Olsen et al. 2004).
Most forms of fishing gear can be size-selective, but few studies have quantified fishery selection (but see Sinclair et al. 2002; Carlson et al. 2007; Darimont et al. 2009). Such quantifications, though rare (Fenberg and Roy 2008), are necessary to reliably evaluate the consequences of fisheries-induced selection (Law 2007; Hutchings and Fraser 2008; Kuparinen et al. 2009). Comparison of the sizes and ages of fish that are caught with those that are not caught is essential for understanding the patterns of size selection, but such data are very difficult to obtain in most wild fish populations and fisheries. Gillnets are especially size-selective because a fish is only caught if it is small enough to enter the mesh but large enough to become entangled by it (Hamley 1975; Ricker 1981; Bromaghin 2005). However, selectivity curves for gillnets of specific sizes are difficult to determine, even with experimental fishing using gillnets of known mesh size (Todd and Larkin 1971). Additionally, the use of multiple sizes of gillnets, as is frequently the case in commercial fisheries, makes the gillnet selectivity curves even more difficult to estimate. Fishermen are often secretive about the sizes of gillnets they use and may change gear during a season. Finally, many characteristics of fish and fisheries can further complicate size selection patterns, including seasonal migration timing of components of fish stocks that differ in age and size, temporal variation in fishing schedule and intensity, and the efficiency of the fishery when open.
Studies of gillnet fishery selection on Pacific salmon (Oncorhynchus spp.) are aided by their anadromous and semelparous life history. All salmon that pass through the fisheries and migrate into freshwater (termed the ‘escapement’) are maturing adults. These salmon can be counted and sampled for size and age, and those data can then be directly compared with data on samples from the catch because little natural mortality or growth typically takes place during this brief period. Ricker (1981) used catch and escapement data from British Columbia, Canada populations of all five Pacific salmon species and reported that fishery selection contributed to decreasing trends in age and body size in many populations, though he noted that these traits are affected by numerous factors. Given the effects of density (i.e., competition) and climate on growth and age at maturity of salmon (e.g., Rogers and Ruggerone 1993; Pyper and Peterman 1999; reviewed in Quinn 2005), it is important to carefully document fishery selection patterns over sufficient time periods that enable evolutionary changes to occur before associating fisheries with life history trait changes.
In this study, commercial gillnet fishery catch and escapement data from 1946 to 2005 were used to quantify the magnitude and nature of selection on age and size at maturity for a commercially important and biologically diverse population complex of sockeye salmon (O. nerka) from the Nushagak District of Bristol Bay, southwest Alaska. This is an ideal study system because (i) there are long term data on size, age, and sex of sockeye in both the catch and the escapement; (ii) the fishery exploits a large percent of the run each year; and (iii) excellent records on the management of the fishery have been maintained over time, allowing us to examine the effects of covariates on the magnitude and direction of selection.
Our study differs from others in several important ways. First, few studies have quantified harvest selection in wild populations over the extended time periods needed to assess possible long term effects. Previous studies in Bristol Bay, for example, only examined data over short time periods (Burgner 1964; Bue 1986; Hamon et al. 2000). Most commercial fisheries occur over long time periods and experience many changes in environmental conditions, fishing technologies, and management schemes, so variation in selection may occur for a number of reasons. Darimont et al. (2009) postulated that harvest selection can be a consistent force, and we wanted to explore annual patterns of selection over many years on a wild population. Second, in many harvest selection studies, only the ages and sizes of individuals that are caught are known; life history traits of individuals that are not caught are unidentified or only indirectly estimated (but see Carlson et al. 2007; Edeline et al. 2007; Swain et al. 2007). In this study we documented in detail the traits of both the catch and the escapement.
We employed traditional methods to calculate yearly selection metrics, including selection differentials and vulnerability profiles, and we measured long term trends in these metrics. Using this information we first determined whether the fishery has been generally size-selective over the past six decades. We then assessed the extent to which this selection has changed over the period of record, considering specifically the effects of changes in gear, fishing rate, and average fish body size. We did not seek to determine explicitly whether fishery selection in this system is leading to changes in age and size at maturity, as that topic can only be fully addressed after the selection itself has been quantified (Hutchings and Fraser 2008), and the effects of selection are integrated with the environmental factors that also affect growth and maturation. However, we present data to help assess the possible evolutionary and ecological consequences of the size-specific fishing pressure at a basic level.
Materials and methods
Site description and history of the fishery
Bristol Bay, located in southeast Bering Sea (Fig. 1), produces one of the most abundant and biologically diverse sockeye salmon runs in the world, and these salmon have been exploited by a commercial gillnet fishery since 1884 (Bue 1986). The recent 25-year average total run size was 35 million fish, with an average annual catch of 24 million. Our research focused on the Nushagak Fishing district (Fig. 1). Sockeye salmon migrate through the Nushagak Bay on their way to spawn in three separate basins: the Igushik, Nushagak, and Wood River systems (Fig. 1). One other basin, the Snake River, is so small and supports so few salmon that it is not considered. Most sockeye salmon spawning in these systems spend 1 or, less frequently, 2 years rearing in lakes before migrating to sea, where they spend 1–4 (typically 2 or 3) more years, returning in June-July and spawning in July-September (Quinn et al., in press).
Figure 1.
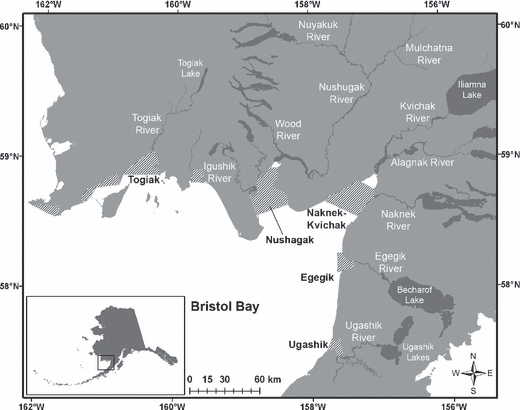
The five fishing districts, and associated freshwater systems, of Bristol Bay, Alaska, including the Nushagak District.
The history of the Bristol Bay sockeye fishery is well documented and knowledge of its management and its many changes allows greater understanding of the nature of fishery selection. Commercial fishing began in the 1880s using fish traps and gillnets fished from wooden sailboats. Motorized boats were not permitted until 1951, at which time 32 feet was fixed as their maximum length. Motorized vessels have evolved with technology, though the length regulation remains in effect (Link et al. 2003).
Mesh size has been regulated in Bristol Bay since 1924, first at a minimum of 5¾ inches (146 mm) and then, in 1962, at a minimum of 5⅜ inches (136.5 mm) to lessen fishing pressure on larger sockeye. These early regulations were intended to increase profitability without reducing spawning success by increased the catch of longer sockeye, including more males, and allowed smaller fish, mostly females, to escape (Bue 1986; Link et al. 2003). After the 1984 season, minimum gillnet mesh size regulations were ended and, since then, for the majority of the season, mesh size is not standardized, though in some years regulations to reduce exploitation of Chinook salmon (O. tshawytscha) are enacted for short periods of time (Tim Sands, Alaska Department of Fish and Game, pers. comm.). Net material also influences its selective nature and has changed over time. Prior to 1951 most gillnets were made of cotton or linen twine, which caught fish of a narrow size range. Multi-strand nylon web gillnets came into use in 1952, followed by multi-strand nylon monofilament web in 1981. These materials were superior to cotton and linen, catching more fish of a greater range of sizes because they were lighter, more transparent, and more elastic (Bue 1986).
Since the 1950s the Bristol Bay sockeye salmon fisheries have been managed to achieve an escapement goal based on the carrying capacity of the system for spawning by adults and rearing by juveniles (Link et al. 2003). Managers closely monitor catch, effort, and escapement on a daily basis. Fisheries are opened conservatively based on predicted run timing to ensure that escapement goals are met; after that, fisheries are opened to a greater extent. Therefore, fishing rate often changes over the course of the season (Quinn et al. 2007). The fishery has also seen different levels of sockeye abundance over time, and the varying proportions of the run being caught may affect selectivity. Since 1946, 19–86% of the annual sockeye salmon run in the Nushagak District was caught, with an average harvest of 54% (Fig. 2). This harvest percentage was high in the first years of this dataset, decreased in the 1960s and 1970s, and has been increasing since the late 1970s. Changing ocean environments and other factors caused increased sockeye salmon runs to Bristol Bay after 1978, also escalating catch rates (Hilborn et al. 2003).
Figure 2.
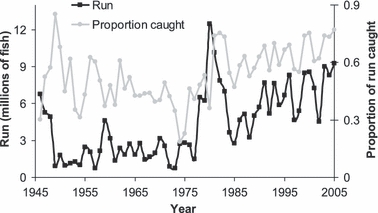
Number of sockeye salmon in the Nushagak District run and proportion of the run caught by the fishery, 1946–2005.
Data collection
Since 1946 scientists and fishery managers have estimated the Nushagak District sockeye salmon catch and escapement, and collected age, sex, and length (ASL) data on individual fish on a daily basis throughout the fishing and escapement periods. At fish processing plants, catch numbers are estimated and a sample (range: 1065–6643 fish per year) is measured for length and weight, scales are collected to be read for age determination, and sex of each fish is recorded. The Wood, Nushagak, and Igushik rivers have counting towers or sonar devices to enumerate upstream migrating salmon that have escaped the fisheries. Beach seine nets, which collect adults of all sizes, are used to sample the escapement for ASL data each day (range: 150–3542 fish per year per river).
Daily catch and escapement counts were available from 1946 to 1959 but raw ASL data were not available during this time. Length frequency data were estimated for these years by Mathisen et al. (1963) by measuring a sample of the salmon for ASL and expanding these by the overall counts during the sampling time periods. Therefore, from 1946 to 1959 these calculations, rather than data on individual fish, were used to characterize fishery selection. No data were available from 1960 to 1962, and daily counts and ASL data from individual fish were used from 1963 to 2005.
Length and age characterization
We used the yearly ASL data to characterize length and length at age for all sockeye salmon in the Nushagak District, treating males and females separately. Because sockeye salmon of different ages, sizes, and sexes may enter the fishery and migrate upriver at different times (older and larger fish generally enter earlier; Quinn 2005) and fish abundance varies greatly throughout the season, it would be imprecise to average length and age data on a seasonal basis to characterize the catch and escapement. Therefore, daily ASL data were used to estimate the distribution and abundance of all sockeye sizes and ages by weighting the number of fish sampled daily of a given age, length, and sex by the total number of caught or escaped on that day. On days when ASL data were not collected, we estimated sockeye salmon length by interpolation from adjacent days with data. We characterized the age, sex, and length of all individuals escaping into each of the three rivers to avoid biases resulting from variation in proportions migrating to each river among years. To calculate the total escapement on a given day, we summed the escapement from each of the three rivers.
We first performed analyses on fish of all ages and then grouped fish by the number of years that they had been in the ocean (ocean age). Because salmon put on >99% of their weight at sea, ocean age largely determines their overall size (Quinn 2005), and thus vulnerability to being caught in a gillnet. The most common ocean ages in these populations are 2 and 3 years. If <40 fish of each of these ages were examined for ASL within a given year for the escapement into any of the three river systems, calculations were not made for that year. To calculate the total number of fish being caught or escaping of a given age, we multiplied the total catch or escapement by the proportion of fish of a given age group on a daily basis. We assumed that fish of all sizes and age groups, had, on average, equal contact with the fishery (i.e., opportunity to get caught) in a given year and that differential fishing mortality was due to the effects of the gillnet fishery rather than some other attribute, such as migration route. Fishing occurs throughout the Nushagak fishing district, close to shore and in the open water, and the fishery is very effective at catching fish (Tim Sands, Alaska Department of Fish and Game, pers. comm.), supporting this assumption. Doctor (2008) provided evidence of subtle differences in migration timing among some populations within the Nushagak Fishing district but this complex, like others in Bristol Bay, is characterized by compressed migration timing and broad overlap among the components.
Analyses
For each year that data were available, we calculated exploitation ratio (total proportion caught) for fish of each age group (all ages, ocean age 2, and ocean age 3) and sex on a yearly basis (Py,a,s) (equation 1).
| (1) |
Where Cy,a,s is the number of fish of a certain age and sex caught in a given year and Ey,a,s is the number of fish of a given age and sex in the escapement in that year. We used P ≤ 0.05 for significance. We also created yearly length and length at age frequency histograms (in 10 mm bins) of sockeye salmon in the catch and escapement to reconstruct their distribution in the total run. Next we constructed yearly gillnet vulnerability profiles for each sex and age group showing, for each length bin, the proportion of fish that were caught (Lagler 1968). Proportions caught were calculated for a given length and age (Py,a,l; equation 1). For each year, proportions were scaled to 1 by dividing the proportion for each length by the maximum proportion within that year, allowing comparisons between years. The proportion caught was calculated only for length bins for which more than 3000 fish of all ages or 2000 fish of ocean ages 2 or 3 were caught on a given day to prevent inaccurate results due to small sample sizes.
We calculated yearly length-based standardized selection differentials (SSDy) for each sex and ocean age (equation 2). This value is the difference in mean length of fish in the run ( , where
  ) versus those in the escapement (
 ) (i.e., before versus after fishing) (Law and Rowell 1993) divided by the standard deviation of length of fish in the run (
 ) to allow comparison between years.
| (2) |
Confidence bands about the vulnerability profiles and SSDs were determined by bootstrapping the ASL data on a daily basis, with 500 replicates per year (0.025 and 0.975 quantiles of the replicates).
To better understand how changing fishery management, run size, fish size, and catch levels have affected selection over time, we performed ordinary least squares regression analysis of the form:
| (3) |
These models regressed SSDs and year-specific subsets of the following factors: (i) gillnet mesh size regulations (as a categorical variable), (ii) run size, (iii) length deviation from the long term average, and (iv) date at which half of the total catch is reached (‘catch date,’ which describes fishery timing). All regressions were performed for fish of each sex and ocean ages 2 and 3 separately because these groups were selected differently by the fishery. Interactions among all factor combinations were examined for significance along with temporal autocorrelation, and the best models were chosen based on Akaike Information Criterion with a second order correction for small sample sizes (AICc) (Burnham and Anderson 2002) and R2 values. AICc values show how well a model fits the data without being overparameterized and R2 values show how much of the variation in the data is explained by each model. We picked the model that had the lowest AICc value and used the R2 value to support these decisions.
Results
Length frequency histograms showed variation in the length and length at age distributions of males and females over time. As expected, ocean age 3 fish were longer than ocean age 2 fish and males were longer than females for a given age, though overlap was observed among these groups. Patterns of catch and escapement length distributions have also varied greatly among years, suggesting differing patterns of fishery selection.
Total yearly exploitation rates, or proportions of the fish that were caught, increased significantly over the years for males and females and fish of all age groups (P < 0.05; Fig. 3), but they increased more for ocean age 2 fish (of both sexes) than for ocean age 3 fish. In most years, the proportion of males caught was higher than that of females. This difference was attributable to ocean age 2 fish; from 1963 to 2005, an average of 51% of ocean age 2 males were caught compared to 42% of ocean age 2 females. For ocean age 3 fish, an average of 62% of males and 64% of females were caught, and on average 57% of males and 54% of females of all ages were caught.
Figure 3.
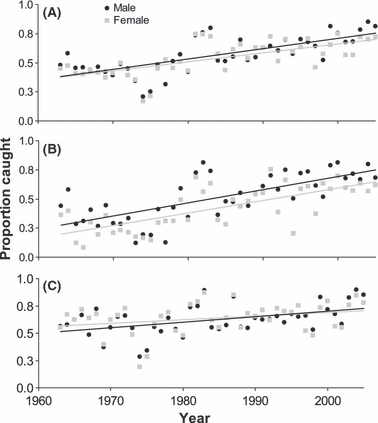
Proportion of the Nushagak District sockeye salmon run caught of (A) all ages, (B) ocean age 2, and (C) ocean age 3 as a function of ocean age and sex, 1963–2005.
Vulnerability profiles revealed significant differences by length within and between sex and age groups over time (Fig. 4), 1S. For females of all ages, longer fish (>550 mm) were most vulnerable during earlier years, indicating directional selection favoring smaller fish (Fig. 4A). In later years vulnerability peaked at medium-long lengths, indicating disruptive selection favoring shorter and also the very longest fish. In only 2 years, 1991 and 2001, vulnerability was highest for the shortest females (<450 mm) and decreased for longer fish. Vulnerability profiles for males of all ages were generally similar to those of females (Fig. 4B). However, in most years, even the early ones, the longest males (>600 mm) were less vulnerable than the longest females, and male vulnerability curves peaked for the medium-long fish rather than the longest. This suggests that fishery selection on males has been less directional and more disruptive, compared to females. In recent years vulnerability curves have been bell shaped.
Figure 4.
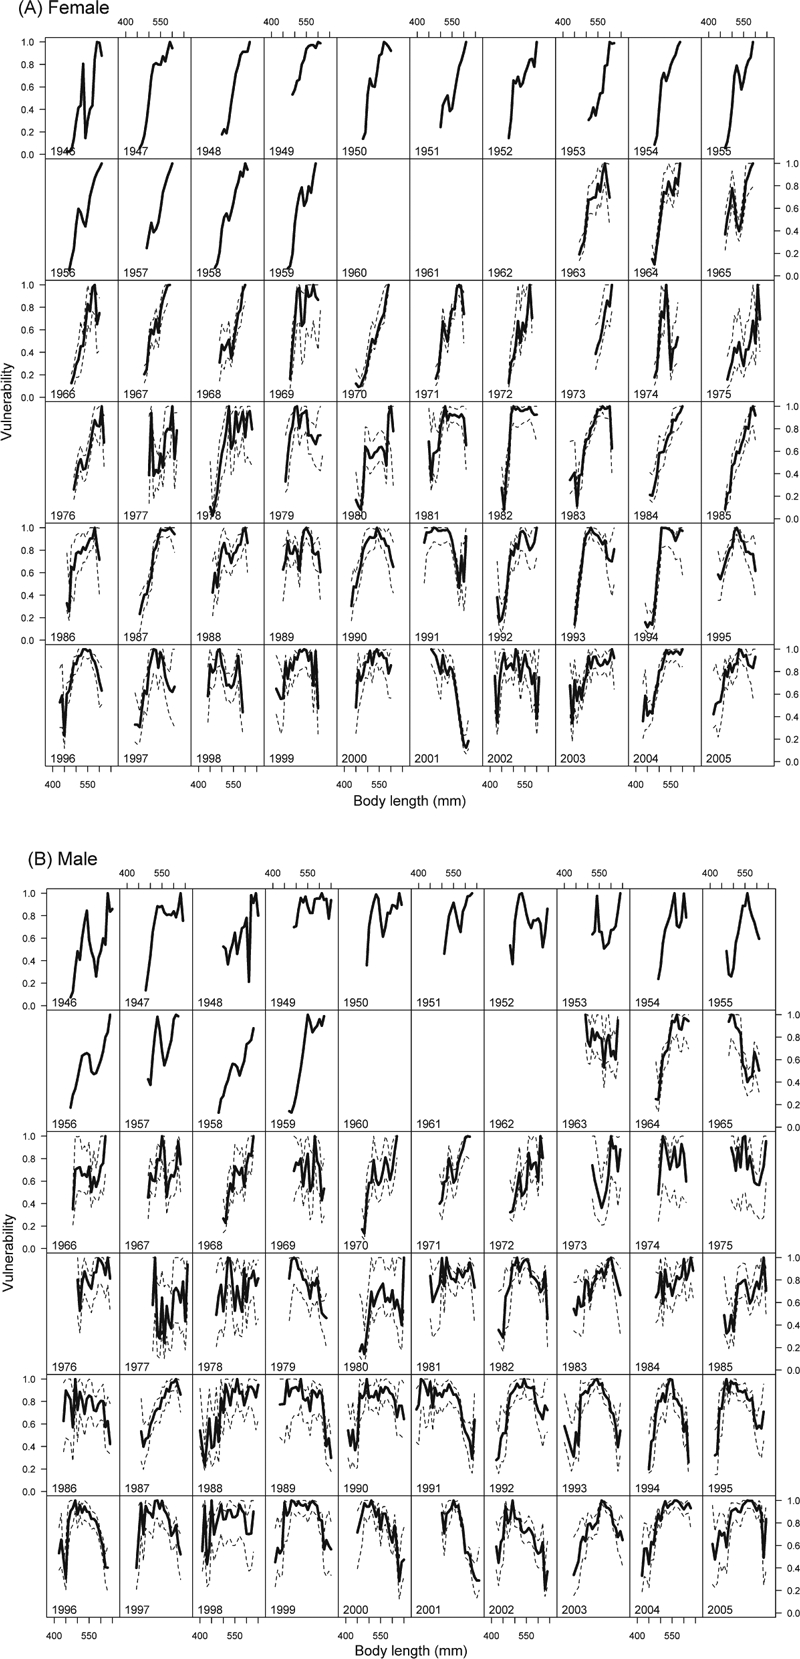
Length vulnerability profiles of female (A) and male (B) sockeye salmon of all ages from 1946 to 2005 in the Nushagak District. Dotted black lines indicate the 95% confidence intervals; data were insufficient for calculations in the early years.
We found inconsistent patterns of vulnerability to the fishery over time for ocean ages 2 and 3 sockeye salmon. Longer ocean age 2 fish were, in many years, most vulnerable to the fishery. However, in other years vulnerability profiles were dome-shaped or showed that shorter fish were most vulnerable. In the early years (<1979 for females, <1973 for males), longer ocean age 3 fish were consistently more vulnerable than smaller fish. This pattern then weakened for both sexes, and in the later years smaller fish were most vulnerable, especially males. The different size selection patterns between ocean age 2 and 3 fish were consistent with the greater size of the ocean age 3 fish. However, the overlap in length distributions of the two ages and the generally greater length of males than females made overall fishery vulnerability patterns complicated. Thus, the fishery has been size-selective but the most vulnerable length was not always the largest; it depended on the combination of year, sex, and age of the fish.
In 91% of the years (52 of 57), SSDs for female sockeye salmon of the Nushagak District were negative, indicating that the fishery was catching longer than average fish (Fig. 5A). However, SSDs for females have decreased in magnitude over time and in some recent years they have been positive. Male sockeye SSDs were smaller than those of females. In the early years nearly all male SSDs were negative. However, since 1965 positive or 0 SSDs were evident in many years, showing that length selection has become weaker and less directional.
Figure 5.
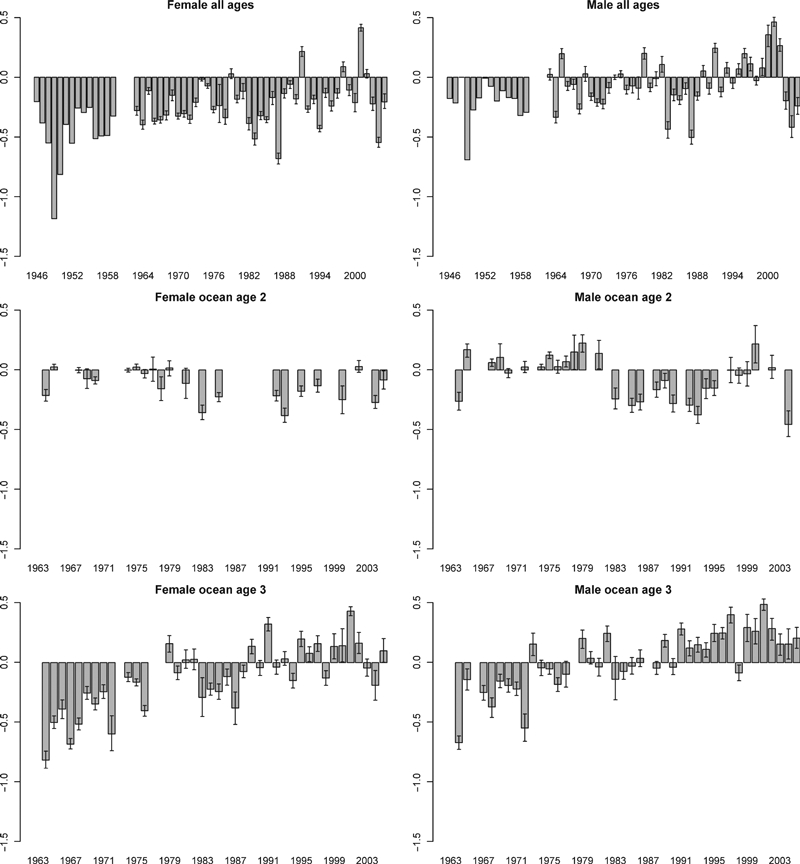
Standardized selection differentials for female and male sockeye salmon of all ages (1946–2005) and ocean age 2 and 3 (1963–2005) of the Nushagak District. Error bars represent 95% confidence intervals.
Ocean age 2 females that escaped to spawn were, for the most part, shorter than fish in the run as a whole (i.e., before fishing; Fig. 5B). In 17 of the 22 (77%) years with data, SSDs were less than 0. Fishery selection patterns for ocean age 2 males varied more through time. Selection changed direction in 1982. In 85% of the years (11 of 13) before that year SSDs were positive, indicating that on average shorter males were caught than escaped. However, after 1982 SSDs were mostly negative (in 88% of years), so longer males were caught. In the most recent years, the selective trend has weakened and become variable. Size selection on females and males of ocean age 3 was inconsistent over time (Fig. 5C). For females, in earlier years (<1979) all SSDs were negative, but in 14 of 27 (52%) years since then SSDs were positive. A similar long term pattern was revealed for males. Before 1973, all 8 years with data had negative SSDs but since then SSDs were positive in most years (20 of 31 or 65%).
Regression models were consistent for male and female sockeye salmon of the same age group (Table 1). Factors most often included in the best fit models to explain SSDs included gillnet mesh size regulation, run size, and fish length deviation from the long term average. No significant interactions were found among parameters. For ocean age 2 fish, the best models included length deviation from the long term average and gillnet mesh size regulation. R2 values ranged from 0.3 to 0.35. SSDs increased, becoming more positive (signifying weaker selection on big fish), as length deviation increased, mesh size decreased, and abundance of salmon increased. More complex models, which had higher R2 values of 0.54–0.56, including (i) both gillnet mesh size regulation and run size and (ii) mesh size regulations, run size, and length deviation, explained selection best for ocean age 3 sockeye; the factors affected SSDs in the same way they did for ocean age 2 fish. Significant first-order temporal autocorrelation was found for SSD regressions of ocean age 2 male fish. However, such autocorrelations were not detected for females of any age, nor for ocean age 3 males, so we did not analyze this factor further.
Table 1.
Models that best predicted standardized selection differentials (SSDs) for sockeye salmon in the Nushagak District, 1963–2005, based on AICc and R2 values
| Group | Model | ΔAICC | R2 | How SSD is affected (+ means SSD increased) |
|---|---|---|---|---|
| Ocean age 2 females | Length deviation | 0 | 0.301 | + as length deviation increases |
| Length deviation & run size | 0.905 | 0.349 | + as run size increases | |
| Gillnet mesh size regulation & run size | 1.381 | 0.335 | + as gillnet mesh size decreases | |
| Ocean age 2 males | Length deviation & AR1 | 0 | 0.306 | + as length deviation increases |
| Gillnet mesh size regulation & AR1 | 0.444 | 0.3 | + as gillnet mesh size decreases | |
| Gillnet mesh size regulation, length deviation, & AR1 | 1.385 | 0.328 | + as run size increases | |
| Ocean age 3 females | Gillnet mesh size regulation & run size | 0 | 0.537 | + as gillnet mesh size decreases |
| Gillnet mesh size regulation, run size, & length deviation | 1.774 | 0.545 | + as run size increases + as length deviation increases | |
| Ocean age 3 males | Gillnet mesh size regulation & run size | 0 | 0.54 | + as gillnet mesh size decreases |
| Gillnet mesh size regulation, run size, & length deviation | 0.463 | 0.562 | + as run size increases + as length deviation increases |
AICc, Akaike Information Criterion with a second order correction; AR1, significant first-order autocorrelation coefficient.
Discussion
Our study fills a need for quantifying the intensity of harvest selection and estimating selection differentials directly (Law 2007; Kuparinen et al. 2009). Examination of age- and size-selective harvest of sockeye salmon in a commercial gillnet fishery over 57 years revealed higher susceptibility and exploitation of older and larger fish in most years. This overall result confirmed the general belief that ‘larger is more vulnerable,’ but the details of our findings revealed a much more intricate and variable pattern of exploitation and vulnerability (Fig. 5).
Sockeye salmon runs with varying sex ratios and proportions of age classes experienced different selection patterns due to sex- and age-specific difference in fishery selectivity. The gillnet vulnerability curve and the selectivity of the fishery depend on the size distribution of fish that encounter the nets. In the Nushagak District fishery, age composition, and thus length frequency, can change dramatically from year to year due to ocean conditions and the strength of different brood years, which can affect the vulnerability curves and size-selectivity. In most years more males than females and more ocean age 3 than ocean age 2 fish were caught (Fig. 3). Fishery selection was strongly directional in the early years (1946–early 1970s); longer fish were more vulnerable to the fishery than smaller fish (Fig. 4). However, during and after the 1970s size selection became less directional and more disruptive, especially for males; fish of intermediate lengths have been the most vulnerable. In many years more large females were caught than large males (Figs 4 and 5) because male sockeye salmon are, on average, longer than females. Recently, the magnitude of fishery selection has decreased and the fishery has not consistently selected for or against fish of a given length (Fig. 5).
In this fishery, gillnet mesh size regulations, salmon abundance, and deviation in fish length from long term average were the most important variables affecting selectivity (Table 1). When salmon were very numerous, larger fish experienced less selection than in years when there were fewer fish. The likely explanation is that when salmon were abundant the overall exploitation increased (because the number allowed to escape to spawn is fixed) and so the more intense fishing pressure caught more fish of all sizes. Thus, paradoxically, exploitation rate and selection were inversely related. The effects of gillnet mesh size regulations were more obvious; mandates for larger mesh sizes and regulations prohibiting the use of smaller mesh increased the catch of larger fish. Finally, in years when the fish were larger, the largest fish tended to escape, likely because they were too big to be caught. Short-term variability in size-selection patterns was due to different combinations of these factors. Delta AIC values were <2 for all models shown in Table 1, indicating that each had similar support. For female fish, significant interactions were detected between year and length deviation and between year and run size. No interactions with year were detected for males. This suggests that for females, the effects of length deviation and run size on selectivity varied over time.
Just as age composition and length frequency changes can affect fishery selection patterns, changes in population composition over time can also contribute. Different patterns of fishery selection and exploitation will be revealed at different spatial scales. Assessing fishery selection on a fishing district scale is important because that is the level at which management actions occur (Minard and Meacham 1987). Examining harvest selection on a population-level scale is important because that is the scale at which many processes of natural and sexual selection act. Yearly estimates of the proportion of each spawning population passing through the fishery are not available. However, catch and escapement for the three main rivers that drain into the Nushagak district (thus a finer spatial scale than the district as a whole but not as fine as discrete spawning populations) have been estimated (ADFG unpublished data; Kendall and Quinn, in press; Branch and Hilborn, In review). To assess how different proportions of fish returning to these river influenced fishery selection, we quantified the run size for each watershed and included the proportion of the run migrating to the Wood River system (the watershed typically with the largest run size) as an additional parameter in our linear regressions of Nushagak district-wide SSDs. We found that for females, but not males, the proportion of the run heading to the Wood River was a significant parameter in models explaining SSDs. This suggests that changes in population composition over time can influence fishery selectivity patterns. We also extended our fishery selection quantification to the finer spatial scale, quantifying population-specific exploitation rates, SSDs, and vulnerability profiles (Kendall and Quinn, in press). These analyses revealed that fishery selection and exploitation have not been uniform on populations that differ in average age and length.
A long term, decadal perspective of harvest selection on a wild population is necessary to understand potential genetic changes that can result. Short term studies may draw incomplete conclusions about the selective nature of harvest, and studies that examine only life history or morphological endpoints of wild populations (e.g., Yoneda and Wright 2004; Hamilton et al. 2007) may not reveal annual variability and intermediary processes within a population that can have broader ecosystem impacts. For example, Burgner (1964) found that gillnets in the Nushagak District fishery were highly selective on larger, ocean age 3 fish, particularly females during 1946–1959. Since then the fishery has been less consistent. Thus, using only Burgner's results may produce different conclusions about fishery selection patterns and their potential implications than are indicated by a longer perspective.
Much recent research has focused on evolution of life history traits in wild fish stocks, both marine and freshwater (Law 2000; Olsen et al. 2004; Swain et al. 2007), and in wildlife (Coltman et al. 2003) due to size-selective harvest. In some studies size-selectivity was not directly measured but was assumed to be directional due to gear type used. Our results demonstrate that even when size-selective gear is used and a large proportion of the stock is exploited, harvest selection is not necessarily consistent or predictable. Thus, in modeling the effects of fishery and harvest selection and understanding ecosystem effects of such exploitation, scientists and managers cannot assume consistent, directional selection and the consequences of such.
In general, large size at seawater entry or rapid early growth at sea results in early age at maturation, and the older (and ultimately larger) fish are the slower-growing members of the cohort. The effects of disruptive harvest selection on norms of reaction are further complicated by differences in selection between males and females, resulting in uncertain overall consequences for the fish. Thus, the variable nature of fishery selection over time in the Nushagak District fishery, and likely many other fisheries, may hinder evolution of fish towards an optimal life history. An additional consideration is that there are many spawning populations within the Nushagak District that were sampled collectively in our study. Here we have assessed fishery selection at the fishing district scale and grouped all populations together. However, these populations have consistent differences in average age at maturity and length at age, and so their patterns of exploitation and selection also vary (Kendall and Quinn, in press).
We estimated length-based gillnet fishery selection, but a fish's girth probably has more influence on its vulnerability to a gillnet rather than length per se. Unfortunately, girth data are not available in the Nushagak District, nor are they in many fisheries’ data sets, and they cannot be calculated from the available data. Regier (1969) found that unless precise girth measurements can be taken at the mesh mark, it is better to use length to understand fishery selection. Still, girth is an important consideration in fishery selectivity, and because male and female salmon of the same length may have a different girth and shape, the actual selectivity patterns of male and female salmon may differ from those estimated from length data.
Our results revealed that the Nushagak District fishery has caught longer than average fish during most of the past 60 years. Might such selection affect the ecological and evolutionary health of the stock? From an ecological standpoint, beyond the reduction in abundance of spawning adults that inevitably results from fishing, size-selective fishing can reduce per capita productivity if the small fish that survive to breed produce fewer eggs than would have been produced by the prefishery size distribution. Using the mean and maximum selection differentials observed for female sockeye salmon in the Nushagak District, we estimated the decrease in egg production by females of average length due to such fishery selection using extensive length-fecundity data from the Wood River system (Quinn et al. 1995 and T.P. Quinn, unpublished data). The average fishery selection differential from 1946 to 2005 was −8 mm, reducing the fecundity of an average female by only 5% (104 eggs). At the greatest observed selection differential (−29 mm), the average female spawner would have 12% fewer eggs. There are undoubtedly other kinds of ecological effects of size-selection (for example, larger females dig deeper nests than smaller females; Steen and Quinn 1999) but these lines of evidence suggest that the numerical consequences of the selective fishery in this system have not been great.
From an evolutionary viewpoint, it is of great interest whether Nushagak District sockeye salmon, and others subject to size-selective harvest, have become smaller and younger as a direct result of such harvest. However, such consequences are difficult to determine for numerous reasons. Size selection patterns by the Nushagak fishery, and likely many other fisheries, have varied over time, in part due to stochasticity of environmental and management conditions. In addition, they have also been affected by variation in population contribution over time (Kendall and Quinn, in press). Size and age at maturity of adult salmon are influenced by many factors, including but not limited to density of conspecifics, density of other salmon species, and ocean conditions (Rogers and Ruggerone 1993; Pyper and Peterman 1999; Ruggerone et al. 2003). Thus, evolutionary effects of fishing cannot be revealed without careful consideration of the many factors affecting growth and maturation. Calculation of probabilistic maturation reaction norms (Dieckmann and Heino 2007) is a way to integrate these effects with fishery selection (e.g., Fukuwaka and Morita 2008).
Also from an evolutionary perspective, fish whose maturation size coincides with that of maximum vulnerability to its fishery could adjust their size or age to reduce the probability of being caught. A fish could either slow or increase growth while maturing at its ‘given’ age or mature at an earlier or later age and thus at a different size. Overall, the Nushagak District fishery has caught larger than average, but not the largest, sockeye salmon. In general this corresponds to large ocean age 2 fish and smaller ocean age 3 fish, and thus to reduce the probability of being caught, ocean age 2 fish should grow slower and ocean age 3 fish should grow faster. This would seem to require a complex change in the reaction norm between growth and probability of maturation that controls variation in age and size within and among populations (Quinn et al., in press).
Nushagak District sockeye salmon have become both longer and older in recent decades (Fig. 6; P = 0.0004 and R2 = 0.27 for age of males, P = 0.07 and R2 = 0.09 for age of females), consistent with the hypothesis that density-dependent effects in the ocean depress growth and result in a phenotypic shift in age at maturation (Pyper et al. 1999; Holt and Peterman 2004). This finding is inconsistent with the expectation that fisheries-induced evolution causes harvested fish populations to become shorter and younger, as was expressed for iteroparous species (Law and Grey 1989). However, the effects of such evolution on anadromous, semelparous fishes such as Pacific salmon may be different and should be explored further.
Figure 6.
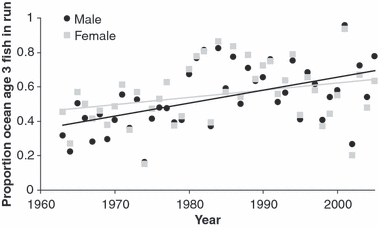
Proportion of ocean age 3 sockeye salmon in the Nushagak District run (the vast majority of the remaining fish are of ocean age 2), 1963–2005.
For fish and wildlife populations under size-selective exploitation, it may be important to maintain large numbers of phenotypically diverse breeders to buffer against the detrimental effects of selection (Darimont et al. 2009). The Nushagak District fishery is managed using biologically-robust escapement goals, which have been increasing in recent years, allowing more sockeye salmon onto the spawning grounds. The Wood River system of the Nushagak District (Fig. 1) met or exceeded its escapement goal in 85% of the years from 1962 to 2005 (Tim Baker, Alaska Department of Fish and Game, pers. comm.). Additionally, for most of the past 60 years, the fishery has not harvested the biggest fish returning to spawn, benefiting the Nushagak District stocks in the short- and long-term (Law 2007). The suite of populations thus seems to be very healthy, to the benefit of the ecosystems that depend on them (Naiman et al. 2002). Thus, the biologically robust escapement goals used to manage the fishery and prevention of harvest of the largest individuals may contribute to the weaker and less consistent size-selectivity in recent years. Such escapement goals and gear that spares the largest individuals may be included in a manager's toolbox to prevent negative effects of size-selective harvest.
Finally, fishery and natural, including sexual, selection may act in opposition (Carlson et al. 2007; Hutchings and Rowe 2008), and evolutionary trait changes may result from their combined effects (Edeline et al. 2007). For Bristol Bay sockeye salmon and many other species, age at maturity and length at age result from a blend of natural, sexual, and anthropogenic selection. Ecological processes on the spawning grounds that favor large individuals may compensate to some degree for the reduction in the overall numbers of these individuals. The fact remains the larger than average fish have been harvested in most years from the Nushagak District sockeye salmon stock. The effects of such harvest selection on wild populations must be examined from many angles, and conclusions must be drawn using long term studies that incorporate ecological, ecosystem, and evolutionary considerations.
Acknowledgments
We thank the late Donald Rogers for suggesting this line of investigation, and many of his insights were supported by our analyses. Funding support from the National Science Foundation's Biocomplexity Program, the Gordon and Betty Moore Foundation, and the Pacific Seafood Processors Association is gratefully acknowledged. We also thank the Alaska Department of Fish and Game for long term data. N.K. received funding from the Lauren R. Donaldson, Melvin G. Anderson, and John G. Peterson Scholarships and the H. Mason Keeler Endowment to the School of Aquatic and Fishery Sciences at the University of Washington. This manuscript was improved by comments from Mikko Heino, Ray Hilborn, Craig Primmer, and four anonymous reviewers.
Literature cited
- Branch TA, Hilborn R. A general model for reconstructing salmon runs. Canadian Journal of Fisheries and Aquatic Sciences. In review. [Google Scholar]
- Bromaghin JF. A versatile net selectivity model, with application to Pacific salmon and freshwater species in the Yukon River, Alaska. Fisheries Research. 2005;74:157–168. [Google Scholar]
- Bue BG. Effects of Gill Net Selectivity on Sockeye Salmon in the Egegik and Naknek-Kvichak Districts, Bristol Bay, Alaska. Fairbanks, AK: University of Alaska; 1986. Masters of Science thesis. [Google Scholar]
- Burgner RL. Net Selectivity in Relation to Spawning Populations of Nushagak Sockeye Salmon. Seattle, WA: University of Washington, College of Fisheries; 1964. Research in fisheries contribution 166. [Google Scholar]
- Burnham KP, Anderson DR. Model Selection and Multimodel Inference: A Practical Information-Theoretic Approach. New York: Springer; 2002. [Google Scholar]
- Carlson SM, Edeline E, Vollestad LA, Haugen TO, Winfield IJ, Fletcher JM, James JB, et al. Four decades of opposing natural and human-induced artificial selection acting on Windermere pike (Esox lucius. Ecology Letters. 2007;10:512–521. doi: 10.1111/j.1461-0248.2007.01046.x. [DOI] [PubMed] [Google Scholar]
- Coltman DW, O'Donoghue P, Jorgenson JT, Hogg JT, Strobeck C, Festa-Blanchet M. Undesirable evolutionary consequences of trophy hunting. Nature. 2003;426:655–658. doi: 10.1038/nature02177. [DOI] [PubMed] [Google Scholar]
- Conover DO, Munch SB. Sustaining fisheries yields over evolutionary time scales. Science. 2002;297:94–96. doi: 10.1126/science.1074085. [DOI] [PubMed] [Google Scholar]
- Darimont CT, Carlson SM, Kinnison MT, Paquet PC, Reimchen TE, Wilmers CC. Human predators outpace other agents of trait change in the wild. Proceedings of the National Academy of Sciences USA. 2009;106:3. doi: 10.1073/pnas.0809235106. [DOI] [PMC free article] [PubMed] [Google Scholar]
- Dieckmann U, Heino M. Probabilistic maturation reaction norms: their history, strengths, and limitations. Marine Ecology Progress Series. 2007;335:253–269. [Google Scholar]
- Doctor KK. Spatial and Temporal Patterns of Migration and Population Structure in Sockeye Salmon. Seattle: University of Washington; 2008. M.S. thesis. [Google Scholar]
- Edeline E, Carlson SM, Stige LC, Winfield IJ, Fletcher JM, James JB, Haugen TO, et al. Trait changes in a harvest population are driven by a dynamic tug-of-war between natural and harvest selection. Proceedings of the National Academy of Sciences USA. 2007;104:15799–15804. doi: 10.1073/pnas.0705908104. [DOI] [PMC free article] [PubMed] [Google Scholar]
- Fenberg PB, Roy K. Ecological and evolutionary consequences of size-selective harvesting: how much do we know? Molecular Ecology. 2008;17:209–220. doi: 10.1111/j.1365-294X.2007.03522.x. [DOI] [PubMed] [Google Scholar]
- Fukuwaka M, Morita K. Increase in maturation size after the closure of a high seas gillnet fishery on hatchery-reared chum salmon Oncorhynchus keta. Evolutionary Applications. 2008;1:376–387. doi: 10.1111/j.1752-4571.2008.00029.x. [DOI] [PMC free article] [PubMed] [Google Scholar]
- Hamilton SL, Caselle JE, Standish JD, Schroeder DM, Love MS, Rosales-Casian JA, Sosa-Nishizaki O. Size-selective harvesting alters life histories of a temperate sex-changing fish. Ecological Applications. 2007;17:2268–2280. doi: 10.1890/06-1930.1. [DOI] [PubMed] [Google Scholar]
- Hamley JM. Review of gillnet selectivity. Journal of the Fisheries Research Board of Canada. 1975;32:1943–1969. [Google Scholar]
- Hamon TR, Foote CJ, Hilborn R, Rogers DE. Selection on morphology of spawning wild sockeye salmon by a gill-net fishery. Transactions of the American Fisheries Society. 2000;129:1300–1315. [Google Scholar]
- Harris RB, Wall WA, Allendorf FW. Genetic consequences of hunting: what do we know and what should we do? Wildlife Society Bulletin. 2002;30:634–643. [Google Scholar]
- Hazel LN. Problems, techniques, and experimental designs in animal investigations; animal breeding. Journal of Animal Science. 1950;9:475–483. [PubMed] [Google Scholar]
- Hilborn R, Quinn TP, Schindler DE, Rogers DE. Biocomplexity and fisheries sustainability. Proceedings of the National Academy of Sciences USA. 2003;100:6564–6568. doi: 10.1073/pnas.1037274100. [DOI] [PMC free article] [PubMed] [Google Scholar]
- Holt CA, Peterman RM. Long-term trends in age-specific recruitment of sockeye salmon (Oncorhynchus nerka) in a changing environment. Canadian Journal of Fisheries and Aquatic Sciences. 2004;61:2455–2470. [Google Scholar]
- Hutchings JA. The cod that got away. Nature. 2004;428:899–900. doi: 10.1038/428899a. [DOI] [PubMed] [Google Scholar]
- Hutchings JA, Fraser DJ. The nature of fisheries- and farming-induced evolution. Molecular Ecology. 2008;17:294–313. doi: 10.1111/j.1365-294X.2007.03485.x. [DOI] [PubMed] [Google Scholar]
- Hutchings JA, Myers RA. What can be learned from the collapse of a renewable resource – Atlantic cod, Gadus morhua, of Newfoundland and Labrador. Canadian Journal of Fisheries and Aquatic Sciences. 1994;51:2126–2146. [Google Scholar]
- Hutchings JA, Rowe S. Consequences of sexual selection for fisheries-induced evolution: an exploratory analysis. Evolutionary Applications. 2008;1:129–136. doi: 10.1111/j.1752-4571.2007.00009.x. [DOI] [PMC free article] [PubMed] [Google Scholar]
- Kendall NW, Quinn TP. Effects of population-specific variation in age and length on fishery selection and exploitation rates of sockeye salmon. Canadian Journal of Fisheries and Aquatic Sciences. 2009;66:896–908. [Google Scholar]
- Kuparinen A, Merila J. Detecting and managing fisheries-induced evolution. Trends in Ecology and Evolution. 2007;22:652–659. doi: 10.1016/j.tree.2007.08.011. [DOI] [PubMed] [Google Scholar]
- Kuparinen A, Kuikka S, Merila J. Estimating fisheries-induced selection: traditional gear selectivity research meets fisheries-induced evolution. Evolutionary Applications. 2009;2:234–243. doi: 10.1111/j.1752-4571.2009.00070.x. [DOI] [PMC free article] [PubMed] [Google Scholar]
- Lagler KF. Capture, sampling, and examination of fishes. In: Ricker WE, editor. Methods for Assessment of Fish Production in Fresh Waters. Oxford and Edinburgh: Blackwell Science Publications; 1968. pp. 7–45. [Google Scholar]
- Law R. Fishing, selection, and phenotypic evolution. ICES Journal of Marine Science. 2000;57:659–668. [Google Scholar]
- Law R. Fisheries-induced evolution: present status and future directions. Marine Ecology Progress Series. 2007;335:271–277. [Google Scholar]
- Law R, Grey DR. Evolution of yields from populations with age-specific cropping. Evolutionary Ecology. 1989;3:343–359. [Google Scholar]
- Law R, Rowell CA. Cohort-structured populations, selection responses, and exploitation of the North Sea cod. In: Stokes TK, McGlade JM, Law R, editors. The Exploitation of Evolving Resources. Berlin: Springer-Verlag; 1993. pp. 155–173. Lecture Notes in Biomathematics. [Google Scholar]
- Link MR, Hartley ML, Miller SA, Waldrop B, Wilen J, Barnett J. An Analysis of Options to Restructure the Bristol Bay Salmon Fishery. Dillingham, AK: Bristol Bay Economic Development Corporation; 2003. [Google Scholar]
- Mathisen OA, Burgner RL, Koo TSY. Statistical Records and Computations n Red Salmon (Oncorhynchus nerka) Runs in the Nushagak District, Bristol Bay, Alaska, 1946–59. Washington, DC: United States Fish and Wildlife Service; 1963. Special scientific report–fisheries 468. [Google Scholar]
- McGraw JB. Evidence for decline in stature of American ginseng plants from herbarium specimens. Biological Conservation. 2001;98:25–32. [Google Scholar]
- Minard RE, Meacham CP. Sockeye salmon (Oncorhynchus nerka) management in Bristol Bay, Alaska. Canadian Special Publication of Fisheries and Aquatic Sciences. 1987;96:336–342. [Google Scholar]
- Naiman RJ, Bilby RE, Schindler DE, Helfield JM. Pacific salmon, nutrients, and the dynamics of freshwater and riparian ecosystems. Ecosystems. 2002;5:339–417. [Google Scholar]
- Olsen EM, Heino M, Lilly GR, Morgan MJ, Brattey J, Ernande B, Dieckmann U. Maturation trends indicative of rapid evolution preceded the collapse of northern cod. Nature. 2004;428:932–935. doi: 10.1038/nature02430. [DOI] [PubMed] [Google Scholar]
- Policansky D. Fishing as a cause of evolution in fishes. In: Stokes TK, McGlade JM, Law R, editors. The Exploitation of Evolving Resources. Berlin: Springer-Verlag; 1991. pp. 2–18. [Google Scholar]
- Pyper BJ, Peterman RM. Relationship among adult body length, abundance, and ocean temperature for British Columbia and Alaska sockeye salmon (Oncorhynchus nerka), 1967–1997. Canadian Journal of Fisheries and Aquatic Sciences. 1999;56:1716–1720. [Google Scholar]
- Pyper BJ, Peterman RM, Lapointe MF, Walters CJ. Patterns of covariance in length and age at maturity of British Columbia and Alaska sockeye salmon (Oncorhynchus nerka) stocks. Canadian Journal of Fisheries and Aquatic Sciences. 1999;56:1046–1057. [Google Scholar]
- Quinn TP. The Behavior and Ecology of Pacific Salmon and Trout. Seattle, WA: University of Washington Press; 2005. [Google Scholar]
- Quinn TP, Hendry AP, Wetzel LA. The influence of life history trade-offs and the size of incubation gravels on egg size variation in sockeye salmon (Oncorhynchus nerka. Oikos. 1995;74:425–438. [Google Scholar]
- Quinn TP, Hodgson S, Flynn L, Hilborn R, Rogers DE. Directional selection by fisheries and the timing of sockeye salmon (Oncorhynchus nerka) migrations. Ecological Applications. 2007;17:731–739. doi: 10.1890/06-0771. [DOI] [PubMed] [Google Scholar]
- Quinn TP, Doctor K, Kendall N, Rich HB., Jr . Anadromy and the life history of salmonid fishes: nature, nurture, and the hand of man. In: Haro AJ, Smith KL, Rulifson RA, Moffitt CM, Klauda RJ, Dadswell MJ, Cunjak RA, et al., editors. Challenges for Diadromous Fishes in a Dynamic Global Environment. Bethesda, MD: American Fisheries Society Symposium 69; 2009. [Google Scholar]
- Regier HA. Fish size parameters useful in estimating gill-net selectivity. Progressive Fish-Culturist. 1969;31:57–59. [Google Scholar]
- Ricker WE. Changes in the average size and average age of Pacific salmon. Canadian Journal of Fisheries and Aquatic Sciences. 1981;38:1636–1656. [Google Scholar]
- Rogers DE, Ruggerone GT. Factors affecting marine growth of Bristol Bay sockeye salmon. Fisheries Research. 1993;18:89–103. [Google Scholar]
- Ruggerone GT, Zimmermann M, Myers KW, Nielsen JL, Rogers DE. Competition between Asian pink salmon (Oncorhynchus gorbuscha) and Alaska sockeye salmon (O. nerka) in the North Pacific Ocean. Fisheries Oceanography. 2003;12:209–219. [Google Scholar]
- Sinclair AF, Swain DP, Hanson JM. Measuring changes in the direction and magnitude of size-selective mortality in a commercial fish population. Canadian Journal of Fisheries and Aquatic Sciences. 2002;59:361–371. [Google Scholar]
- Skogland T. Natural selection of wild reinderr life history traits by food limitation and predation. Oikos. 1989;55:101–110. [Google Scholar]
- Steen RP, Quinn TP. Egg burial depth by sockeye salmon (Oncorhynchus nerka): implications for survival of embryos and natural selection on female body size. Canadian Journal of Zoology. 1999;77:836–841. [Google Scholar]
- Swain DP, Sinclair AF, Hanson JM. Evolutionary response to size-selective mortality in an exploited fish population. Proceedings of the Royal Society of London Series B: Biological Sciences. 2007;274:1015–1022. doi: 10.1098/rspb.2006.0275. [DOI] [PMC free article] [PubMed] [Google Scholar]
- Todd ISP, Larkin PA. Gillnet selectivity on sockeye (Oncorhynchus nerka) and pink salmon (O. gorbuscha) of the Skeena River system, British Columbia. Journal of the Fisheries Research Board of Canada. 1971;28:821–842. [Google Scholar]
- Trippel EA. Age at maturity as a stress indicator in fisheries. BioScience. 1995;45:759–771. [Google Scholar]
- Walsh MR, Munch SB, Chiba S, Conover DO. Maladaptive changes in multiple traits caused by fishing: impediments to population recovery. Ecology Letters. 2006;9:142–148. doi: 10.1111/j.1461-0248.2005.00858.x. [DOI] [PubMed] [Google Scholar]
- Walters CJ, Martell SJD. Fisheries Ecology and Management. Princeton: Princeton University Press; 2004. [Google Scholar]
- Yoneda M, Wright PJ. Temporal and spatial variation in reproductive investment of Atlantic cod Gadus morhua in the northern North Sea and Scottish west coast. Marine Ecology Progress Series. 2004;276:237–248. [Google Scholar]