

Abstract
Together with the knowledge of the population structure, a critical aspect for the planning of association and/or population genomics studies is the level of linkage disequilibrium (LD) that characterizes the species and the population used for such an analysis. We have analyzed the population structure and LD in wild and domesticated populations of Phaseolus vulgaris L. using amplified fragment length polymorphism markers, most of which were genetically mapped in two recombinant inbred populations. Our results reflect the previous knowledge of the occurrence of two major wild gene pools of P. vulgaris, from which two independent domestication events originated, one in the Andes and one in Mesoamerica. The high level of LD in the whole sample was mostly due to the gene pool structure, with a much higher LD in domesticated compared to wild populations. In relation to association studies, our results also suggest that whole-genome-scan approaches are feasible in the common bean. Interestingly, an excess of inter-chromosomal LD was found in the domesticated populations, which suggests an important role for epistatic selection during domestication. Moreover, our results indicate the occurrence of a strong bottleneck in the Andean wild population before domestication, suggesting a Mesoamerican origin of P. vulgaris. Finally, our data support the occurrence of a single domestication event in Mesoamerica, and the same scenario in the Andes.
Keywords: AFLP, Common Bean, Crop Evolution, Domestication, Epistatic Selection, Leguminosae
Introduction
Linkage disequilibrium (LD) is the nonrandom association of alleles at two (or more) loci. The extent of LD in natural and domesticated populations is mainly related to effective recombination rate, mating system and population size. LD is promoted by drift, hitchhiking and epistatic selection, and it has become the subject of intensive studies in recent years, with the objective of mapping and identifying genes of interest in human and animals (Lai et al. 1994; Slatkin 1999). More recently, it has also been studied in plant species, such as Zea mays (Remington et al. 2001; Thornsberry et al. 2001; Vigouroux et al. 2002, 2005), Glycine max (Zhu et al. 2003), Hordeum vulgare (Lin et al. 2002; Kraakman et al. 2004; Morrell et al. 2005) and the model plant species Arabidopsis thaliana (Nordborg et al. 2002; Tian et al. 2002; Caicedo et al. 2004).
Two main approaches have been proposed to exploit LD patterns for the identification of genes and genomic regions with adaptive roles. The most common approach involves association studies, where the aim is to associate a given phenotype to a molecular variant (Lynch and Walsh 1997; Cardon and Bell 2001; Thornsberry et al. 2001; Mazzucato et al. 2008). This is basically an extension of quantitative trait loci (QTL) mapping, where the focus turns from families to populations. An alternative approach is exploitation of the signature of selection on the structure of the molecular diversity (Kohn et al. 2000; Vigouroux et al. 2002). This approach is useful for validation of previously identified genes with putative adaptive roles, or for identification of genes or genomic regions involved in genetic control of important adaptive pathways, even without any prior information (Kohn et al. 2000; Akey et al. 2002; Fullerton et al. 2002; Vigouroux et al. 2002; Wright et al. 2005; Papa et al. 2007; Bitocchi et al. 2009).
All of these methods (QTLs, association genetics, natural selection mapping) depend on the LD between phenotypic causative and linked molecular variants. While traditional mapping procedures are based on the observable differential decay of LD between loci in experimental families over one or a few generations (e.g. F2, RIL), both association genetics and population genomics rely on historical differential decay of LD between pairs of loci in natural and domesticated populations. The larger the level of LD, the lower the resolution for detecting the genome location of the causative molecular variant.
For this reason, a critical aspect for the planning of association and/or population genomics studies is the level of LD that characterizes the species and the population used for such an analysis. When the LD is low, a candidate gene approach is usually preferred, because in this case, too many markers will be needed to perform a whole genome scan to cover the variation in the entire genomes. On the other hand, when LD is moderate/high, a whole genome scan can be more appropriate. An ideal situation would be to use different populations distinguished by variable LD levels.
Linkage disequilibrium studies show great promise for the identification of the genetic basis of important traits if the effects of population structure are effectively controlled (Remington et al. 2001; Zhao et al. 2007). To determine how the markers should be distributed through the genome to find causal variants, it is very important to know the extent and structure of genetic diversity and the level of LD in different populations. Without this knowledge, the LD mapping approach will not be successful, because a strong LD detected between a marker and a phenotypic trait might be due to the recent occurrence of disequilibrium (e.g. admixture, population structure), rather than to the close physical location of the two loci.
Phaseolus vulgaris is a diploid (2n = 2x = 22), annual species, and is predominantly self-pollinating. It is the most important grain legume for direct human consumption. In P. vulgaris, many aspects of its molecular and phenotypic diversity, migration dynamics and population structure are well known (Gepts et al. 1986; Gepts and Bliss 1988; Gepts 1996; Alvarez et al. 1998; Papa and Gepts 2003; Chacón et al. 2005; Papa et al. 2006; Angioi et al. 2009; Kwak and Gepts 2009). To date, in contrast, little information is available on the extent of LD (Kwak and Gepts 2009). Thus, little is known about the suitability of the LD mapping approach in this context. However, the first indirect analysis (Papa et al. 2005, 2007) indicated that the extent of LD in P. vulgaris is large and extends over a few centimorgans (cM), as is also the case for other autogamous species, such as soybean (Hyten et al. 2007), A. thaliana (Nordborg et al. 2002), barley (Kraakman et al. 2004; Morrell et al. 2005; Caldwell et al. 2006) and rice (Garris et al. 2003; Mather et al. 2007; Zhu et al. 2007). This observation suggests that a genome-scan approach would be promising in P. vulgaris. This species is characterized by two geographic gene pools distributed in Mesoamerica and in the southern Andes, with parallel geographic patterns in wild and domesticated beans, indicating the occurrence of independent domestication events in these two regions. Sequence analyses of the gene coding for phaseolin, the main seed storage protein, have suggested that the ancestral populations of P. vulgaris were likely to have originated from Ecuador and northern Peru (Kami et al. 1995; Gepts et al. 1999). In this study, we have used a large set of amplified fragment length polymorphism (AFLP) markers, and we have analyzed the extent and structure of the genetic diversity of different populations of P. vulgaris from both gene pools. Moreover, using these mapped AFLPs, we have explored the levels of LD in both gene pools, for wild and domesticated populations that are likely to show different levels of LD, as also found in other species (e.g. barley, soybean). These analyses are relevant to the domestication history of the common bean and also raise important questions related to the origins of the wild populations of P. vulgaris.
Materials and methods
Plant materials and DNA extraction
In this study, 183 accessions of common bean were used, each represented by an individual genotype. Ninety-three accessions represented the geographical distribution of wild P. vulgaris from northern Mexico to northwestern Argentina, including seven wild accessions from northern Peru and Ecuador that are characterized by the ancestral phaseolin type I (Debouck et al. 1993; Kami et al. 1995). Ninety accessions, mostly landraces, represented the Andean and Mesoamerican gene pools and their major morphological races cultivated in central and southern America. Based on both passport data, which include race type, phaseolin type, seed colour and pattern, and seed weight, and considering previous studies on the common bean (Duarte et al. 1999; Beebe et al. 2000, 2001; Singh et al. 2001; McClean et al. 2004; Rosales-Serna et al. 2005; Blair et al. 2006a,b;Díaz and Blair 2006; Pedrosa et al. 2006; McClean and Lee 2007), we classified 42 domesticated accessions as Andean and 48 as Mesoamerican. A complete list of the accessions used in this study is available in Table S1. The seeds were provided by the USDA Western Regional Plant Introduction Station (Pullman, WA, USA) and the International Center of Tropical Agriculture (CIAT) in Colombia. For each accession, genomic DNA was extracted from young leaves of a single, greenhouse-grown plant using the miniprep extraction method (Doyle and Doyle 1987).
AFLP analysis
We used a total of 19 AFLP primer combinations (Table S2) that were chosen based on a prior screening with 141 AFLP primer combinations (Papa et al. 2007). Of these 19 combinations, 14 were used for the population structure and LD analyses, whereas the remaining five were added only for construction of an AFLP-based consensus map. The AFLP analyses were carried out according to the technique developed by Vos et al. (1995), with minor modifications. Briefly, total genomic DNA (300 ng) from each accession was digested with the EcoRI (5′-GˆAATTC-3′) and MseI (5′-TˆTAA-3′) restriction enzymes and ligated with the respective adaptors by incubation at 37°C for 4 h, followed by 20 min at 65°C, and a final temperature of 10°C. The pre-amplification reactions were performed using DNA from the restriction-ligation, with an eight-fold dilution prior to amplification with the primers EcoRI (5′-GACTGCGTACCAATTC-3′) and MseI (5′-GATGAGTCCTGAGTAA-3′) with a single selective nucleotide (i.e. EcoRI and MseI +N). The preselective amplification products were diluted 11-fold, and used as templates for the second amplification. Cy5-labelled EcoRI primers were used for the final selective polymerase chain reaction, and the AFLP fragments were separated on 6% polyacrylamide gels by electrophoresis for 2 h at 50 W constant power, using a Genomix system (Beckman, Fullerton, CA). The AFLP fingerprints were manually scored and recorded for the absence or presence of fragments; bands of equal fragment size were assumed to be homologous. To minimize the effects of size homoplasy, only fragments of the medium/large size classes were scored (Vekemans et al. 2002). Only clearly amplified bands were scored, with bands presenting variable intensities across individuals not considered as informative and not retained for data analysis. Several precautions were taken to ensure reliability of the scoring. Thus, the genotypes were randomly distributed across different gels (four gels were necessary for each primer combination), and replicated samples were used to investigate polymorphism within gels. About 10% of the samples were replicated twice, to test polymorphism between gels. Control genotypes were also used to align the different gel runs for each primer combination, as well as monomorphic bands across the samples. The gels were scored twice, and all of the validated polymorphic fragments were checked by running a ‘summary gel’ that corresponded to a subset of genotypes (about 30%) that were representative of the polymorphism observed.
AFLP mapping (AFLP consensus map)
To map the AFLP markers identified, two recombinant inbred populations were used: the BAT93 × Jalo EEP558 population (BJ; 75 lines; Freyre et al. 1998) and the Midas × G12873 population (MG; 58 lines; Koinange et al. 1996). The AFLP markers were placed using previously established linkage maps that are available for these two populations: the BJ linkage map (Freyre et al. 1998; Kwak et al. 2008), and the MG linkage map (Koinange et al. 1996), both of which are mostly constituted of restriction fragment length polymorphism (RFLP) markers. The markers were placed according to standard mapping procedures (Freyre et al. 1998). The mapmaker/exp computer software, version 3.0b (Lander et al. 1987), was used to determine the linkage relationships and the linear order of segregating markers. Linkage map distances are in Kosambi units (Kosambi 1944) and LOD scores >3.0 (Freyre et al. 1998) were chosen to assign the markers to linkage groups and to find an internal order. Markers already mapped on the two RIL populations (Koinange et al. 1996; Freyre et al. 1998; Kwak et al. 2008) were used as a framework to locate the AFLP markers on their respective linkage maps. We used 56 framework markers for the BJ population, and 67 for the MG population, distributed among 11 linkage groups. The most likely order of markers in each group was determined using the ‘order’, ‘compare’, ‘build’ and ‘ripple’ commands. A chi-squared test was performed to determine the deviation from the 1:1 ratio expected under the null-hypothesis of no segregation distortion; markers identified as ‘distorted’ (P ≤ 0.05) were not used to find the internal order. The presence of putatively co-dominant loci was also tested among co-segregated bands; loci were considered as putatively co-dominant if the segregating products came from the same AFLP primer combination and if polymorphism between individuals was alternatively present. A consensus AFLP map was then constructed by combining the two maps, using 75 previously identified common markers between the two mapping populations (55 AFLP markers and 20 framework markers). After evaluation of the marker orders and their respective positions on the chromosomes, the average distances between common markers were considered, to place the other markers. The quality of the consensus map was evaluated by comparing the locus arrangement of the consensus map with the arrangement of loci in the individual maps, and re-evaluating the distances between the markers, with a two-point independent analysis, in the consensus map using the ‘two-point’ command. The linkage group nomenclature followed Pedrosa et al. (2008).
Data analysis
The population structure was investigated using the model-based (Bayesian) clustering algorithm implemented in the structure software (Pritchard et al. 2000; Falush et al. 2003), which identifies groups of individuals according to their allele distributions. In this study, the data were first analyzed using all of the markers and the admixture model. Then, mapped markers were used to run the linkage model and the admixture model, to compare the results obtained using different models and markers and to test the robustness of the results. All of the runs were carried out with 1 000 000 iterations and 500 000 burn-ins, assuming correlated allele frequencies (Falush et al. 2003). No a priori population information was used. Twenty runs were carried out for each dataset, and a range of K from 1 to 10 was explored. The value of K was selected using ΔK (Evanno et al. 2005). This measure can provide a better estimation of the ‘true’ value of K compared to the maximal value of L(K) returned by structure. Individuals with membership coefficients of qi ≥ 0.7 were assigned to a specific group, whereas individuals with qi < 0.7 were identified as admixed (if not specified otherwise). Possible substructures that might have been hidden by the main population structure were explored (Evanno et al. 2005); indeed, each of the groups identified was subsequently analyzed to determine the number of putative subgroups.
Moreover, the percentage of polymorphic loci, the percentage of rare alleles (markers with a frequency <0.1 and >0.9) and the unbiased genetic diversity (HE; Nei 1978) were estimated. An ad hoc statistic (ΔH) was used to measure the loss of diversity in domesticated populations, as proposed by Vigouroux et al. (2002): ΔH = 1 − (HD/HW), where HD and HW are the genetic diversity in domesticated and wild common bean, respectively. We used this statistic to compare the diversity between different gene pools using the larger diversity as described for HW. Overall, these statistics were calculated both considering the groups classified by passport data and those identified by the structure analysis.
The level of LD and its significance for each pair of AFLP loci were evaluated using the tassel software package (Bradbury et al. 2007); a threshold of P < 0.01 was chosen. LD was estimated for the entire population and for specific subgroups. All the analyses were conducted both with and without consideration of the admixed genotype identified by structure at K = 2. The LD was estimated by computing the squared correlation coefficient (r2) between pairs of markers (Hill and Robertson 1968), using all of the loci, only the loci with a frequency >0.1 and <0.9, and only the loci with a frequency >0.2 and <0.8. To test for the independence of the level of LD observed from the population relatedness, the sample numbers were reduced by discarding very similar entries (≥15% identical alleles) and creating a ‘normalized’ sample that was used to estimate pairwise LD (Breseghello et al. 2005).
The plots of LD (r2) for pairs of loci versus genetic distance (cM) were drawn from the r2-values calculated by tassel. A Wilcoxson nonparametric test was used to evaluate the significance of the different models. Five classes of linkage distances were chosen to represent intra-chromosomal LD (D1: ≤3; D2: >3 and ≤10; D3: >10 and ≤30; D4: >30 and ≤50; D5: >50), while inter-chromosomal LD among markers located in different chromosomes was also calculated. Separation of the means between the classes was performed using a chi-squared test (P < 0.01) after a stepwise Bonferroni correction. In addition to the pairwise LD, a multilocus LD statistic was also evaluated (multilocus version 1.2, Agapow and Burt 2000); this multilocus LD index (rd) (Burt et al. 1999; Agapow and Burt 2000) is based on the distribution of allelic mismatches between pairs of individuals over all of the loci (Brown et al. 1980). Specifically, LD evaluation is based on the variance of the number of pairwise differences among samples that were subjected to genetic analysis at multiple loci; rd is an extended statistic from the traditional multilocus LD index of association, IA, which was corrected for the number of loci used in the analysis, thus making the comparison between different groups possible.
Results
AFLP genetic diversity
Overall, a total of 418 AFLP markers were identified in the whole sample. Table 1 summarizes the levels of polymorphism and genetic diversity for all of the markers for the different groups defined using the passport data information. A higher percentage of polymorphic markers (62.4%) was found in the Mesoamerican gene pool, compared to the Andean one (54.8%); in both gene pools, the percentages of polymorphic loci of the wild forms were always higher than those of the domesticated forms. A greater number of rare alleles were found for the Andean gene pool (64.2%) compared to the Mesoamerican one (43.7%). The Mesoamerican gene pool showed a 1.6-fold higher genetic diversity (HE) than the Andean one (χ2 = 24.7, P = 6.8 × 10⁻⁷, Wilcoxon, nonparametric test). These differences in genetic diversity were still significant when the analysis was carried out separately for each form, as wild (Mesoamerican versus Andean, χ2 = 35.8, P = 2.1 × 10⁻⁹, Wilcoxon nonparametric test) and domesticated (Mesoamerican versus Andean, χ2 = 5.1, P = 0.023, Wilcoxon nonparametric test). In the Mesoamerican gene pool, the wild forms were more diverse than the domesticated forms (χ2 = 19.4, P = 1 × 10⁻⁵, Wilcoxon nonparametric test), as also shown by analysis of the reduction in genetic diversity (ΔH = 0.32). In the Andean gene pool, the genetic diversity between the forms did not differ (ΔH = 0).
Table 1.
Levels of polymorphism and genetic diversity detected with the AFLP markers among the genotypes of Phaseolus vulgaris used in this study; the groups were identified based on passport data information
| Groups* | N† | % of polymorphic loci‡ | No. rare alleles§ | % of rare alleles¶ | HE* | SD |
|---|---|---|---|---|---|---|
| Mesoamerican | 89 | 62.4 | 114 | 43.7 | 0.21 | 0.10 |
| Mesoamerican wild | 41 | 59.8 | 105 | 42.0 | 0.22 | 0.11 |
| Mesoamerican domesticated | 48 | 44.0 | 77 | 41.8 | 0.15 | 0.07 |
| Colombian wild | 4 | 13.9 | n.a. | n.a. | 0.10 | 0.06 |
| Andean | 83 | 54.8 | 147 | 64.2 | 0.13 | 0.06 |
| Andean wild | 41 | 47.8 | 121 | 60.5 | 0.12 | 0.06 |
| Andean domesticated | 42 | 40.9 | 91 | 53.2 | 0.12 | 0.05 |
| Ph_I | 7 | 22.2 | n.a. | n.a. | 0.13 | 0.07 |
SD, standard deviation; n.a., not applicable.
Mesoamerican, Mesoamerican wild, Mesoamerican domesticated, Colombian wild, Andean, Andean wild, Andean domesticated, Ph_I genotypes (from Ecuador and northern Peru, with phaseolin I).
Number of genotypes, classified based on passport information.
Percentage of polymorphic loci calculated over total loci (418).
Rare alleles (P < 0.1 and P > 0.9).
Percentage calculated over polymorphic loci.
Unbiased Genetic Diversity (Nei 1978).
Linkage mapping of AFLP markers
The AFLP markers identified by the 19 primer combinations were placed in two different genetic maps based on two recombinant inbred populations: BAT93 × Jalo EEP558 (BJ; Freyre et al. 1998) and Midas × G12873 (Koinange et al. 1996). Considering both populations, 229 polymorphic markers were detected. Overall, we were able to place 166 markers in the 11 linkage groups (LG), 55 of which were shared between the two maps; the remaining 63 markers were unlinked at a LOD value >3.0. Eleven pairs of polymorphic bands were found to co-segregate as alleles of co-dominant loci. Thus, of 229 polymorphic markers, 207 (90.4%) were dominant loci, whereas 22 (9.6%) represented 11 putative co-dominant loci.
The BJ map
In the BJ population, 116 of 139 polymorphic markers were placed on the established core linkage map (Freyre et al. 1998), whereas 23 were unlinked (at an LOD score >3.0). Markers were placed in all of the linkage groups, for a total length of 1372 cM, ranging from three markers in LG 03, to 19 markers in LG 02, with an average of 10.6 markers per linkage group. Of 139 polymorphic markers, 68 (48.9%) originated in the parental BAT93 line, whereas 71 (51.1%) were present in the parental Jalo EEP558 line. Segregation analysis performed on the AFLP markers showed a significant deviation (P < 0.05) from the expected 1:1 ratio under the null hypothesis of no-segregation-distortion for only eight (6.9%) markers out of 139.
The MG map
In the MG population, 105 (67.3%) of 156 polymorphic markers were placed on the established map (Koinange et al. 1996), whereas 51 were unlinked (at a LOD score >3.0). Markers were placed in all linkage groups, for a total length of 1258 cM, ranging from two markers in LG 03 and LG 06, to 20 markers in LG 01 and 02, with an average of 10 markers per linkage group. Ninety (57.7%) of 156 polymorphic markers originated in the Midas parental line, whereas 66 (43.3%) were inherited from the G12873 parental line. Segregation analysis performed on the AFLP markers showed a significant deviation (P < 0.05) from the expected 1:1 ratio under the null hypothesis of no-segregation-distortion for 22 (14.1%) markers out of 156.
Consensus map
Before building the consensus map, the two maps were aligned to verify the positions of the markers along the linkage groups. After evaluation of the consistency of the loci order between the two different maps, 75 common loci between the two mapping populations (55 AFLP and 20 framework) were used to determine the relative orientations of the linkage groups in their respective maps and to combine the maps into a consensus map (Fig. 1). The average genetic distances between common adjacent markers were computed, to determine the positions of the other markers. The total length obtained for the consensus map is 1029 cM, with an average distance between markers of 6.2 cM. The AFLP markers were distributed in all the linkage groups, from four markers in LG 03, to 32 markers in LG 02. The quality of the consensus map was then evaluated using a two-point independent analysis to re-examine the distances between the markers in the consensus map; the two distances were in agreement.
Figure 1.
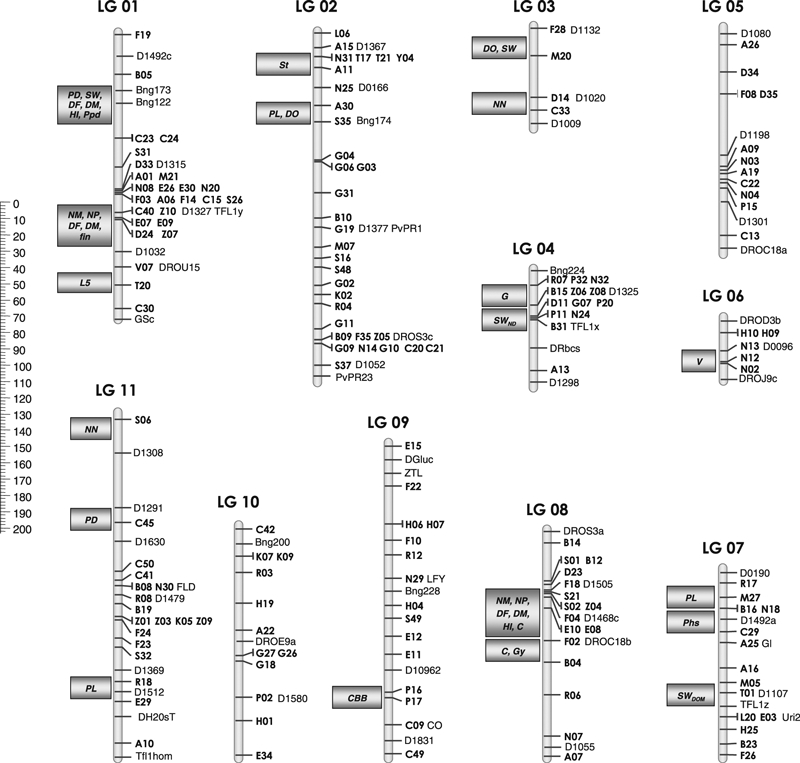
AFLP consensus map. Linkage groups (LG 01–LG 11) with AFLP markers (in bold) shown to the right, along with the previously mapped framework markers (Vallejos et al. 1992; Gepts et al. 1993; Nodari et al. 1993;Koinange et al. 1996; Freyre et al. 1998; Kwak et al. 2008). Domestication and other traits are shown to the left (grey rectangles), mapping them near to the AFLP markers. Genetic distances are in Kosambi map units. QTLs and major genes: CBB, common bacterial blight resistance; DF, days to flowering; DM, days to maturity; DO, dormancy; fin, determinacy; C, Gy, V seed coat pattern and colour; PD, photoperiod sensitivity; HI, harvest index; L5, length of fifth internode; NM, number of nodes on main stem; NN, rhizobium nodulation; NP, number of pods; PL, pod length; Ppd, photoperiod sensitivity; SWDOM seed weight, identified in cross with wild bean; SWND seed weight, identified in cross between cultivars (Nodari et al. 1993; Koinange et al. 1996; Gepts et al. 1999; Geffroy et al. 2000).
Population structure
The uppermost hierarchical level of population structure identified using the method based on the estimation of ΔK (Evanno et al. 2005) suggested that our sample was made up of two main genetic groups (K = 2). However, we also identified a secondary peak at K = 4 (Fig. 2), and thus we analyzed our sample considering all of the K-values from 2 to 4. Using K = 2, structure identified two main clusters corresponding to the Mesoamerican and the Andean gene pools: the Mesoamerican cluster constituted of 48 domesticated Mesoamerican genotypes, plus 41 wild genotypes from Mexico, Guatemala, Costa Rica and Colombia, and the Andean cluster constituted of 41 domesticated Andean genotypes, plus 37 wild genotypes from Peru, Bolivia and Argentina (Fig. 3A). Sixteen genotypes were admixed. In particular, all of the seven wild genotypes with the ancestral phaseolin (type I; Kami et al. 1995) were admixed even if at a lower threshold (qi ≥ 0.6) were assigned to the first cluster (Mesoamerican).
Figure 2.
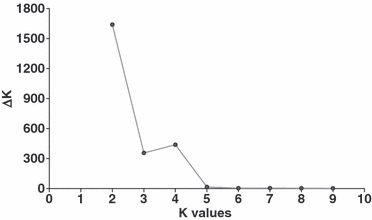
Distribution of ΔK-values according to K-values.
Figure 3.
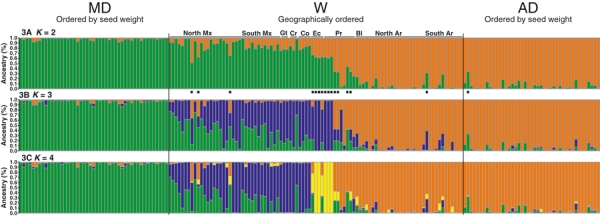
Population structure as inferred by structure v2.1; each individual is represented by a vertical line, partitioned into K coloured segments that represent the estimated membership of each individual. Black square indicates admixed genotypes at K = 2. Groups: MD, Mesoamerican domesticated; AD, Andean domesticated; W, Wild. Countries are abbreviated as follow: Ar, Argentina; Bl, Bolivia; Co, Colombia; Cr, Costa Rica; Ec, Ecuador; Gt, Guatemala; Mx, Mexico; Pr, Peru.
A stepwise increase to K = 3 showed the occurrence of a new group consisting of wild genotypes from Mexico, central America and Colombia, and five genotypes with phaseolin type I (Fig. 3B). At K = 4, there were two Mesoamerican groups (domesticated and wild), a third group represented by the ‘I’ gene pool (with the ancestral phaseolin I), and a fourth group including Andean materials (Fig. 3C).
We then performed structure analysis on the Mesoamerican and the Andean groups (K = 2) separately. The analysis performed on the Mesoamerican group provided the same results as those shown in Fig. 3C; indeed, strong separation was again seen, which confirmed the subdivision between wild and domesticated Mesoamerican genotypes. The Andean group, which showed a homogeneous structure in the previous analysis, was further subdivided into two main clusters (K = 2) corresponding to the wild and domesticated forms (Fig. 4). Fifteen domesticated genotypes were found to be admixed; this number was further reduced to 8 using a lower threshold (qi > 0.6).
Figure 4.
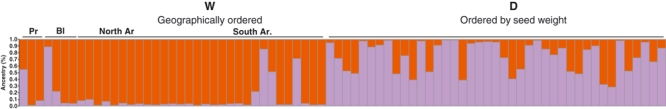
Independent cluster analysis for the Andean group identified at K = 2. Each individual is represented by a vertical line, partitioned into K coloured segments that represent the estimated membership for each individual. Groups: W, wild; D, domesticated. Countries are abbreviated as follow: Ar, Argentina; Bl, Bolivia; Pr, Peru.
The last step was to investigate the population structure within each form (wild or domesticated) for each gene pool. Thus, we did not consider the admixed genotypes between gene pools and the populations with the ancestral phaseolin I. For these reasons, the analyses with structure were conducted on four subgroups (Fig. 5): MW (Mesoamerican wild), MD (Mesoamerican domesticated), AW (Andean wild) and AD (Andean domesticated).
Figure 5.

Independent cluster analyses within forms (wild and domesticated). Each individual is represented by a vertical line, partitioned into K coloured segments that represent the estimated membership for each individual. (*) weedy genotypes. Subgroups: MW, Mesoamerican wild; MD, Mesoamerican domesticated; AW, Andean wild; AD, Andean domesticated. Countries are abbreviated as follow: Ar, Argentina; Bl, Bolivia; Co, Colombia; Cr, Costa Rica; Gt, Guatemala; Mx, Mexico; Pr, Peru.
Considering the MW subgroup, all of the genotypes were assigned to three subclusters (K = 3), with the exception of three genotypes, which were identified as admixed. The MW_1 subcluster contained only Mexican genotypes, plus one from Costa Rica, whereas the MW_2 subcluster contained all of the genotypes from Colombia (4) and Guatemala (3), plus one from Costa Rica. Interestingly, the MW_3 subcluster contained only genotypes that were classified as weedy, from the passport information.
In the MD subgroup, all of the genotypes were assigned to three subclusters (K = 3), with the exception of nine identified as admixed. In addition, the subclusters identified appeared to reflect the known subdivisions in races of the common bean. Indeed, the MD_1 subcluster includes genotypes mainly classified as ‘race Mesoamerica’, with an average seed weight of 0.19 g (SD = 0.03). The MD_2 subcluster includes genotypes mainly classified as ‘race Durango-Jalisco’, with an average seed weight of 0.38 g (SD = 0.15). The MD_3 subcluster is a smaller group, with an average seed weight of 0.22 g (SD = 0.07) and no specific relationship to race classifications. The pairwise differences in seed weight between the three subclusters were significant only for the MD_1 versus MD_2 (t-test, P < 0.0001), and MD_2 versus MD_3 (t-test, P < 0.05) comparisons.
Considering the AW subgroup, all of the genotypes were assigned to three subclusters (K = 3), with the exception of six that were identified as admixed. However, in the AW genotypes, the structure observed was not clearly related to any phenotypic traits, or geographical or ecological variables.
In the AD subgroup, even though we obtained evidence of three subclusters (K = 3), the genotypes were assigned to only two subclusters, with almost one third (12) of the genotypes showing admixed ancestry. Similar to AW, the observed structure for AD was not associated with any traits (e.g. seed colour, seed weight, race type, or phaseolin).
AFLP genetic diversity for groups identified by structure
The diversity was then evaluated for the main groups identified by structure at K = 2, excluding the admixed genotypes (Fig. 3A), and subdivided between the wild and domesticated forms. The results are summarized in Table 2, and they are very similar to those obtained using the classification of the genotypes based on the passport data information.
Table 2.
Levels of polymorphism and genetic diversity detected with the AFLP markers among the genotypes of Phaseolus vulgaris used in this study; the groups were identified by structure analysis
| Groups* | N† | % of polymorphic loci‡ | No. of rare alleles§ | % of rare alleles¶ | HE** | SD |
|---|---|---|---|---|---|---|
| Mesoamerican | 89 | 59.1 | 100 | 40.5 | 0.21 | 0.10 |
| Mesoamerican wild | 41 | 54.5 | 86 | 37.7 | 0.22 | 0.11 |
| Mesoamerican domesticated | 48 | 44.0 | 77 | 41.8 | 0.15 | 0.07 |
| Andean | 78 | 52.4 | 136 | 62.1 | 0.12 | 0.06 |
| Andean wild | 37 | 41.1 | 107 | 62.2 | 0.11 | 0.05 |
| Andean domesticated | 41 | 39.2 | 88 | 53.7 | 0.12 | 0.06 |
SD, standard deviation.
Mesoamerican, Mesoamerican wild, Mesoamerican domesticated, Colombian wild, Andean, Andean wild, Andean domesticated, Ph_I genotypes (from Ecuador and northern Peru, with phaseolin I).
Number of genotypes, without considering admixed genotypes between gene pool.
Percentage of polymorphic loci calculated over total loci (418).
Rare alleles (P < 0.1 and P > 0.9).
Percentage calculated over polymorphic loci.
Unbiased Genetic Diversity (Nei 1978).
Linkage disequilibrium
Pairwise and multilocus LD were evaluated for all of the polymorphic loci, for the loci with a frequency > 0.1 and <0.9, and for the loci with a frequency > 0.2 and <0.8. The analyses were also conducted both with and without the previously identified admixed genotypes (K = 2). Moreover, to test the independence of the level of LD due to population relatedness, we also evaluated the levels of pairwise LD in a ‘normalized’ sample (Breseghello et al. 2005). Due to the very similar results obtained for all of these analyses, we present here only the results obtained using loci with a frequency >0.1 and <0.9, and without considering admixed genotypes between gene pools (K = 2).
In the whole sample, 56% of the pairwise LD comparisons were significant at the P < 0.01 level, with an average r2 of 0.1. The multilocus LD computed (rd) was also significant (P < 0.01), and was equal to 0.05 (Table 3). Considering the subdivisions in the gene pools, we found a greater level of loci in significant LD for the Andean gene pool (pairwise LD: 40.8%; average r2 = 0.11; multilocus LD: rd = 0.09) compared to the Mesoamerican one (pairwise LD: 16.7%; average r2 = 0.05; multilocus LD: rd = 0.03). Considering the subdivisions, a higher level of loci in significant LD was observed for the domesticated form (pairwise LD: 57.3%; average r2 = 0.18; multilocus LD: rd = 0.11), compared to the wild form (pairwise LD: 31.5%; average r2 = 0.08; multilocus LD: rd = 0.04). The LD was then evaluated for the subgroups identified by the structure analysis carried out independently within gene pools (Table 3). The highest level of loci in significant LD was seen for AD, followed by MD and AW, whereas the lowest level of LD was shown by MW. The analysis of LD (average r2) as a function of genetic distance in cM (Fig. 6) showed significant differences among the recombination distance class (cM) only for domesticated samples. For both wild populations, these differences were not significant. In the MD subgroup, the first significant difference in the levels of LD among the distance classes was seen when the first two classes where compared (within 10 cM; χ2 = 8.7; P = 0.002; Wilcoxon nonparametric test), whereas in the AD subgroup, significant differences were seen when the fourth class was compared with the first three classes (within 50 cM; χ2 = 10.7; P = 0.001; Wilcoxon nonparametric test). Loci of distance-class D5 (>50 cM) in the domesticated samples showed a significantly lower level of LD (MD: χ2 = 9.2; P = 0.002; AD: χ2 = 15.5; P = 8 × 10⁻⁵; Wilcoxon nonparametric test) than loci located in different chromosomes (inter-chromosomal LD), whereas in the wild samples, the difference in the level of LD between the two classes considered was not significant.
Table 3.
Linkage disequilibrium (pairwise LD and multilocus LD) analysis for the whole population and for the subgroups
| Pairwise LD | Multilocus LD | |||
|---|---|---|---|---|
| Groups* | N† | % | Average r2 | rd-values |
| ALL | 167 | 56.0 | 0.10 | 0.05 |
| W | 78 | 31.5 | 0.08 | 0.04 |
| D | 89 | 57.3 | 0.18 | 0.11 |
| M | 89 | 16.7 | 0.05 | 0.03 |
| A | 78 | 40.8 | 0.11 | 0.09 |
| MW | 41 | 3.4 | 0.04 | 0.01 |
| AW | 37 | 9.1 | 0.07 | 0.04 |
| MD | 48 | 26.1 | 0.15 | 0.09 |
| AD | 41 | 45.1 | 0.19 | 0.14 |
All, Wild, Domesticated, Mesoamerican, Andean, Mesoamerican Wild, Andean Wild, Mesoamerican Domesticated, Andean Domesticated.
Number of genotypes, without considering admixed genotypes between gene pool.
Figure 6.
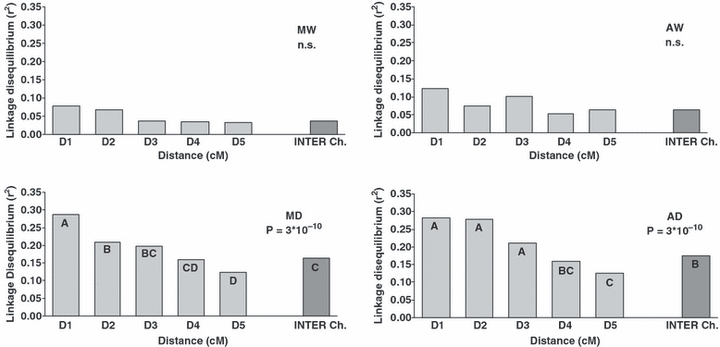
Analysis of LD (r2 plots) as a function of genetic distance (cM) for subgroups (MW, AW, MD and AD). Intra-chromosomal classes of distances (D1: ≤3; D2: >3 and ≤10; D3: >10 and ≤30; D4: >30 and ≤50; D5: >50), inter-chromosomal class of distance (Inter Ch.); different letters on the bar plots indicate differences among the recombination distance class; n.s., not significant.
The standardized index of association (rd) was then calculated within each of the subclusters described above, following the subdivision highlight by structure (Table 4). This summary statistic largely avoids dependency on the number of loci and therefore facilitates comparisons between groups with different numbers of loci and genotypes. In the three Mesoamerican domesticated subclusters (MD_1, MD_2 and MD_3), only MD_1 (race Mesoamerica) and MD_2 (races Durango-Jalisco) showed much lower levels of LD compared to the entire sample. In contrast, the MD_3 subcluster showed a level of LD 3.8-fold higher than the entire sample. In the Andean domesticated population, much lower levels of LD were seen for subclusters AD_1 and AD_3, compared to the entire sample. In the Mesoamerican wild population, subcluster MW_3 was not analyzed because of a lack of polymorphism. The MW_1 subcluster (Mexican genotypes) showed the same level of LD as that for the whole sample, whereas in the MW_2 subcluster (central American genotypes), the level of LD was four-fold higher than the LD in the entire MW group. In the Andean wild population, the levels of LD for the three subclusters (AW_1; AW_2; AW_3) were very similar to those found in the entire sample.
Table 4.
Multilocus linkage disequilibrium (rd) analysis within each subgroup (MW, AW, MD and AD) for each subcluster; the level of polymorphic AFLP markers and the unbiased genetic diversity are also given
| Subgroups† | N | No. polymorphic loci | HE‡ | SD | Multilocus LD (rd-values) |
|---|---|---|---|---|---|
| Mesoamerican wild | |||||
| MW_1 | 27 | 223 | 0.22 | 0.11 | 0.01** |
| MW_2 | 8 | 113 | 0.16 | 0.09 | 0.04** |
| MW_3 | 3 | 0 | – | – | – |
| Mesoamerican domesticated | |||||
| MD_1 | 20 | 135 | 0.12 | 0.06 | 0.02** |
| MD_2 | 14 | 120 | 0.13 | 0.06 | 0.02** |
| MD_3 | 5 | 37 | 0.05 | 0.03 | 0.35** |
| Andean wild | |||||
| AW_1 | 5 | 101 | 0.16 | 0.10 | 0.02** |
| AW_2 | 17 | 69 | 0.07 | 0.04 | 0.03** |
| AW_3 | 9 | 63 | 0.07 | 0.04 | 0.02** |
| Andean domesticated | |||||
| AD_1 | 19 | 102 | 0.08 | 0.04 | 0.02** |
| AD_2 | – | – | – | – | – |
| AD_3 | 10 | 82 | 0.10 | 0.05 | 0.03* |
N, number of genotypes; SD, standard deviation.
Multilocus LD significance: *P = 0.01, **P < 0.01.
Mesoamerican wild (subclusters MW_1, MW_2, MW_3), Mesoamerican domesticated (subclusters MD_1, MD_2, MD_3), Andean wild (subclusters AW_1, AW_2, AW_3), Andean domesticated (subclusters AD_1, AD_2, AD_3).
Unbiased Genetic Diversity (Nei 1978).
Discussion
We have described here the population structure and the levels of LD in wild and domesticated populations of the common bean using a large set of AFLP markers that were located on a genetic map using two different segregating populations (RILs), and then integrated into a consensus map. AFLPs have been extensively used to construct or enrich genetic maps in many plant species (Becker et al.1995; Schondelmaier et al. 1996; Boivin et al. 1999; Liu et al. 2003; Moen et al. 2004; Papa et al. 2005, 2007; Zhong et al.2006; Troggio et al.2007), and they generally give good coverage of the whole genome (Nichols et al. 2003; Moen et al. 2004). In addition, AFLPs have proven to be very useful for diversity studies (Bonin et al. 2007;Berloo et al. 2008; Meudt and Clarke 2007) and are an excellent alternative to simple sequence repeat (SSR) markers to enhance the resolution in studies of population assignments (Campbell et al. 2003; Garoia et al. 2007; Sonstebo et al. 2007).
A potential disadvantage in the use of this technique is the size homoplasy due to the occurrence of co-migrating, nonhomologous fragments (Vekemans et al. 2002) where homoplasy produces underestimations of both within- and between-population diversity (Vekemans et al. 2002; Koopman and Gort 2004; Caballero et al. 2008). However, it should be noted that homoplasy is moderate when, as in this study, closely related genotypes (e.g. within species) are analyzed (Rouppe van der Voort et al. 1997; Vekemans et al. 2002; Koopman 2005), and when small genomes, like that of the common bean, are considered (Althoff et al. 2007). Moreover, the potential bias due to size homoplasy can be prevented by an accurate selection of polymorphic fragments (Vekemans et al. 2002; Koopman and Gort 2004; Caballero et al. 2008), as described in the Materials and methods section.
Diversity and population structure
The two main clusters identified with the analysis of population structure reflect our previous knowledge of the occurrence of two major wild gene pools of P. vulgaris (Gepts et al. 1986; Koenig and Gepts 1989; Khairallah et al. 1990, 1992; Koinange and Gepts 1992; Freyre et al. 1996), in which two independent domestication events took place, one in the Andes and one in Mesoamerica (Singh et al. 1991b,c; Becerra Velasquez and Gepts 1994). The Mesoamerican group included wild genotypes from Mexico, Central America and Colombia, while the genotypes with the ancestral phaseolin I, which originated from northern Peru and Ecuador were classified as admixed even if they are closer to the Mesoamerican cluster.
Even if in the Mesoamerican gene pool the separation between wild and domesticated populations was stronger compared to the Andean cluster, in both gene pools, the wild and domesticated populations can be split into two distinct groups. The domesticated forms further included three groups of accessions. While in Mesoamerica the genotype assignment mostly reflected phenotypic differences related to classifications in ecogeographic races, in the Andean group, it did not relate to any traits or known information included in the passport data.
A similar picture was obtained considering the wild form. Indeed, in the Mesoamerican gene pool, in addition to a weedy group, structure discriminated between Mexican and Central American–Colombian populations, whereas in the Andean gene pool, no possible explanations could be identified to explain their existence. The Mesoamerican and Andean gene pools showed marked differences for both levels of diversity and internal structures, with the Mesoamerican gene pool much more diverse and structured compared to the Andean one. Previous analysis has also suggested that the Mesoamerican and Andean gene pools have different structures and levels of genetic diversity, for both the wild and domesticated populations. Indeed, a higher genetic diversity was observed in the Mesoamerican gene pool, compared to the Andean one (Koenig and Gepts 1989; Beebe et al. 2000, 2001; Papa and Gepts 2003; McClean et al. 2004), even if recent analyses using SSRs have shown more similar levels of diversity between the Mesoamerican and Andean gene pools (Blair et al. 2006b; Kwak and Gepts 2009). In parallel, a higher between-populations component of genetic diversity was found in the Mesoamerican wild populations (using AFLP; Papa and Gepts 2003) than in the Andean wild populations [using random amplification of polymorphic DNA (RAPD); Cattan-Toupance et al. 1998]. A much stronger differentiation has also been seen between the domesticated races from Mesoamerica than between those from South America (Beebe et al. 2000, 2001). Our data obtained using the same markers on a balanced sample of wild and domesticated genotypes confirm these observations. Moreover, because these results were obtained for both the wild and the domesticated forms, the differences seen between gene pools should have originated during the formation and evolution of the two gene pools much earlier than the beginning of cultivation and domestication of the common bean in the Mesoamerican and Andean regions.
It is very interesting to compare our AFLP results with those obtained using SSR loci by Kwak and Gepts (2009) in a comparable sample of P. vulgaris genotypes. Indeed, even if the major results related to the population structure are very similar between these two studies, a few intriguing differences are seen. First, in Kwak and Gepts (2009), the Mesoamerican and Andean wild genotypes did not show strong differences in genetic diversity (ΔH = 0.07), as we found in this study (ΔH = 0.45), or as was found for eight allozyme loci (ΔH = 0.34), calculated from published allelic frequencies (Koenig and Gepts 1989). Similarly, while in this study we observed a strong reduction in genetic diversity due to domestication (wild versus domesticated samples), only in Mesoamerica (ΔH = 0.32), in Kwak and Gepts (2009), was a moderate reduction (about 10%) found, although in both gene pools.
A major difference between the molecular markers mentioned is their different mutational model and mutation rates. The AFLP mutations that are primary due to point mutations within the restriction site, with a small fraction of in/dels that occurs between the two restriction enzyme sites and that should originate co-dominant AFLP loci. For instance, in our case, no more than 10% of the AFLP fragments could be considered as alleles of co-dominant loci, and a similar fraction has been found in other species (for review, see Rodriguez et al. 2006). In contrast, microsatellite polymorphisms are primarily determinated by variation in repeat number and by indels outside of repeat units. Indirect estimates of the AFLP mutational rate have suggested a value ranging between 10−6 and 10−5 (Mariette et al. 2001; Gaudeul et al. 2004; Kropf et al. 2009), whereas the SSRs have much higher mutation rates, varying between 10−3 and 10−4, as found using indirect (Estoup and Angers 1998; Mariette et al. 2001; Garoia et al. 2007) and direct estimates (Vigouroux et al. 2002; Thuillet et al. 2005). Indeed, the number of generations needed for the recovery of genetic diversity (H) after a bottleneck due to mutations is expected to be close to the reciprocal of the mutation rate (Nei et al. 1975; Nei 2005). Thus, markers that differ substantially in their mutation rates can show very different patterns of molecular diversity, as we found in our case. On this basis, our results suggest that the Andean gene pool was subjected to a bottleneck before domestication, which is still evident based on data from the more slowly mutating AFLP markers, but has nearly disappeared based on the more rapidly mutating SSR markers.
Linkage disequilibrium
Considering the whole sample, we detected a very high level of LD, with most of the comparisons (56%) between loci significant at P < 0.01 (Table 3). However, the lower LDs seen for the separate subsamples indicate that the major cause of the level of LD in the common bean is the gene pool structure (Andean versus Mesoamerican). A higher level of LD was found in the Andean compared to the Mesoamerican gene pool. Of note, the same result was obtained for both the wild and domesticated Andean populations, suggesting that the higher LD in the Andean gene pool originated prior to domestication. This increased LD potentially represents a remnant of the increase in LD that may have appeared as a consequence of the migration, genetic drift, and selection that accompanied the establishment of the wild Andean gene pool. Differences between gene pools are also evident in the domesticated populations from the different patterns of LD decay along the chromosomes, with a slower decay seen for the Andean population compared to the Mesoamerican, whereas in the wild population no significant variation was found for any class of map distances.
Overall, the level of LD was much greater in domesticated compared to wild populations. A large effect on LD due to population structure and related to the process of domestication has also been reported in other autogamous species, such as barley, where the genome-wide LD extended from 10 to 15 cM when evaluated with AFLP markers (Kraakman et al. 2004), SSRs (Malysheva-Otto et al. 2006) and single nucleotide polymorphisms (Rostoks et al. 2006). The pattern of LD was extremely population dependent, and was highly related to the process of domestication (Morrell et al. 2005; Caldwell et al. 2006). In soybean, the level of LD of the wild ancestor, Glycine soja, was very limited, compared to the domesticated G. max groups, which showed much higher levels of LD (Hyten et al. 2007). The higher level of LD found in the domesticated compared to the wild populations can be explained by the sole effect of drift (bottleneck effect). However, the excess of inter-chromosomal LD that was found in (and only in) the domesticated population, suggested that the high level of LD in the domesticated population (compared to the wild one) might also be due to the action of epistatic selection (Lewontin 1964). Within the domesticated Mesoamerican and Andean common bean, it was also possible to identify genetic subgroups (associated with races in the Mesoamerican gene pool), where the level of LD was reduced to values very close to those seen for wild populations. These results might be related to selection for different phenotypic architectures that characterized the different races, which should have originated (and were maintained) after the initial step of domestication, mainly because of selection. An alternative hypothesis would invoke the domestication process itself.
Our results have important implications in relation to the development of association mapping projects in the common bean. In particular, it is clear that a key factor is the careful assessment of population structure. Moreover, our results suggest that whole-genome-scan approaches are feasible, and that with the choice of appropriate populations, it will be possible to obtain different resolutions in association studies in the common bean. Additional LD studies focusing on a few genomic segments will be needed to obtain a more complete picture of the level and structure of LD in the common bean. In particular, these studies will be able to evaluate the possibility of conducting LD mapping based on a candidate gene approach using specific populations (e.g. the wild form).
Implications for the origins of the wild populations
Our results raise the question about the origin of wild P. vulgaris. Although the genus Phaseolus is almost certainly of Mexican origin (Delgado-Salinas et al. 2006), sequence studies of the genes coding for phaseolin, the main seed-storage protein, suggest that the ancestral populations of P. vulgaris are likely to have originated in Ecuador and northern Peru (Kami et al. 1995; Gepts et al. 1999). However, our results are not consistent with the hypothesis of a northern Peru–Ecuador origin: (i) both in this study and that of Kwak and Gepts (2009), the northern Peru–Ecuador genotypes with phaseolin type I are closer to the Mesoamerican gene pool rather than to the Andean one; (ii) among the estimates of FK (Falush et al. 2003), a parameter that is similar to FST, but specific for each population and expected to be proportional to the divergence from a common ancestral population, the Mesoamerican and Mexican wild forms show the lowest estimates both in this study and in that of Kwak and Gepts (2009); and (iii) all of the results relating to the molecular diversity and the levels of LD appear to argue in favour of a Mesoamerican origin. Indeed, the Andean populations have patterns of genetic diversity and LD that appear to reflect the occurrence of a strong bottleneck prior to domestication: the Andean wild populations showed almost half of the molecular diversity present in Mesoamerica, a much larger frequency of rare alleles, and a higher level of LD. The occurrence of a bottleneck prior to domestication in the Andes is also supported by comparing AFLP and SSR (Kwak and Gepts 2009) results.
These results tend to question the Peru–Ecuador origins and argue in favour of a Mesoamerican origin of wild P. vulgaris. Although the results presented by Kami et al. (1995) appear to be very robust in the identification of phaseolin type I as the ancestral phaseolin, the present distribution of phaseolin might not reflect its ancient distribution. For example, phaseolin type I might be extinct in Mesoamerica or might still be present but was not included in the samples studied. Indeed, for several reasons (reviewed in Doyle 1992), an agreement between gene phylogeny and species phylogeny is not assured. Thus, our results can be explained together with those of Kami et al. (1995), by considering the phaseolin type I P. vulgaris from northern Peru and Equador as a relict population that migrated from Mesoamerica in ancient times, and that phaseolin I became extinct (or nearly so) in Mesoamerica. Alternatively, our results might be due to the occurrence of a bottleneck in the Andes after the separation between gene pools for unknown reasons. Our results may also be explained by invoking environmental and geographical differences between the wild beans of the two gene pools. The habitat of the Mesoamerican gene pool is much larger, as it not only extends from Colombia to northern Mexico, but also includes a widespread distribution in Mexico (Freytag and Debouck 2002). This large habitat contrasts with that of the wild bean in the Andean region, where it is distributed in a narrow altitudinal fringe on the western and eastern slopes of the Cordillera (Debouck et al. 1993; Freyre et al. 1996). Therefore, the higher genetic diversity of the Mesoamerican gene pool may be associated with a higher effective population size and higher environmental variation in contrast with the Andean gene pool. Moreover, our results can be explained as due to an expansion of diversity in Mesoamerica (e.g. due to population growth). However, in all of these cases, we would expect different trends between the SSRs and AFLPs compared to those seen. Thus, the Mesoamerican origin of the species appear to be the most likely and robust explanation for our results.
Implications for the history of domestication
Our results are also relevant to the domestication history of the common bean. The occurrence of independent domestication events in Mesoamerica and the Andes is well established, due to the large set of coherent results that have been obtained using different approaches based on molecular markers (seed protein: Gepts et al. 1986; Gepts and Bliss 1988; allozymes: Koenig and Gepts 1989; Singh et al. 1991b; RFLPs: Becerra Velasquez and Gepts 1994; RAPDs: Freyre et al. 1996; AFLPs: Tohme et al. 1996; Papa and Gepts 2003; SSRs: Blair et al. 2006a,b; Díaz and Blair 2006) and morphological characteristics (Singh et al. 1991a,c; Gepts 1998). However, the number of domestication events that occurred in the two different regions remains a topic of discussion. From the lower diversity for phaseolin types in the domesticated Mesoamerican gene pool compared to the Andean one, Gepts et al. (1986) suggested that a single domestication event occurred in Mexico whereas multiple domestication events occurred in the Andes. Using molecular markers, the results of Papa and Gepts (2003), Kwak et al. (2009) and Kwak and Gepts (2009) also support the occurrence of a single domestication event in Mesoamerica. However, some studies indicate that from the comparison of the population structures of the two domesticated gene pools, there is an indication of multiple domestication events in Mesoamerica (Singh et al. 1991a,b,c; Beebe et al. 2000). Indeed, this study shows a high population structure related to important phenotypic differences in the domesticated forms from Mesoamerica, whereas almost no structure is seen in the Andes. These results can also be explained by differences between the two wild forms (e.g. the very low molecular diversity in the Andean gene pool). These are paralleled in the domesticated forms, suggesting that they originated prior to domestication. Similarly, from an analysis of cpDNA RFLP data, Chacón et al. (2005) suggested that the common bean has undergone multiple domestications in Mesoamerica. However, as also suggested by Chacón et al. (2005), their results can easily be explained by gene flow between the wild and domesticated forms. Our data support the occurrence of a single domestication event in Mesoamerica, and they also tend to support the same scenario in the Andes, although the low diversity in this gene pool did not provide our study with the appropriate resolution power to identify different genetic groups.
Acknowledgments
We are grateful to P. Gepts for his comments and suggestions, and also for providing the seeds of the two RIL populations used for this study. This study was supported by the Italian Government (MIUR) grant no. # 2005071310, Project PRIN 2005, and by the Università Politecnica delle Marche (years 2005–2009). This work was a component of Monica Rossi's PhD thesis.
Supporting Information
Additional Supporting Information may be found in the online version of this article:
Table S1. List of the genotypes of P. vulgaris used in this study; the classification is based on passport data.
Table S2. The AFLP primer combinations used in this study.
Please note: Wiley-Blackwell are not responsible for the content or functionality of any supporting materials supplied by the authors. Any queries (other than missing material) should be directed to the corresponding author for the article.
Literature cited
- Agapow PM, Burt A. 2000. MultiLocus version 1.2 software. Analysing multi-locus population genetic data. http://www.bio.ic.ac.uk/evolve/software/multilocus/ (accessed on 12 June 2009)
- Akey JM, Zhang G, Zhang K, Jin L, Shriver MD. Interrogating a high-density SNP map for signatures of natural selection. Genome Research. 2002;12:1805–1814. doi: 10.1101/gr.631202. [DOI] [PMC free article] [PubMed] [Google Scholar]
- Althoff DM, Gitzendanner MA, Segraves KA. The utility of amplified fragment length polymorphisms in phylogenetics: a comparison of homology within and between genomes. Systematic Biology. 2007;56:477–484. doi: 10.1080/10635150701427077. [DOI] [PubMed] [Google Scholar]
- Alvarez MT, Sanchez De Miera LE, Perez De La Vega M. Genetic variation in common and runner beans of the northern Meseta in Spain. Genetic Resources and Crop Evolution. 1998;45:243–251. [Google Scholar]
- Angioi SA, Desiderio F, Rau D, Bitocchi E, Attene G, Papa R. Development and use of chloroplast microsatellites in Phaseolus spp. and other legumes. Plant Biology. 2009;11:598–612. doi: 10.1111/j.1438-8677.2008.00143.x. [DOI] [PubMed] [Google Scholar]
- Becerra Velasquez VL, Gepts P. RFLP diversity in common bean (Phaseolus vulgaris L.) Genome. 1994;37:256–263. doi: 10.1139/g94-036. [DOI] [PubMed] [Google Scholar]
- Becker J, Vos P, Kuiper M, Salamini F, Heun M. Combined mapping of AFLP and RFLP markers in barley. Molecular and General Genetics. 1995;249:65–73. doi: 10.1007/BF00290237. [DOI] [PubMed] [Google Scholar]
- Beebe S, Skroch P, Tohme J, Duque M, Pedraza F, Nienhuis J. Structure of genetic diversity among common bean landraces of middle-American origin based on correspondence analysis of RAPD. Crop Science. 2000;40:264–273. [Google Scholar]
- Beebe S, Rengifo J, Gaitan E, Duque MC, Tohme J. Diversity and origin of Andean landraces of common bean. Crop Science. 2001;41:854–862. [Google Scholar]
- Berloo R, Zhu A, Ursem R, Verbakel H, Gort G, Antonis van Eeuwijk F. Diversity and linkage disequilibrium analysis within a selected set of cultivated tomatoes. Theoretical and Applied Genetics. 2008;117:89–101. doi: 10.1007/s00122-008-0755-x. [DOI] [PMC free article] [PubMed] [Google Scholar]
- Bitocchi E, Nanni L, Rossi M, Bellucci E, Giardini A, Buonamici A, Vendramin GG, et al. Introgression from modern hybrid varieties into landrace populations of maize (Zea mays ssp. mays L.) in central Italy. Molecular Ecology. 2009;18:603–621. doi: 10.1111/j.1365-294X.2008.04064.x. [DOI] [PubMed] [Google Scholar]
- Blair MW, Iriarte G, Beebe S. QTL analysis of yield traits in an advanced backcross population derived from a cultivated Andean × wild common bean (Phaseolus vulgaris L.) cross. Theoretical and Applied Genetics. 2006a;112:1149–1163. doi: 10.1007/s00122-006-0217-2. [DOI] [PubMed] [Google Scholar]
- Blair MW, Giraldo MC, Buendia HF, Tovar E, Duque MC, Beebe SE. Microsatellite marker diversity in common bean (Phaseolus vulgaris L.) Theoretical and Applied Genetics. 2006b;113:100–109. doi: 10.1007/s00122-006-0276-4. [DOI] [PubMed] [Google Scholar]
- Boivin K, Deu M, Rami JF, Trouche G, Hamon P. Towards a saturated sorghum map using RFLP and AFLP markers. Theoretical and Applied Genetics. 1999;98:320–328. [Google Scholar]
- Bonin A, Taberlet P, Miaud C, Pompanon F. Explorative genome scan to detect candidate loci for adaptation along a gradient of altitude in the common frog (Rana temporaria. Molecular Biology and Evolution. 2007;23:773–783. doi: 10.1093/molbev/msj087. [DOI] [PubMed] [Google Scholar]
- Bradbury PJ, Zhang Z, Kroon DE, Casstevens TM, Ramdoss Y, Buckler ES. TASSEL: software for association mapping of complex traits in diverse samples. Bioinformatics. 2007;23/19:2633–2635. doi: 10.1093/bioinformatics/btm308. http://www.maizegenetics.net/ (accessed on 12 June 2009) [DOI] [PubMed] [Google Scholar]
- Breseghello PL, Finney C, Gaines L, Andrews JT, Penner G, Sorrells ME. Genetic loci related to kernel quality differences between a soft and a hard wheat cultivar. Crop Science. 2005;45:1685–1695. [Google Scholar]
- Brown AHD, Feldman MW, Nevo E. Multilocus structure in natural populations of Hordeum spontaneum. Genetics. 1980;96:523–536. doi: 10.1093/genetics/96.2.523. [DOI] [PMC free article] [PubMed] [Google Scholar]
- Burt A, Koufopanou V, Taylor JW. Population genetics of human-pathogenic fungi. In: Thompson RCA, editor. The Molecular Epidemiology of Infectious Diseases. London, UK: Arnold Publishers; 1999. pp. 229–244. [Google Scholar]
- Caballero A, Quesada H, Rola′n-Alvarez E. Impact of amplified fragment length polymorphism size homoplasy on the estimation of population genetic diversity and the detection of selective loci. Genetics. 2008;179:539–554. doi: 10.1534/genetics.107.083246. [DOI] [PMC free article] [PubMed] [Google Scholar]
- Caicedo AL, Stinchcombe JR, Olsen KM, Schmitt J, Purugganan MD. Epistatic interaction between Arabidopsis FRI and FLC flowering time genes generates a latitudinal cline in a life history trait. Proceedings of the National Academy of Sciences of the United States of America. 2004;101:15670–15675. doi: 10.1073/pnas.0406232101. [DOI] [PMC free article] [PubMed] [Google Scholar]
- Caldwell KS, Russell J, Langridge P, Powell W. Extreme population dependent linkage disequilibrium detected in an inbreeding plant species, Hordeum vulgare. Genetics. 2006;172:557–567. doi: 10.1534/genetics.104.038489. [DOI] [PMC free article] [PubMed] [Google Scholar]
- Campbell D, Duchesne P, Bernatchez L. AFLP utility for population assignment studies: analytical investigation and empirical comparison with microsatellites. Molecular Ecology. 2003;12:1979–1991. doi: 10.1046/j.1365-294x.2003.01856.x. [DOI] [PubMed] [Google Scholar]
- Cardon LR, Bell JI. Association study designs for complex diseases. Nature Reviews, Genetics. 2001;2:91–99. doi: 10.1038/35052543. [DOI] [PubMed] [Google Scholar]
- Cattan-Toupance I, Michalakis Y, Neema C. Genetic structure of wild bean populations in their South-Andean centre of origin. Theoretical and Applied Genetics. 1998;96:844–851. [Google Scholar]
- Chacón SMI, Pickersgill B, Debouck DG. Domestication patterns in common bean (Phaseolus vulgaris L.) and the origin of the Mesoamerican and Andean cultivated races. Theoretical and Applied Genetics. 2005;110:432–444. doi: 10.1007/s00122-004-1842-2. [DOI] [PubMed] [Google Scholar]
- Debouck DG, Toro O, Paredes OM, Johnson WC, Gepts P. Genetic diversity and ecological distribution of Phaseolus vulgaris in northwestern south America. Economic Botany. 1993;47:408–423. [Google Scholar]
- Delgado-Salinas A, Bibler R, Lavin M. Phylogeny of the Genus Phaseolus (Leguminosae): a recent diversification in an ancient landscape. Systematic Botany. 2006;31:779–791. [Google Scholar]
- Díaz LM, Blair MW. Race structure within the Mesoamerican gene pool of common bean (Phaseolus vulgaris L.) as determined by microsatellite markers. Theoretical and Applied Genetics. 2006;114:143–154. doi: 10.1007/s00122-006-0417-9. [DOI] [PubMed] [Google Scholar]
- Doyle JJ. Gene trees and species trees: molecular systematics as one-character taxonomy. Systematic Botany. 1992;17:144–163. [Google Scholar]
- Doyle JJ, Doyle JL. A rapid DNA isolation procedure for small quantities of fresh leaf tissue. Phytochemical Bulletin. 1987;19:11–15. [Google Scholar]
- Duarte J, Dos Santos J, Melo L. Genetic divergence among common beans cultivars from different races based on RAPD markers. Genetic and Molecular Biology. 1999;22:419–426. [Google Scholar]
- Estoup A, Angers B. Microsatellites and minisatellites for molecular ecology: theoretical and experimental considerations. In: Carvalho G, editor. Advances in Molecular Ecology. Amsterdam: IOS Press; 1998. pp. 55–86. [Google Scholar]
- Evanno G, Regnaut S, Goudet J. Detecting the number of clusters of individuals using the software STRUCTURE: a simulation study. Molecular Ecology. 2005;14:2611–2620. doi: 10.1111/j.1365-294X.2005.02553.x. [DOI] [PubMed] [Google Scholar]
- Falush D, Stephens M, Pritchard JK. Inference of population structure using multilocus genotype data: linked loci and correlated allele frequencies. Genetics. 2003;164:1567–1587. doi: 10.1093/genetics/164.4.1567. http://pritch.bsd.uchicago.edu/software.html (accessed on 12 June 2009) [DOI] [PMC free article] [PubMed] [Google Scholar]
- Freyre R, Rios R, Guzman L, Debouck D, Gepts P. Ecogeographic distribution of Phaseolus spp. (Fabaceae) in Bolivia. Economic Botany. 1996;50:195–215. [Google Scholar]
- Freyre R, Skroch PW, Geffroy V, Adam-Blondon AF, Shirmohamadali A, Johnson WC, Llaca V, et al. Towards an integrated linkage map of common bean. Theoretical and Applied Genetics. 1998;97:847–856. [Google Scholar]
- Freytag GF, Debouck DG. Taxonomy, Distribution, and Ecology of the Genus Phaseolus (Leguminosae — Papilionoideae) in North America, Mexico and Central America. Forth Worth, TX: Botanical Research Institute of Texas; 2002. [Google Scholar]
- Fullerton SM, Bartoszewicz A, Ybazeta G, Horikawa Y, Bell GI, Kidd K, Cox N, et al. Geographic and haplotype structure of candidate type 2 diabetes susceptibility variants at the calpain-10 locus. The American Journal of Human Genetics. 2002;70:1096–1106. doi: 10.1086/339930. [DOI] [PMC free article] [PubMed] [Google Scholar]
- Garoia F, Guarniero I, Grifoni D, Marzola S, Tinti F. Comparative analysis of AFLPs and SSRs efficiency in resolving population genetic structure of Mediterranean Solea vulgaris. Molecular Ecology. 2007;16:1377–1387. doi: 10.1111/j.1365-294X.2007.03247.x. [DOI] [PubMed] [Google Scholar]
- Garris A, McCouch S, Kresovich S. Population structure and its effect on haplotype diversity and linkage disequilibrium surrounding the xa5 locus of rice (Oryza sativa L.) Genetics. 2003;165:759–769. doi: 10.1093/genetics/165.2.759. [DOI] [PMC free article] [PubMed] [Google Scholar]
- Gaudeul M, Till-Bottraud I, Barjon F, Manel S. Genetic diversity and differentiation in Eryngium alpinum L. (Apiaceae): comparison of AFLP and microsatellite markers. Heredity. 2004;92:508–518. doi: 10.1038/sj.hdy.6800443. [DOI] [PubMed] [Google Scholar]
- Geffroy V, Sevignac M, De Oliveira JCF, Fouilloux G, Skroch P, Thoquet P, Gepts P, Langin T, Dron M. Inheritance of partial resistance against colletotrichum lindemuthianum in Phaseolus vulgaris and co-localization of Quantitative Trait Loci with genes involved in specific resistance. Molecular Plant-Microbe Interactions. 2000;13:287–296. doi: 10.1094/MPMI.2000.13.3.287. [DOI] [PubMed] [Google Scholar]
- Gepts P. Origin and evolution of cultivated Phaseolus species. In: Pickersgill B, Lock J, editors. Advances in Legume Systematics, Part 8. Legumes of Economic Importance. Kew, UK: Kew Botanical Gardens; 1996. pp. 65–74. [Google Scholar]
- Gepts P. Origin and evolution of common bean, past event and recent trends. American Society for Horticultural Science. 1998;33:1124–1130. [Google Scholar]
- Gepts P, Bliss FA. Dissemination pathways of common bean (Phaseolus vulgaris, Fabaceae) deduced from phaseolin electrophoretic variability. II. Europe and Africa. Economic Botany. 1988;42:86–104. [Google Scholar]
- Gepts P, Osborn TC, Rashka K, Bliss FA. Phaseolin-protein variability in wild forms and landraces of the common bean (Phaseolus vulgaris): evidence for multiple centers of domestication. Economic Botany. 1986;40/4:451–468. [Google Scholar]
- Gepts P, Nodari R, Tsai R, Koinange EMK, Llaca V, Gilbertson R, Guzman P. Linkage mapping in common bean. Annual Report of the Bean Improvement Cooperative. 1993;36:24–38. [Google Scholar]
- Gepts P, Papa R, Coulibaly S, Gonzalez Mejıa A, Pasquet R. Proceeding of 7th MAFF International Workshop on Genetic Resources. Tsukuba, Japan: National Institute of Agrobiological Resources; 1999. Wild legume diversity and domestication – insights from molecular methods in Wild legumes; pp. 19–31. [Google Scholar]
- Hill WG, Robertson A. Linkage disequilibrium in finite populations. Theoretical and Applied Genetics. 1968;38:226–231. doi: 10.1007/BF01245622. [DOI] [PubMed] [Google Scholar]
- Hyten DL, Choi IJ, Song Q, Shoemaker RC, Nelson RL, Costa JM, Specht JE, et al. Highly variable patterns of linkage disequilibrium in multiple soybean populations. Genetics. 2007;175:1937–1944. doi: 10.1534/genetics.106.069740. [DOI] [PMC free article] [PubMed] [Google Scholar]
- Kami J, Becerra Velasquez V, Debouck DG, Gepts P. Identification of presumed ancestral DNA sequences of phaseolin in Phaseolus vulgaris. Proceedings of the National Academy of Sciences of the United States of America. 1995;92:1101–1104. doi: 10.1073/pnas.92.4.1101. [DOI] [PMC free article] [PubMed] [Google Scholar]
- Khairallah MM, Adams MW, Sears BB. Mitochondrial DNA polymorphisms of Malawian bean lines: further evidence for two major gene pools. Theoretical and Applied Genetics. 1990;80:753–761. doi: 10.1007/BF00224188. [DOI] [PubMed] [Google Scholar]
- Khairallah MM, Sears BB, Adams MW. Mitochondrial restriction fragment length polymorphisms in wild Phaseolus vulgaris L.: insights on the domestication of the common bean. Theoretical and Applied Genetics. 1992;84:915–922. doi: 10.1007/BF00227404. [DOI] [PubMed] [Google Scholar]
- Koenig R, Gepts P. Allozyme diversity in wild Phaseolus vulgaris: further evidence for two major centers of genetic diversity. Theoretical and Applied Genetics. 1989;78:809–817. doi: 10.1007/BF00266663. [DOI] [PubMed] [Google Scholar]
- Kohn MH, Pelz HJ, Wayne RK. Natural selection mapping of the warfarin-resistance gene. Proceedings of the National Academy of Sciences of the United States of America. 2000;97:7911–7915. doi: 10.1073/pnas.97.14.7911. [DOI] [PMC free article] [PubMed] [Google Scholar]
- Koinange EMK, Gepts P. Hybrid weakness in wild Phaseolus vulgaris L. Journal of Heredity. 1992;83:135–139. [Google Scholar]
- Koinange EMK, Singh SP, Gepts P. Genetic control of the domestication syndrome in common bean. Crop Science. 1996;36:1037–1145. [Google Scholar]
- Koopman WJM. Phylogenetic signal in AFLP data sets. Systematic Biology. 2005;54:197–217. doi: 10.1080/10635150590924181. [DOI] [PubMed] [Google Scholar]
- Koopman WJM, Gort G. Significance tests and weighted values for AFLP similarities, based on Arabidopsis in silico AFLP fragment length distributions. Genetics. 2004;167:1915–1928. doi: 10.1534/genetics.103.015693. [DOI] [PMC free article] [PubMed] [Google Scholar]
- Kosambi DD. The estimation of map distance from recombination values. Annals of Eugenetic. 1944;12:172–175. [Google Scholar]
- Kraakman ATW, Niks RE, Van den Berg PMMM, Stam P, Van Eeuwijk FA. Linkage disequilibrium mapping of yield and yield stability in modern spring barley cultivars. Genetics. 2004;168:435–446. doi: 10.1534/genetics.104.026831. [DOI] [PMC free article] [PubMed] [Google Scholar]
- Kropf M, Comes HP, Kadereit JW. An AFLP clock for the absolute dating of shallow-time evolutionary history based on the intraspecific divergence of southwestern European alpine plant species. Molecular Ecology. 2009;18:697–708. doi: 10.1111/j.1365-294X.2008.04053.x. [DOI] [PubMed] [Google Scholar]
- Kwak M, Gepts P. Structure of genetic diversity in the two major gene pools of common bean (Phaseolus vulgaris L, Fabaceae) Theoretical and Applied Genetics. 2009;118:979–992. doi: 10.1007/s00122-008-0955-4. [DOI] [PubMed] [Google Scholar]
- Kwak M, Velasco D, Gepts P. Mapping homologous sequences for determinacy and photoperiod sensitivity in common bean (Phaseolus vulgaris. Journal of Heredity. 2009;99:283–291. doi: 10.1093/jhered/esn005. [DOI] [PubMed] [Google Scholar]
- Lai CG, Lyman RF, Long AD, Langley CH, Mackay TFC. Naturally occurring variation in bristle number and DNA polymorphisms at the scabrous locus of Drosophila melanogaster. Science. 1994;266:1697–1702. doi: 10.1126/science.7992053. [DOI] [PubMed] [Google Scholar]
- Lander P, Green J, Abrahamson A, Barlow M, Lincoln DS, Newberg L. MAPMAKER: an interactive computer package for constructing primary genetic linkage maps of experimental and natural populations. Genomics. 1987;1:174–181. doi: 10.1016/0888-7543(87)90010-3. [DOI] [PubMed] [Google Scholar]
- Lewontin RC. The interaction of selection and linkage. I. General considerations; heterotic models. Genetics. 1964;49:49–67. doi: 10.1093/genetics/49.1.49. [DOI] [PMC free article] [PubMed] [Google Scholar]
- Lin J, Morrel PL, Clegg T. The influence of linkage and inbreeding on patterns of nucleotide sequence diversity at duplicate alcohol dehydrogenase loci in wild barley (Hordeum vulgare ssp spontaneum) Genetics. 2002;162:2007–2015. doi: 10.1093/genetics/162.4.2007. [DOI] [PMC free article] [PubMed] [Google Scholar]
- Liu Z, Karsi A, Li P, Cao D, Dunham R. An AFLP-based genetic linkage map of channel catfish (Ictalurus punctatus) constructed by using an interspecific hybrid resource family. Genetics. 2003;165:687–694. doi: 10.1093/genetics/165.2.687. [DOI] [PMC free article] [PubMed] [Google Scholar]
- Lynch M, Walsh B. Genetics and Analysis of Quantitative Traits. Sunderland, MA, USA: Sinauer Associates; 1997. [Google Scholar]
- Malysheva-Otto LV, Ganal MW, Röder M. Analysis of molecular diversity, population structure and linkage disequilibrium in a worldwide survey of cultivated barley germplasm (Hordeum vulgare L.) BMC Genetics. 2006;7:6. doi: 10.1186/1471-2156-7-6. [DOI] [PMC free article] [PubMed] [Google Scholar]
- Mariette S, Chagne D, Lezier C, Pastuszka P, Raffin A, Plomion C, Kremer A. Genetic diversity within and among Pinus pinaster populations: comparison between AFLP and microsatellite markers. Heredity. 2001;86:469–479. doi: 10.1046/j.1365-2540.2001.00852.x. [DOI] [PubMed] [Google Scholar]
- Mather KA, Caicedo AL, Polato NR, Olsen KM, McCouch S, Purugganan MD. The extent of linkage disequilibrium in rice (Oryza sativa L.) Genetics. 2007;188:2223–2232. doi: 10.1534/genetics.107.079616. [DOI] [PMC free article] [PubMed] [Google Scholar]
- Mazzucato A, Papa R, Bitocchi E, Mosconi P, Nanni L, Negri V, Picarella ME, et al. Genetic diversity, structure and marker-trait associations in a collection of Italian tomato (Solanum lycopersicum L.) Theoretical and Applied Genetics. 2008;116:657–669. doi: 10.1007/s00122-007-0699-6. [DOI] [PubMed] [Google Scholar]
- McClean PE, Lee RK. Genetic architecture of chalcone isomerase non-coding regions in common bean (Phaseolus vulgaris L.) Genome. 2007;50:203–214. doi: 10.1139/g07-001. [DOI] [PubMed] [Google Scholar]
- McClean PE, Lee RK, Miklas PN. Sequence diversity analysis of dihydroflavonol 4-reductase intron 1 in common bean. Genome. 2004;47:266–280. doi: 10.1139/g03-103. [DOI] [PubMed] [Google Scholar]
- Meudt H, Clarke AC. Almost forgotten or latest practice? AFLP applications, analyses and advances. Trends in Plant Science. 2007;12:106–117. doi: 10.1016/j.tplants.2007.02.001. [DOI] [PubMed] [Google Scholar]
- Moen T, Hoyheim B, Munck H, Gomez-Raya L. A linkage map of Atlantic salmon (Salmo salar) reveals an uncommonly large difference in recombination rate between the sexes. Animal Genetics. 2004;35:81–92. doi: 10.1111/j.1365-2052.2004.01097.x. [DOI] [PubMed] [Google Scholar]
- Morrell PL, Toleno DM, Lundy KE, Clegg MT. Low levels of linkage disequilibrium in wild barley (Hordeum vulgare ssp. spontaneum) despite high rates of self-fertilization. Proceedings of the National Academy of Sciences of the United States of America. 2005;102:2442–2447. doi: 10.1073/pnas.0409804102. [DOI] [PMC free article] [PubMed] [Google Scholar]
- Nei M. Estimation of average heterozygosity and genetic distance from a small number of individuals. Genetics. 1978;89:583–590. doi: 10.1093/genetics/89.3.583. [DOI] [PMC free article] [PubMed] [Google Scholar]
- Nei M. Bottlenecks, genetic polymorphism and speciation. Genetics. 2005;170:1–4. doi: 10.1093/genetics/170.1.1. [DOI] [PMC free article] [PubMed] [Google Scholar]
- Nei M, Maruyama T, Chakraborty R. The bottleneck effect and genetic variability of populations. Evolution. 1975;29:1–10. doi: 10.1111/j.1558-5646.1975.tb00807.x. [DOI] [PubMed] [Google Scholar]
- Nichols KM, Young WP, Danzmann RG, Robison BD, Rexroad C, Noakes M, Phillips RB, et al. A consolidated linkage map for rainbow trout, Oncorhynchus mykiss. Animal Genetics. 2003;34/2:102–115. doi: 10.1046/j.1365-2052.2003.00957.x. [DOI] [PubMed] [Google Scholar]
- Nodari RO, Tsai SM, Guzman P, Gepts P. Towards an integrated linkage map of common bean. II. Development of an RFLP-based linkage map. Theoretical and Applied Genetics. 1993;85:513–520. doi: 10.1007/BF00220907. [DOI] [PubMed] [Google Scholar]
- Nordborg M, Borevitz JO, Bergelson J, Berry CC, Chory J, Hagenblad J, Kreitman M, et al. The extent of linkage disequilibrium in Arabidopsis thaliana. Nature Genetics. 2002;30:190–193. doi: 10.1038/ng813. [DOI] [PubMed] [Google Scholar]
- Papa R, Gepts P. Asymmetry of gene flow and differential geographical structure of molecular diversity in wild and domesticated common bean (Phaseolus vulgaris L.) from Mesoamerica. Theoretical and Applied Genetics. 2003;106:239–250. doi: 10.1007/s00122-002-1085-z. [DOI] [PubMed] [Google Scholar]
- Papa R, Acosta J, Delgado-Salinas A, Gepts P. A genome-wide analysis of differentiation between wild and domesticated Phaseolus vulgaris from Mesoamerica. Theoretical and Applied Genetics. 2005;111:1147–1158. doi: 10.1007/s00122-005-0045-9. [DOI] [PubMed] [Google Scholar]
- Papa R, Nanni L, Sicard D, Rau D, Attene G. The evolution of genetic diversity in Phaseolus vulgaris L. In: Motley TJ, Zerega N, Cross H, editors. New Approaches to the Origins, Evolution and Conservation of Crops. Darwin's Harvest. New York, NY, USA: Columbia University Press; 2006. pp. 121–142. [Google Scholar]
- Papa R, Bellucci E, Rossi M, Leonardi S, Rau D, Gepts P, Nanni L, et al. Tagging the signatures of domestication in common bean (Phaseolus vulgaris) by means of pooled DNA samples. Annals of Botany. 2007;100:1039–1051. doi: 10.1093/aob/mcm151. [DOI] [PMC free article] [PubMed] [Google Scholar]
- Pedrosa HA, Cícero C, Souza A, Mosiolek M, Blair MW, Schweizer D, Guerra M. Extensive ribosomal DNA amplification during Andean common bean (Phaseolus vulgaris L.) evolution. Theoretical and Applied Genetics. 2006;112:924–933. doi: 10.1007/s00122-005-0196-8. [DOI] [PubMed] [Google Scholar]
- Pedrosa HA, Porch T, Gepts P. Standard nomenclature for common bean chromosomes and linkage groups. Annual Report of the Bean Improvement Cooperative. 2008;51:106–107. [Google Scholar]
- Pritchard JK, Stephens P, Donnelly P. Inference of population structure using multilocus genotype data. Genetics. 2000;155:945–959. doi: 10.1093/genetics/155.2.945. [DOI] [PMC free article] [PubMed] [Google Scholar]
- Remington DL, Thornsberry JM, Matsuoka Y, Wilson LM, Whitt SR, Doebley J, Kresovich S, et al. Structure of linkage disequilibrium and phenotypic association in the maize genome. Proceedings of the National Academy of Sciences of the United States of America. 2001;98:11479–11484. doi: 10.1073/pnas.201394398. [DOI] [PMC free article] [PubMed] [Google Scholar]
- Rodriguez M, O'Sullivan D, Donini P, Papa R, Chiapparini E, Leigh F, Attene G. Integration of retrotransposons-based markers in a linkage map of barley. Molecular Breeding. 2006;17:173–184. [Google Scholar]
- Rosales-Serna R, Hernández-Delgado S, González-Paz M, Acosta-Gallegos JA, Mayek-Pérez N. Genetic relationships and diversity revealed by AFLP markers in Mexican common bean bred cultivars. Crop Science. 2005;45:1951–1957. [Google Scholar]
- Rostoks N, Ramsay L, MacKenzie K, Cardle L, Bhat PR, Roose ML, Svensson JT. Recent history of artificial outcrossing facilitates whole genome association mapping in elite inbred crop varieties. Proceedings of the National Academy of Sciences of the United States of America. 2006;103:18656–18661. doi: 10.1073/pnas.0606133103. [DOI] [PMC free article] [PubMed] [Google Scholar]
- Rouppe van der Voort JN, Van Zandvoort P, Van Eck HJ, Folkertsma RT, Hutten RC, Draaistra J, Gommers FJ, et al. Use of allele specificity of comigrating AFLP markers to align genetic maps from different potato genotypes. Molecular and General Genetics. 1997;255:438–447. doi: 10.1007/s004380050516. [DOI] [PubMed] [Google Scholar]
- Schondelmaier J, Steinrucken G, Jung C. Integration of AFLP markers into a linkage map of sugar beet (Beta vulgaris L.) Plant Breeding. 1996;115:231–237. [Google Scholar]
- Singh SP, Gepts P, Debouck DG. Races of common bean (PhaseoIus vulgaris L., Fabaceae) Economic Botany. 1991a;45:379–396. [Google Scholar]
- Singh SP, Nodari R, Gepts P. Genetic diversity in cultivated common bean. I. Allozymes. Crop Science. 1991b;31:19–23. [Google Scholar]
- Singh SP, Gutierrez JA, Molina A, Urrea C, Gepts P. Genetic diversity in cultivated common bean: II. Marker-based analysis of morphological and agronomic traits. Crop Science. 1991c;31:23–29. [Google Scholar]
- Singh RJ, Kim HH, Hymowitz T. Distribution of rDNA loci in the genus Glycine Willd. Theoretical and Applied Genetics. 2001;103:212–218. [Google Scholar]
- Slatkin M. Disequilibrium mapping of a quantitative-trait locus in an expanding population. The American Journal of Human Genetics. 1999;64:1765–1773. doi: 10.1086/302413. [DOI] [PMC free article] [PubMed] [Google Scholar]
- Sonstebo JH, Borgstrom R, Heun M. A comparison of AFLPs and microsatellites to identify the population structure of brown trout (Salmo trutta L.) populations from Hardangervidda, Norway. Molecular Ecology. 2007;16:1427–1438. doi: 10.1111/j.1365-294X.2007.03256.x. [DOI] [PubMed] [Google Scholar]
- Thornsberry JM, Goodman MM, Doebley J, Kresovich S, Nielsen D, Buckler ES. Dwarf8 polymorphisms associate with variation in flowering time. Nature Genetics. 2001;28:286–289. doi: 10.1038/90135. [DOI] [PubMed] [Google Scholar]
- Thuillet AC, Bataillon T, Poirier S, Santoni S, David JL. Estimation of long-term effective population sizes through the history of durum wheat using microsatellite data. Genetics. 2005;169:1589–1599. doi: 10.1534/genetics.104.029553. [DOI] [PMC free article] [PubMed] [Google Scholar]
- Tian Q, Uhlir NJ, Reed JW. Arabidopsis SHY2/IAA3 inhibits auxinregulated gene expression. Plant Cell. 2002;14:301–319. doi: 10.1105/tpc.010283. [DOI] [PMC free article] [PubMed] [Google Scholar]
- Tohme J, Gonzalez DO, Beebe S, Duque MC. AFLP analysis of gene pools of a wild bean core collection. Crop Science. 1996;36:1375–1384. [Google Scholar]
- Troggio M, Malacarne G, Coppola G, Segala C, Cartwright DA, Pindo M, Stefanini M, et al. A dense single-nucleotide polymorphism-based genetic linkage map of grapevine (Vitis vinifera L.) anchoring Pinot Noir bacterial artificial chromosome Contigs. Genetics. 2007;176:2637–2650. doi: 10.1534/genetics.106.067462. [DOI] [PMC free article] [PubMed] [Google Scholar]
- Vallejos EC, Sakiyama NS, Chase CD. A molecular marker-based linkage map of Phaseolus vulgaris L. Genetics. 1992;131:733–740. doi: 10.1093/genetics/131.3.733. [DOI] [PMC free article] [PubMed] [Google Scholar]
- Vekemans X, Beauwens T, Lemaire M, Roldan-Ruiz I. Data from amplified fragment length polymorphism (AFLP) markers show indication of size homoplasy and of a relationship between degree of homoplasy and fragment size. Molecular Ecology. 2002;11:139–151. doi: 10.1046/j.0962-1083.2001.01415.x. [DOI] [PubMed] [Google Scholar]
- Vigouroux Y, McMullen M, Hittinger CT, Houchins K, Schulz L, Kresovich S, Matsuoka Y, et al. Identifying genes of agronomic importance in maize by screening microsatellites for evidence of selection during domestication. Proceeding of National Academy of Science of the United States of America. 2002;99:9650–9655. doi: 10.1073/pnas.112324299. [DOI] [PMC free article] [PubMed] [Google Scholar]
- Vigouroux Y, Mitchell S, Matsuoka Y, Hamblin M, Kresovich SJ, Smith SC, Jaqueth J, et al. An analysis of genetic diversity across the maize genome using microsatellites. Genetics. 2005;169:1617–1630. doi: 10.1534/genetics.104.032086. [DOI] [PMC free article] [PubMed] [Google Scholar]
- Vos P, Hogers R, Bleeker M, Reijans M, Van de Lee T, Hornes M, Frijters A, et al. AFLP: a new technique for DNA fingerprinting. Nucleic Acids Research. 1995;23/21:4407–4414. doi: 10.1093/nar/23.21.4407. [DOI] [PMC free article] [PubMed] [Google Scholar]
- Wright SI, Bi IV, Schroeder SG, Yamasaki M, Doebley JF, McMullen MD, Gaut BS. The effect of artificial selection on the maize genome. Science. 2005;308:1310–1314. doi: 10.1126/science.1107891. [DOI] [PubMed] [Google Scholar]
- Zhao K, Aranzana MJ, Kim S, Lister C, Shindo C, Tang C, Toomajian C, et al. An Arabidopsis example of association mapping in structured samples. PLoS Genetics. 2007;3:71–82. doi: 10.1371/journal.pgen.0030004. [DOI] [PMC free article] [PubMed] [Google Scholar]
- Zhong D, Menge DM, Temu EA, Chen H, Yan G. Amplified fragment length polymorphism mapping of quantitative trait loci for malaria parasite susceptibility in the Yellow Fever mosquito Aedes aegypti. Genetics. 2006;173:1337–1345. doi: 10.1534/genetics.105.055178. [DOI] [PMC free article] [PubMed] [Google Scholar]
- Zhu YL, Song QJ, Hyten DL, Van Tassell CP, Matukumalli LK, Grimm DR, Hyatt SM, et al. Single-nucleotide polymorphisms in soybean. Genetics. 2003;163:1123–1134. doi: 10.1093/genetics/163.3.1123. [DOI] [PMC free article] [PubMed] [Google Scholar]
- Zhu Q, Zheng X, Luo J, Gaut BS, Song GE. Multilocus analysis of nucleotide variation of Oryza sativa and its wild relatives: severe bottleneck during domestication of rice. Molecular Biology and Evolution. 2007;24:875–888. doi: 10.1093/molbev/msm005. [DOI] [PubMed] [Google Scholar]
Associated Data
This section collects any data citations, data availability statements, or supplementary materials included in this article.