

Abstract
Age and size at maturation have declined dramatically in many commercial fish stocks over the past few decades – changes that have been widely attributed to fishing pressure. We performed an analysis of such trends across multiple studies, to test for the consistency of life history changes under fishing, and for their association with the intensity of exploitation (fishing mortality rate). We analyzed 143 time series from 37 commercial fish stocks, the majority of which originated from the North Atlantic. Rates of phenotypic change were calculated for two traditional maturation indices (length and age at 50% maturity), as well as for probabilistic maturation reaction norms (PMRNs). We found that all three indices declined in heavily exploited populations, and at a rate that was strongly correlated with the intensity of fishing (for length at 50% maturity and PMRNs). These results support previous assertions that fishing pressure is playing a major role in the life history changes observed in commercial fish stocks. Rates of change were as strong for PMRNs as for age and size at 50% maturity, which is consistent with the hypothesis that fishing-induced phenotypic changes can sometimes have a genetic basis.
Keywords: contemporary evolution, darwins, fisheries-induced evolution, life history evolution, microevolution, over-fishing, rapid evolution, selective harvesting
Introduction
It has long been hypothesized that fishing can cause phenotypic changes in exploited fish populations (Miller 1957; Borisov 1978; Ricker 1981; Law and Grey 1989; Stokes et al. 1993). In particular, fishing may lead to changes in life history traits, such as age and size at maturation, because these traits are especially sensitive to altered mortality schedules (Stearns 1992). Matching this expectation, substantial changes in age and size at maturation have been observed in many commercial fish stocks (see reviews by Miller 1957; Policansky 1993; Trippel 1995; Rochet 1998; Law 2000; Stokes and Law 2000; Heino and Godo 2002; Hutchings and Baum 2005; Jorgensen et al. 2007; Fenberg and Roy 2008; Heino and Dieckmann 2008). Despite the apparent ubiquity of these trends, it has proven difficult to confirm that fishing per se is actually the cause – because competing explanatory factors are hard to rule out in observational studies. In particular, long-term environmental trends (e.g., increasing sea surface temperatures) have coincided with increasing exploitation in many fish stocks, and these environmental factors can influence maturation in fishes (e.g., Cox and Hinch 1997; Shuter et al. 2009). Although a few studies have formally considered some environmental factors, and ruled them out statistically (Ricker 1981; Rijnsdorp 1993; Barot et al. 2004), many other studies have not rigorously accounted for them. Moreover, some studies have concluded that the principal drivers of life history changes in particular fish stocks are environmental variables other than fishing pressure (e.g., Cox and Hinch 1997; Cardinale and Modin 1999). We suggest that one way to inform the importance of fishing per se is to test, across multiple fish stocks, whether the rate of phenotypic change in life history traits is correlated with the intensity of exploitation. If fishing truly is a powerful and common driver of phenotypic change in nature, then lightly-fished stocks should exhibit little or no change in life history traits, whereas heavily-fished stocks should show rapid and dramatic changes.
We surveyed the literature on commercial fish stocks to calculate rates of life history change. We then used this data set to ask (i) whether rates of phenotypic change in life history traits are correlated with the intensity of exploitation, and (ii) whether any such correlations are in the direction expected from theory. We therefore now briefly review theory concerning life history change in response to fishing.
Mechanisms and responses
Fishing may drive life history changes via at least two different mechanisms – in addition to the immediate numerical effects of mortality (Nelson and Soulé 1987; Stokes et al. 1993; Smith 1994; Trippel 1995; Law 2000; Heino and Godo 2002). First, fishing may induce plastic changes in life history traits. For example, heavy fishing pressure often leads to drastic declines in population size (Hutchings and Baum 2005), which in turn can lead to the relaxation of intraspecific competition, and thus increase individual growth rates of the survivors (Policansky 1993). As a result of these accelerated growth rates, fish in heavily exploited stocks can mature at younger ages, and can show associated changes in size at maturation (Heino and Godo 2002; Kuparinen and Merila 2007). Second, fishing may induce evolutionary (genetic) changes in fish stocks by selecting against particular life histories. The potential for fisheries-induced evolution seems strong given that (i) almost all modern commercial fisheries are highly selective, especially with respect to age and size (Heino and Godo 2002); (ii) fisheries sometimes remove as much as 50% of the individuals in populations annually (Stokes and Law 2000); and (iii) life history traits in fish are at least moderately heritable (h2 for age at maturation = 0.31 ± 0.19, mean from eight studies; h2 for length at maturation = 0.30 ± 0.21, mean from 17 studies reviewed by Law 2000). Furthermore, laboratory selection experiments using salmonids (e.g., Gjedrem 1983) and Atlantic silversides (Menida menida) (Conover and Munch 2002; Conover et al. 2005; Walsh et al. 2006) have demonstrated that life history traits can evolve in response to selection. Finally, rapid genetic divergence in life history traits driven by altered mortality schedules has also been documented in the wild for introduced populations of guppies (Poecilia reticulata) (Reznick et al. 1990; Reznick and Ghalambor 2005) and mosquito fish (Gambusia affinis) (Stearns 1983). All of these results support the possibility of life history evolution on contemporary time scales in nature.
The effects of these two mechanisms (plasticity or genetic change) can be jointly visualized using probabilistic maturation reaction norms (PMRNs). PMRNS are functions that describe the probability that an immature individual of a given age and size will mature during a specified time interval (Heino et al. 2002; Dieckmann and Heino 2007). Under this conceptual framework, plastic responses are visualized as shifts along the reaction norm mediated by changes in growth rate, whereas genetic changes are visualized as a shift in the position or shape of the maturation reaction norm itself. Empirical studies are therefore increasingly examining changes in PMRNs, instead of just size or age at 50% maturity, although the inferential strength of this method depends on accurately removing all of the important plastic effects (if any).
Plastic and genetic changes can both occur in harvested populations, although they may operate on different time scales, at different rates, and even in different directions. In terms of genetic responses, life history theory generally predicts that fishing should select for earlier maturation at smaller sizes (Jorgensen et al. 2007). This expectation arises because most commercial fisheries are highly size-selective; typically targeting individuals above a certain size threshold (Kuparinen and Merila 2007). This selectivity can result from the use of particular types of fishing gear, such as trawls, or specific regulations, such as minimum slot sizes (Jorgensen et al. 2009). As a result, individuals that manage to reproduce at a small size/young age will often have higher fitness (e.g., Ratner and Lande 2001; Ernande et al. 2004; de Roos et al. 2006; Andersen et al. 2007). Moreover, even fisheries that impose nonselective mortality can favor reduced age and size at maturation (e.g., Law and Grey 1989; de Roos et al. 2006), although not under all conditions (Abrams and Rowe 1996). One exception to the above prediction can occur when only sexually mature individuals are targeted, such as on spawning grounds. Under this type of harvest regime, selection favours increased age at maturation, because fish that remain longer on the feeding grounds will grow larger, and thus have greater reproductive potential when they do mature and enter the spawning grounds where mortality is high (Law and Grey 1989; Heino 1998; Ernande et al. 2004). However, this latter exploitation pattern is unusual (Andersen et al. 2007), and the majority of fisheries likely select for reduced age and size at maturation.
As introduced above, genetic responses to fisheries-induced selection can be accompanied by plastic shifts in life history traits, which can either reinforce, or mask, genetic trends. For age at maturation, plastic increases in growth rate in heavily-fished stocks should lead to earlier maturation (Policansky 1993; Trippel 1995; Law 2000; Heino and Godo 2002), thus reinforcing the pattern expected from genetic change alone. For length at maturation, increased growth rates typically result in greater size at maturation (Abrams and Rowe 1996), thus potentially masking any genetic trend towards smaller size at maturation. However, models that incorporate both plastic and genetic effects still generally predict small increases in length at maturation when fishing mortality is low, but rapid decreases in length at maturation when fishing mortality is high (de Roos et al. 2006).
Overall, we predict that the dominant trend across commercial fish stocks should be a shift towards earlier maturation at smaller sizes. This pattern should manifest itself via negative rates of phenotypic change for length at 50% maturity, age at 50% maturity, and PMRNs. Furthermore, we predict that the rates of change in each of these life history traits across different fish stocks will be positively correlated with fishing mortality.
Methods
Data collection
We searched the peer-reviewed literature (Web of Science) for time series data on life history traits in commercial fish stocks. We did not place any restrictions on the date of publication or the source journal, and we used various permutations of the following search terms: change, trends, ‘age at maturity’, ‘length at maturity’, fish, maturation, ‘life history’, and fishing. We also included data from any relevant technical fisheries reports that were brought to our attention, particularly those published by the Canadian Department of Fisheries and Oceans (DFO) and the North Atlantic Fisheries Organization (NAFO). For simplicity, we focused on commercial finfish species (marine or freshwater). Although we did not impose any a priori geographical restrictions, the majority of studies we found focused on temperate, marine systems from the North Atlantic. Because of the nature of our statistical analyses, we only included stocks for which both phenotypic time series and reliable fishing mortality statistics were available (see below). This requirement greatly reduced the number of time series that we were ultimately able to analyze to 143 time series from 16 different studies. Although this data set was certainly not exhaustive, inclusion or exclusion of studies was independent of the observed phenotypic changes, fishing intensities, and combinations thereof.
Phenotypic data were gathered for three different response variables: length at 50% maturity (L50), age at 50% maturity (A50), and midpoints of PMRNs. L50 and A50 are derived from maturity ogives– demographic functions that describe the probability of being mature at a given age or size, and which depend not only on maturation, but also on mortality and growth rates. In contrast, PMRNs describe the maturation process after removing effects due to variation in growth rates and mortality, and thus disentangle some, but not all, of the potential environmental effects on maturation (Dieckmann and Heino 2007). PMRN mid-points represent the lengths at which the individuals of a given age have a 50% probability of maturing. Studies reporting trends in length-at-age, weight-at-age, or mean age or size in commercial catches were not included (with one exception; see Appendix A), because these data do not directly describe maturation, and they may vary with the selectivity of fishing gear. We chose not to collect data on growth rates, as these data were less widely reported, and because potential changes in growth in response to fishing are more difficult to predict and interpret. However, there is evidence that growth rates have declined in some commercial fish stocks (Jorgensen et al. 2007).
For each time series, we estimated the phenotypic value at the beginning (Z0) and end (Z1) of the study period, as well as the duration of the study (t1−t0 = Δt). To account for year-to-year fluctuations in time series, we estimated (t0, Z0) and (t1, Z1) as the mean of the first and last three data points in each time series, respectively. Alternatively, if the authors had fit linear regressions to their time series, we used the (x,y) co-ordinates at the start and end of these regressions to estimate t0 and t1 and Z0 and Z1. In some cases, the time series spanned a significant change in fishing intensity such as the imposition of a complete fishing moratorium. In these cases, we considered the pre- and postmoratorium periods separately, as in Olsen et al. (2004). We did not include data in cases where Δt was less than the generation length of the species. The rate of phenotypic change for each trait was calculated in darwins, a common index for measuring rates of phenotypic change (Haldane 1948; Gingerich 1993; Hendry and Kinnison 1999). This index represents the proportional change per million years and is calculated as:
An alternative phenotypic rate metric, the haldane, was not used because it required data (i.e., standard deviations in each time step) that were not available for many time series. We did, however, consider one important element of haldanes by also considering elapsed time as the number of generations (years divided by generation lengths). Generation lengths were estimated from stock status reports, published data, and from consultation with fisheries scientists (see Appendices A–C for details). These estimates generally reflect pre-exploitation conditions, and would likely change when age at maturation changes during exploitation.
Fishing intensity was estimated as the instantaneous rate of fishing mortality (F, year−1). While data on fishing mortality are often scarce, F is a good proxy for the strength of selection imposed by a fishery, because it measures the proportion of a population that is removed by the fishery at a given time. Unlike other more widely-reported metrics of fishing intensity (e.g., total landings, catch per unit effort), F is a per capita rate with no other dimensions than time, and therefore has the advantage of being readily comparable across studies. F values were rarely reported in the studies we examined, and so they were obtained from other sources, including stock status reports, online databases, and consultation with fisheries scientists (see Appendices A–C for details). Overall fishing mortality (year−1) for each stock was calculated as the average of yearly estimates of F over the time series (or fraction thereof if some years were missing). In cases where age-specific F estimates were available, we used those for the age classes most heavily targeted by the fishery (i.e., the highest F values). Given potential uncertainty in these estimates of F, we also assigned categorical levels of fishing intensity for each stock: LOW for F < 0.3, MED for 0.3 ≤ F < 0.6, and HIGH for F ≥ 0.6.
Analyses
Not all of the rate estimates in our initial data set were strictly independent: for example, some came from males and females in the same stock, from different age cohorts in the same stock, or from different studies of the same stock. We reduced this nonindependence by retaining only a single rate estimate for each life history trait for each stock, based on the criteria outlined below. Although stocks are often arbitrary management units and may not always represent genetically distinct populations their use here is justified on several grounds: (i) life history traits often vary substantially among stocks (e.g., COSEWIC 2003; Busby et al. 2007), (ii) fishing intensity often varies among stocks (Appendices A–C, this paper), (iii) data are typically reported on a stock by stock basis (see for example Department of Fisheries and Oceans Canada stock status reports), and (iv) management decisions are usually made at the stock level (e.g., imposition of moratoria, see Appendices A–C, this paper). We experimented with reducing our data set in various ways (e.g., selecting the maximum or mean rate per stock, selecting one random entry per stock), but this did not influence our conclusions (results not shown), so we settled on the following protocol. If time series were available for both sexes from a given stock, we included rate estimates for females only. If PMRN midpoints were reported for multiple ages from the same stock, we selected the time-series with the best resolution and smallest confidence intervals (generally the middle of the range of ages reported). If two separate studies reported time series for the same stock, we included whichever series was the longest. If multiple rate estimates were calculated from the same time series (e.g., pre- and postmoratorium for the same stock), we excluded one at random. Finally, even within these reduced stock-level data sets, one might argue for nonindependence of different stocks within a species. We therefore generated a further reduced data set that included only one rate estimate per species, selected at random from the stock-level data set.
To test for the effects of fishing on the rate of phenotypic change in each trait (L50, A50, PMRN) we fit four separate general linear models in R (v. 2.6.1., R Development Core Team 2007). The explanatory variables were fishing mortality (continuous or categorical) and time interval (log10 years or number of elapsed generations), and the response variable was the magnitude of phenotypic change (darwin numerator). We first fitted full models, but the interaction between fishing mortality and time was almost always non-significant. These models were fit separately for each trait and for the stock-level and species-level data sets. Sample sizes were: 18 (stocks) and eight (species) for length at 50% maturity, 25 (stocks) and seven (species) for age at 50% maturity, and 11 (stocks) and four (species) for PMRNs.
Results
Rates of phenotypic change for length at 50% maturity in our stock-level analysis (i.e., after elimination of pseudoreplicated entries) ranged from −24.8 × 10³ to +5.6 × 10³ darwins (mean ± SD = −10.6 ± 9.6). The vast majority (17 out of 18) of these rates were negative (Appendix A), significantly more than expected from chance (Fisher's exact test, P = 0.007). Increasing fishing mortality (F) had a strong negative effect on length at 50% maturity, with the most heavily exploited stocks shifting most rapidly towards smaller sizes at 50% maturity (Figs 1A and 2A). This relationship was significant for the stock-level data sets, regardless of the fishing mortality metric (continuous or categorical F), and the time metric (years or generations) (Table 1). The direction of the trend remained the same for the species-level dataset (Fig. 1B), but statistical significance was lost. Given comparable variances explained between the stock-level and species-level analyses, the reduced significance in the latter was probably the result of the smaller sample size and narrow range of F values (Table 1).
Figure 1.
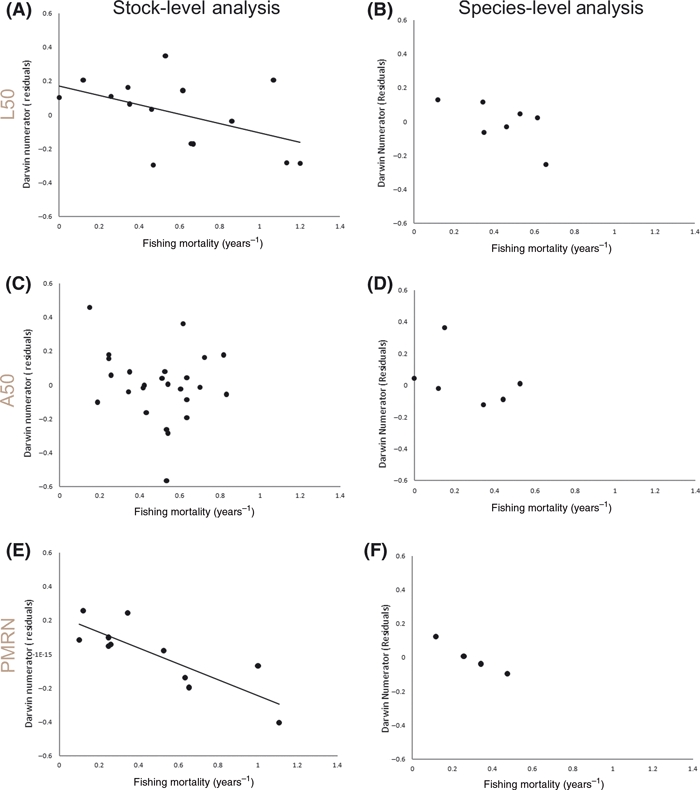
Magnitude of phenotypic change in response to fishing mortality for length at 50% maturity (A,B), age at 50% maturity (C,D) and mid-points of probabilistic maturation reaction norms (PMRNs) (E,F). The Y axis shows residuals from a linear regression of darwin numerators ([ln(Z1) – ln(Z0)]) over time (log10 years); i.e., proportional phenotypic change after accounting for the effects of time. Fishing mortality is the average of yearly estimates of fishing mortality for the time period over which the phenotypic change was measured. Note that one data point (F = 1.9) is not shown in panels C (x = 0.19, y = −0.10) and D (x = 0.19, y = −0.18) so as to match the scale in the other panels. Trendlines were fit only in cases where fishing mortality was found to be significant (P < 0.05).
Figure 2.
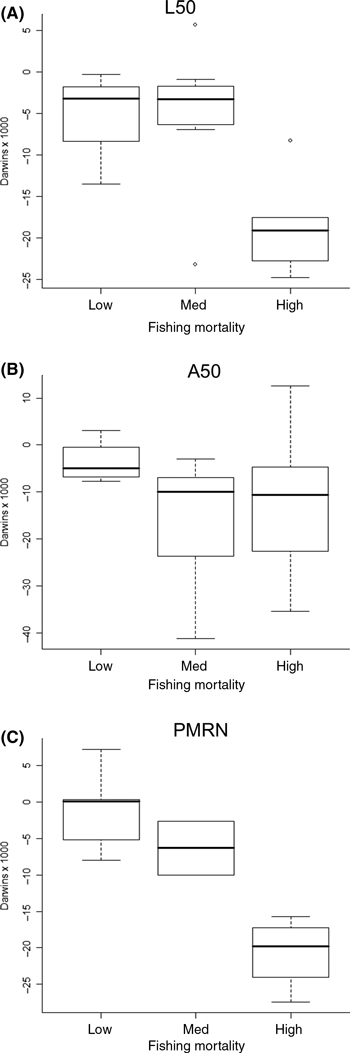
Rates of phenotypic change for stocks experiencing low (F < 0.3), medium (0.3 ≤ F < 0.6) and high (F ≥ 0.6) levels of fishing mortality (year−1). Rates are expressed in darwins (×103) and are plotted separately for length at maturity (A), age at maturity (B) and midpoints of Probabilistic Maturation Reaction Norms (PMRNs) (C). The thick lines represent the median of each distribution, while the top and bottom of the boxes represent the 75th and 25th percentiles, respectively. The dashed error bars represent 1.5 times the interquartile range (approximately 2 standard deviations). Outliers are shown as separate data points.
Table 1.
Effect of fishing mortality on rates of change in length at 50% maturity (L50)
| Model | Factor | F | df (factor, error) | P | Partial η2 |
|---|---|---|---|---|---|
| Stock-level analysis | |||||
| Fishing × Time (R2 = 0.470) | Fishing | 11.11 | 1, 14 | 0.005* | 0.42 |
| Time | 0.08 | 1, 14 | 0.784 | 0.01 | |
| Fishing × Time | 1.20 | 1, 14 | 0.291 | 0.07 | |
| Fishing × Gen (R2 = 0.659) | Fishing | 15.12 | 1, 12 | 0.02* | 0.56 |
| Gen | 4.70 | 1, 12 | 0.051 | 0.28 | |
| Fishing × Gen | 3.35 | 1, 12 | 0.092 | 0.22 | |
| Fcat × Time (R2 = 0.564) | Fcat | 5.61 | 2, 12 | 0.019* | 0.48 |
| Time | 1.00 | 1, 12 | 0.337 | 0.08 | |
| Fcat × Time | 1.64 | 2, 12 | 0.235 | 0.22 | |
| Fcat × Gen (R2 = 0.673) | Fcat | 6.34 | 2, 10 | 0.017* | 0.56 |
| Gen | 6.35 | 1, 10 | 0.03* | 0.39 | |
| Fcat × Gen | 0.78 | 2, 10 | 0.484 | 0.14 | |
| Species-level analysis | |||||
| Fishing × Time (R2 = 0.584) | Fishing | 2.86 | 1, 4 | 0.166 | 0.42 |
| Time | 2.49 | 1, 4 | 0.190 | 0.39 | |
| Fishing × Time | 0.26 | 1, 4 | 0.634 | 0.07 | |
| Fishing × Gen (R2 = 0.779) | Fishing | 4.56 | 1, 3 | 0.122 | 0.60 |
| Gen | 4.84 | 1, 3 | 0.115 | 0.62 | |
| Fishing × Gen | 1.20 | 1, 3 | 0.354 | 0.80 | |
| Fcat × Time (R2 = 0.834) | Fcat | 3.21 | 2, 3 | 0.180 | 0.69 |
| Time | 4.03 | 1, 3 | 0.138 | 0.58 | |
| Fcat × Time | 4.65 | 1, 3 | 0.120 | 0.42 | |
| Fcat × Gen (R2 = 0.823) | Fcat | 2.00 | 2, 2 | 0.333 | 0.67 |
| Gen | 3.37 | 1, 2 | 0.208 | 0.63 | |
| Fcat × Gen | 1.93 | 1, 2 | 0.300 | 0.50 | |
Note: ‘Fishing’ is fishing mortality measured as a continuous variable, and ‘Fcat’ is fishing mortality measured as a categorical variable. ‘Time’ is the duration of the time series measured in years (log10-transformed); and ‘Gen’ is the duration of the time series measured in generations for the species in question. Partial η2 is a measure of effect size and was calculated as SSeffect/(SSeffect + SSerror). Significant P-values (<0.05) are indicated with an asterisk.
Rates of phenotypic change for age at 50% maturity in our stock-level analysis ranged from −41.2 × 10³ to +12.6 × 10³ darwins (mean ± SD = −12.6 ± 12.3). The majority (23 out of 25) of these rates were negative (Appendix B), significantly more than expected from chance (Fisher's exact test, P = 0.001). In contrast to the pattern observed for length at 50% maturity, fishing mortality had much less of an effect on the rate of change in age at maturity among stocks (Figs 1C and 2B). Fishing mortality explained almost none of the variation among rates when considered as a continuous variable (Table 2) and, although it was statistically significant when treated categorically (Table 2), there was substantial overlap among categories (Fig. 2B). Similar results were observed at the species-level (Fig. 1D), with no significant effect of fishing mortality regardless of the time metric used (Table 2).
Table 2.
Effect of fishing mortality on rates of change in age at 50% maturity (A50)
| Model | Factor | F | df (factor, error) | P | Partial η2 |
|---|---|---|---|---|---|
| Stock-level analysis | |||||
| Fishing × Time (R2 = 0.089) | Fishing | 0.82 | 1, 21 | 0.375 | 0.04 |
| Time | 1.11 | 1, 21 | 0.305 | 0.05 | |
| Fishing × Time | 0.13 | 1, 21 | 0.724 | 0.01 | |
| Fishing × Gen (R2 = 0.025) | Fishing | 0.01 | 1, 17 | 0.942 | 0.00 |
| Gen | 0.22 | 1, 17 | 0.643 | 0.01 | |
| Fishing × Gen | 0.21 | 1, 17 | 0.643 | 0.01 | |
| Fcat × Time (R2 = 0.393) | Fcat | 6.57 | 2, 19 | 0.007* | 0.41 |
| Time | 0.00 | 1, 19 | 0.987 | 0.00 | |
| Fcat × Time | 2.42 | 2, 19 | 0.116 | 0.20 | |
| Fcat × Gen (R2 = 0.469) | Fcat | 4.47 | 2, 15 | 0.030* | 0.37 |
| Gen | 0.36 | 1, 15 | 0.557 | 0.02 | |
| Fcat × Gen | 1.96 | 2, 15 | 0.175 | 0.21 | |
| Species-level analysis | |||||
| Fishing + Time (R2 = 0.351) | Fishing | 1.28 | 1, 3 | 0.341 | 0.30 |
| Time | 0.30 | 1, 3 | 0.620 | 0.09 | |
| Fishing × Time | 0.04 | 1, 3 | 0.856 | 0.02 | |
| Fishing + Gen (R2 = 0.607) | Fishing | 0.41 | 1, 1 | 0.638 | 0.33 |
| Gen | 0.50 | 1, 1 | 0.608 | 0.33 | |
| Fishing × Gen | 0.63 | 1, 1 | 0.572 | 0.40 | |
Note: In the species-level analysis, sample size was insufficient to fit models with fishing mortality as a categorical explanatory variable. For abbreviations and other conventions see note for Table 1.
Rates of phenotypic change for PMRNs in our stock-level analysis ranged from −27.5 × 10³ to +7.3 × 10³ darwins (mean ± SD = −9.2 ± 10.6). The majority (8 out of 11) of these rates were negative (Appendix C), although this was not significantly more than expected from chance (Fisher's exact test, P = 0.387). Increasing fishing mortality had a very strong negative effect on PMRNs, with the most heavily exploited stocks showing the most rapid declines in PRMN midpoints (i.e., shifts towards maturation at smaller size for a given age) (Figs 1E and 2C). This relationship was significant for the stock-specific analyses, regardless of the fishing mortality metric (continuous or categorical F), and the time metric (years or generations) (Table 3). The direction of the trend remained the same for the species-level dataset (Fig. 1F), but there were insufficient data (n = 4) to conduct any statistical tests. In contrast to the other traits, the interaction between fishing mortality and time was significant in some models (Table 3).
Table 3.
Effect of fishing mortality on rates of change in probabilistic maturation reaction norm (PMRN) midpoints
| Model | Factor | F | df (factor, error) | P | Partial η2 |
|---|---|---|---|---|---|
| Stock-level analysis | |||||
| Fishing × Time (R2 = 0.930) | Fishing | 62.83 | 1, 7 | <0.001* | 0.90 |
| Time | 12.89 | 1, 7 | 0.009* | 0.65 | |
| Fishing × Time | 17.16 | 1, 7 | 0.004* | 0.71 | |
| F × Gen (R2 = 0.868) | Fishing | 33.45 | 1, 7 | <0.001* | 0.83 |
| Gen | 1.16 | 1, 7 | 0.318 | 0.14 | |
| Fishing × Gen | 11.57 | 1, 7 | 0.011* | 0.62 | |
| Fcat × Time (R2 = 0.913) | Fcat | 17.74 | 2, 5 | 0.005* | 0.88 |
| Time | 7.63 | 1, 5 | 0.040* | 0.61 | |
| Fcat × Time | 4.57 | 2, 5 | 0.074 | 0.65 | |
| Fcat × Gens (R2 = 0.800) | Fcat | 7.72 | 2, 5 | 0.030* | 0.94 |
| Gen | 0.04 | 1, 5 | 0.852 | 0.01 | |
| Fcat × Gen | 2.22 | 2, 5 | 0.204 | 0.47 | |
Note: The sample size was insufficient to fit models at the species level. For abbreviations and other conventions, see note for Table 1.
Discussion
The rates of phenotypic change that we estimated for life history traits in commercial fish stocks are generally consistent with previous estimates (Jorgensen et al. 2007), but are higher than many evolutionary rates previously reported in the literature for other traits, taxa, and contexts (Hendry and Kinnison 1999; Kinnison and Hendry 2001; Hendry et al. 2008). This result supports the intuition that exploitation is a very strong selective force, probably outside the normal intensities of selection in most natural populations (Darimont et al. 2009). It is also true, however, that the particularly rapid rates of change observed here may be partly due to the relatively short duration of time series for harvested species (1–16 generations), given that rates of phenotypic change scale negatively with time interval (Gingerich 1993, 2001; Kinnison and Hendry 2001). One potential reason is that short studies may coincide with periods of intense selection that, in longer studies, would be averaged with periods of stasis and reversals (Grant and Grant 2002).
It is important to acknowledge that the rapid rates of phenotypic change reported here could reflect plasticity – rather than genetic change. This might be particularly likely for age and size at 50% maturity, both of which are known to show substantial plasticity (Stearns 1992). PMRNs, however, are meant to remove at least some of these plastic effects by accounting for variation due to changes in growth and mortality (Dieckmann and Heino 2007). Thus, shifts in PMRNs have been frequently interpreted as representing genetic, rather than plastic, changes in maturation schedules (e.g., Olsen et al. 2004), although such an inference must be made with caution (Dieckmann and Heino 2007; Kraak 2007) In our study, PMRNs often changed as rapidly as age and size at 50% maturity, suggesting that plastic effects of growth are not the sole driver of changes in life history traits.
How well do the observed trends fit theoretical predictions for fisheries-induced life history change? For length at 50% maturity, we observed downward trends in the vast majority of stocks. This pattern is consistent with either genetic responses to fishing-induced selection (Ratner and Lande 2001; Ernande et al. 2004; Andersen et al. 2007), or with a combination of genetic and plastic effects (de Roos et al. 2006). However, this pattern is the opposite of what we would generally expect from plastic effects alone – in which case increases in size at maturation would have been most likely (Abrams and Rowe 1996). Plastic decreases in size at maturation might be theoretically observed in species with positively-sloped PMRNs; however, almost all PMRNs calculated to-date exhibit negative slopes (Heino and Dieckmann 2008). We also found that the intensity of fishing-induced mortality had a significant positive effect on the rate of change in length at 50% maturity, with the most heavily exploited populations experiencing the most precipitous declines in length. This correlation supports the hypothesis that fishing morality is a major driver of observed changes in size at 50% maturity across a diversity of commercial fish stocks.
For age at 50% maturity, we also observed declining trends in the majority of stocks, which is consistent with either genetic or plastic responses to fishing (Heino and Godo 2002; Ernande et al. 2004). However, variation in the rate of decline among stocks was not significantly correlated with fishing mortality, suggesting that trends in age at 50% maturity may be influenced by variables not considered in the present study. For example, strong temporal trends in temperature, large changes in growth rate, or high levels of natural mortality may be the primary drivers of changes of age at 50% maturity in certain stocks. Additionally, significant shifts in age at 50% maturity may have occurred earlier in the exploitation history of some stocks (i.e., before life history data were collected systematically), and further decreases may not be physiologically possible, despite continued high levels of mortality (Trippel 1995).
For PMRNs, we observed declines through time for most stocks, in agreement with predicted genetic responses to size-selective harvesting (Ernande et al. 2004). Increases in PMRN midpoints were typically observed only in postmoratorium situations (e.g., Olsen et al. 2005), or when fishing mortality was low (e.g., Norwegian spring-spawning herring prior to 1955). The rate of decline in PMRNs was positively correlated with fishing mortality, and this relationship was stronger than for age and size at 50% maturity. Overall, our results point to commercial fishing as a major driver of life history change (at least for length at 50% maturity and PMRNs).
The above interpretations are subject to a number of caveats, stemming from the biases and uncertainties inherent in the data compiled for this review. First, our data set suffers from a strong geographical bias, with the majority of data coming from temperate, marine stocks from the Northwest Atlantic. As a result, we should be wary of generalizing our results beyond this region. It would be valuable to collect more data from other fish stocks, particularly from tropical and freshwater populations, which have been severely under-represented in this, and many earlier, reviews. Second, the literature is dominated by work on only a few major commercial species, most notably Atlantic cod, that have captured the public and scientific imagination because of the dramatic declines they suffered as a result of over-fishing. Such stocks might exhibit anomalous or extreme trends, and thereby have an inordinate effect in combined analyses. On a related note, only a few fish families are represented in our data set, most notably the Pleuronectidae, Gadidae, and Salmonidae. Given that life history characteristics are often conserved within families, and that different life history characteristics influence vulnerability to fishing (Jennings et al. 1999), the set of families that we considered are probably not representative of all possible responses to fishing. Third, we used stocks defined for fisheries management as our units of replication – and these stocks may not be demographically or evolutionarily independent. We attempted to address these last two issues by conducting analyses with reduced data sets that included only one rate estimate per species. Statistical power was lacking in these analyses, but qualitative trends did not change, suggesting that any biases may not be too severe.
Another set of caveats relate to our estimates of fishing mortality (F). These estimates came from a variety of different sources, showed considerable temporal variation, and were often available for only part of a given time series. Another limitation was that some data sources reported F estimates averaged across the entire stock, whereas others reported it only for the most heavily exploited age classes. Finally, the majority of F estimates do not include mortality due to by-catch from other fisheries, or discards at sea, which can be substantial (Jennings and Kaiser 1998). We attempted to minimize these uncertainties by also assigning categorical levels of fishing mortality to each stock. In all cases, trends were generally similar between the continuous and categorical analyses, suggesting that uncertainties about the magnitude of F may not be an overwhelming problem.
Finally, we recognize that such a broad-brush analysis of trends necessarily ignores a great deal of biological complexity. We here wish to highlight two major complexities that might be particularly important. First, many stocks were exploited for centuries before any data on life history traits were collected. This past selection, which cannot be assessed, has presumably shaped the starting point for evolution in response to recent fishing. This consideration also implies that postmoratorium rates must be interpreted with caution, as any phenotypic change during these periods may be influenced by the prior periods of intense exploitation. Most notably, many stocks were at very low population densities at the time moratoria were imposed, and this could certainly have plastic effects on life history traits. However, we think that the inclusion of postmoratorium data is justifiable on several grounds. As mentioned above, even premoratorium estimates come after long periods of fishing pressure (hundreds of years in the case of some cod stocks), for which we have little or no quantitative data. Relying on these estimates exclusively would likely still introduce biases. In addition, excluding all postmoratorium estimates would dramatically reduce the range of F values for our analyses, because almost of all our ‘low’ fishing mortality estimates come from postmoratorium contexts. Of course it would be preferable to have long-term maturity data from unexploited or lightly exploited fish populations, but such data are scarce. A second important complication is that fishing alters marine ecosystems in complex and pervasive ways that extend far beyond the direct mortality imposed on the target stock (Jennings and Kaiser 1998). For example, fishing may change the densities of predators, prey, and competitors, which may alter growth rates and age-specific mortality and thus influence maturation schedules (Kuparinen and Merila 2007). Notwithstanding these complexities, it is remarkable that simple models incorporating only recent, rough estimates of fishing intensity could explain 47–93% of the variation in the magnitude of change among stocks (for L50 and PMRNs).
Keeping the above caveats in mind, we now return to the question that motivated this analysis: to what extent are the changes in life histories observed in commercial fish stocks driven by fishing? We found significant correlations between fishing mortality and the rate of phenotypic change for two of the three traits examined, in a direction that was consistent with theoretical expectations for fisheries-induced evolution. These correlations explained a large portion of the variation in rates of change among populations, and were relatively robust to the types of metrics we used (i.e., years versus generations, F categorical or continuous), and the different assumptions underlying our analysis (i.e., stocks versus species as units of replication). Although correlations cannot prove a causal link between fishing and phenotypic change, they support this hypothesis and corroborate other types of evidence that fishing can cause evolutionary changes in natural populations, including mathematical models and simulations (e.g., Ernande et al. 2004), field-based estimates of fisheries-induced selection (Carlson et al. 2007), and laboratory experiments (e.g., Conover et al. 2005; Conover and Baumann 2009). We conclude that the available evidence strongly points to exploitation as a major force driving life history change in commercial fish stocks. This reinforces the value of incorporating evolutionary thinking into fisheries management (e.g., Law and Grey 1989; Dunlop et al. 2009; Enberg et al. 2009; Okamoto et al. 2009).
Acknowledgments
We thank the numerous fisheries scientists who took the time to answer our questions about particular fish stocks and share their data with us, in particular E. Olsen, J. Hutchings, M. Fowler, R. Mohn, G. Engelhard, J. Brattey, J. Morgan, K. Dwyer, D. Kulka, and T. Haug. We also thank the organizers of this special issue, E. Dunlop, K. Enberg, C. Jorgensen, and M. Heino, as well as two anonymous reviewers for helpful comments on this manuscript. This research was supported by grants from the Natural Sciences and Engineering Research Council (NSERC) of Canada to APH (Discovery Grant) and DMTS (Canada Graduate Scholarship).
Appendix A: Rates of change in length at 50% maturity
Note: Only those rate estimates retained for the stock-level analysis are shown. Fishing mortality estimates are the mean of annual fishing mortality rates over the time period indicated. The location of each stock is indicated in parentheses. See footnotes for details of how rates of phenotypic change and fishing mortality were calculated for each stock.
| Stock | Time period | Sex | Time (year) | Time (gen) | Fishing mortality (year−1) | Rate darwins (×103) |
|---|---|---|---|---|---|---|
| American plaice (Hippoglossoides platessoides) | ||||||
| NAFO Div. 3LNO1 (Atlantic) | 1962–94 | F | 32 | 2 | 0.461 | −5.77 |
| NAFO Div. 3Ps2 (Atlantic) | 1961–93 | F | 32 | 2 | 0.257 | −3.21 |
| Atlantic cod (Gadus morhua) | ||||||
| NAFO Div. 4Vs3 (Atlantic) | 1992–02 | F | 10 | 1 | 0.000 | −13.48 |
| NAFO Div. 4W3 (Atlantic) | 1979–93 | F | 12 | 1 | 0.616 | −8.28 |
| ICES Div. 25–28 (Baltic Sea)4 | 1984–97 | F | 13 | – | 0.860 | −24.78 |
| European plaice (Pleuronectes platessa) | ||||||
| North Sea5 | 1955–95 | F + M | 40 | 7 | 0.343 | −0.89 |
| Grayling (Thymallus thymallus) | ||||||
| Lake Lesjaskogsvatn6 (Norway) | 1903–98 | F + M | 95 | 16 | 0.350 | −2.50 |
| Spring-spawning herring (Clupea harengus) | ||||||
| Norwegian Sea7 | 1930–55 | F + M | 25 | 4 | 0.119 | −0.314 |
| Pink salmon (Oncorhynchus gorbuscha)8 | ||||||
| Area 10 (Pacific) | 1952–74 | F + M | 22 | 11 | 1.201 | −22.83 |
| Area 3 (Pacific) | 1952–74 | F + M | 22 | 11 | 0.469 | −23.22 |
| Area 4 (Pacific) | 1952–74 | F + M | 22 | 11 | 0.667 | −17.55 |
| Area 5 (Pacific) | 1952–74 | F + M | 22 | 11 | 0.658 | −17.50 |
| Area 7 (Pacific) | 1952–74 | F + M | 22 | 11 | 1.068 | −19.11 |
| Area 9 (Pacific) | 1952–74 | F + M | 22 | 11 | 1.134 | −22.66 |
| Chum salmon (Oncorhynchus gorbuscha)9 | ||||||
| Area 11 (Pacific) | 1951–75 | F + M | 24 | 6 | 0.529 | 5.62 |
| Area 12 (Pacific) | 1951–75 | F + M | 24 | 6 | 0.529 | −3.73 |
| Area 13 (Pacific) | 1951–75 | F + M | 24 | 6 | 0.529 | −1.92 |
| Silver hake (Merluccius bilinerias) | ||||||
| NAFO Div. 4VWX10 (Atlantic) | 1970–90 | F | 20 | – | 0.579 | −6.97 |
3LNO American plaice: Rates of phenotypic change calculated from Dwyer et al. (2007), Fig. 21. The time series was split in 1994 because a moratorium was imposed in this year. Generation length estimated as 16 years (average for all American plaice stocks; Busby et al. 2007). F estimates are mean values for ages 9–14, estimated from VPA (Dwyer et al. 2007, Fig. 27).
3Ps American plaice: Rates of phenotypic change calculated from Morgan et al. (2002), Fig. 15. The time series was split in 1993 because a moratorium was imposed in this year. Generation length estimated as 16 years (average for all American plaice stocks; Busby et al. 2007). F estimates are mean values from Myers (2007).
4Vs and 4W cod: Rates of phenotypic change calculated from Hutchings (2005), Fig. 2B, for periods pre- and postmoratorium (1993). Generation length estimated as 9 years (COSEWIC 2003). F values pre-1993 estimated from Myers (2007). F values post-1993 estimated from Trzcinski et al. (2006).
Baltic cod: Rates of phenotypic change calculated from Cardinale and Modin (1999), Table 2. Generation length unknown. F values from Cardinale and Modin (1999), Table 1.
North Sea plaice: Rates of phenotypic change calculated from Grift et al. (2003), Fig. 4. Generation length estimated as 5.5 years (Grift et al. 2003). F estimates are mean values for ages 2–10, from Grift et al. (2003), Fig. 1C.
Grayling: Rates of phenotypic change taken directly from Haugen and Vollestad (2001), Table 4. Generation length estimated as 5.81 years (Haugen and Vollestad 2001). F estimates are the maximum estimates from Haugen and Vollestad (2001).
Spring-spawning herring: Rates of phenotypic change calculated from Engelhard and Heino (2004), Fig. 2B. The time series was split in two at 1955, corresponding to exploitation periods defined by the authors (Engelhard and Heino 2004; Fig. 1). Generation length estimated as 6 years (G. Engelhard, pers. comm.). F values are mean estimates for ages 5–13 from Engelhard and Heino (2004), Fig. 1B.
Pink salmon: Rates of phenotypic change calculated from Ricker (1981), Tables 2 and 3 (based on data from commercial seines only). Actual values were for mean weight of fish in commercial seines; however, since all fish caught were age 2, and all pink salmon mature at age 2, we considered this to be analogous to size at maturity. Generation length estimated as 2 years (Ricker 1981). F estimates were from Myers (2007). Annual F estimates were only available for a subset of years (1970–75) in most cases.
Chum salmon: Rates of phenotypic change calculated from Ricker (1981), Table 5 (based on data from commercial seines only). Actual values were for mean weight of fish in commercial seines; however, since all harvested fish are mature for this species (Ricker 1981), we considered this to be analogous to size at maturity. Generation length estimated as 3 years (Ricker 1981). F estimates were from Myers (2007).
Silver hake: Rates of phenotypic change calculated from Showell et al. (2003), Fig. 21. Generation length unknown. F estimates are mean values from Myers (2007).
Appendix B: Rates of change in age at 50% maturity
Note: Only those rate estimates retained for the stock-level analysis are shown. Fishing mortality estimates are the mean of yearly fishing mortality rates over the time period indicated. The location of each stock is indicated in parentheses. See footnotes for details of how rates of phenotypic change and fishing mortality were calculated for each stock.
| Stock | Time period | Sex | Time (year) | Time (gen) | Fishing mortality (year−1) | Rate darwins (×103) |
|---|---|---|---|---|---|---|
| American plaice (Hippoglossoides platessoides) | ||||||
| NAFO Div. 3LNO1 (Atlantic) | 1950–94 | F | 44 | 3 | 0.422 | −7.49 |
| NAFO Div. 3Ps2 (Atlantic) | 1961–93 | F | 32 | 2 | 0.257 | −8.28 |
| Atlantic cod (Gadus morhua) | ||||||
| NAFO Div. 2J3 (Atlantic) | 1992–03 | F | 11 | 1 | 0.246 | −5.96 |
| NAFO Div. 3K3 (Atlantic) | 1992–03 | F | 11 | 1 | 0.246 | −3.95 |
| NAFO Div. 3L3 (Atlantic) | 1982–92 | F | 10 | 1 | 0.818 | −3.82 |
| NAFO Div. 3NO4 (Atlantic) | 1971–94 | F | 23 | 2 | 0.511 | −9.99 |
| NAFO Div. 3Ps5 (Atlantic) | 1954–93 | F | 39 | 4 | 0.603 | −8.78 |
| NAFO Div. 4T6 (Atlantic) | 1959–79 | F | 20 | 2 | 0.533 | −26.20 |
| NAFO Div. 4Vn6 (Atlantic) | 1959–79 | F | 20 | 2 | 0.533 | −41.22 |
| NAFO Div. 4Vs7 (Atlantic) | 1979–92 | F | 11 | 2 | 0.616 | 12.62 |
| NAFO Div. 4W8 (Atlantic) | 1959–79 | F | 20 | 2 | 0.541 | −27.25 |
| NAFO Div. 4X9 (Atlantic) | 1959–79 | F | 20 | 3 | 0.541 | −12.80 |
| NAFO Div. 5Z10 (Atlantic) | 1986–93 | F + M | 7 | 1 | 0.701 | −29.57 |
| ICES Div. 25–28 (Baltic Sea)11 | 1988–97 | F | 7 | 0.832 | −35.32 | |
| NE Arctic12 | 1923–76 | F + M | 53 | 0.416 | −6.42 | |
| European plaice (Pleuronectes platessa) | ||||||
| North Sea13 | 1955–95 | F | 40 | 7 | 0.343 | −8.63 |
| Grayling (Thymallus thymallus) | ||||||
| Lake Lesjaskogsvatn14 (Norway) | 1903–98 | F + M | 95 | 16 | 0.350 | −3.00 |
| Haddock (Melanogrammus aeglefinus) | ||||||
| NAFO Div. 4TVW15 (Atlantic) | 1958–93 | F | 33 | 5 | 0.525 | −6.487 |
| NAFO Div. 4Vn16 (Atlantic) | 1959–79 | F | 20 | 3 | 0.634 | −10.87 |
| NAFO Div. 4Vs16 (Atlantic) | 1959–79 | F | 20 | 3 | 0.634 | −22.65 |
| NAFO Div. 4W16 (Atlantic) | 1959–79 | F | 20 | 3 | 0.634 | −17.35 |
| NAFO Div. 4X17 (Atlantic) | 1959–79 | F | 20 | 3 | 0.432 | −21.15 |
| Spring-spawning herring (Clupea harengus) | ||||||
| Norwegian Sea18 | 1955–78 | F + M | 23 | 4 | 0.723 | −4.65 |
| Striped Bass (Morone saxatilis) | ||||||
| Rhode Island19 (Altantic) | 1941–87 | F | 46 | 0.150 | 3.08 | |
| Walleye (Stizostedion vitreum) | ||||||
| Lake Erie20 (Canada/USA) | 1927–66 | F | 39 | 1.895 | −10.40 | |
3LNO American plaice: Rates of phenotypic change calculated from Dwyer et al. (2007), Fig. 20. The time series was split in 1994 because a moratorium was imposed in this year. Generation length estimated as 16 years (average for all American plaice stocks; Busby et al. 2007). F estimates are mean values for ages 9–14, estimated from VPA (Dwyer et al. 2007, Fig. 27).
3Ps American plaice: Rates of phenotypic change calculated from Morgan et al. (2002), Fig. 14. The time series was split in 1993 because a moratorium was imposed in this year. Generation length estimated as 16 years (average for all American plaice stocks; Busby et al. 2007). F estimates are mean values from Myers (2007).
2J, 3K, 3L cod: Rates of phenotypic change calculated from Olsen et al. (2005), Fig. 4. Time series were split in 1992, because a fishing moratorium was imposed at this time. Generation length estimated as 11 years (COSEWIC 2003). F values premoratorium (1992) estimated from Myers (2007). F values postmoratorium estimated from Lilly et al. (2003), Table 44.
3NO cod: Rates of phenotypic change calculated from Olsen et al. (2005), Fig. 4. The time series was split in 1994, because a fishing moratorium was imposed at this time. Generation length estimated as 11 years (COSEWIC 2003). F estimates are mean values for ages 6–9, estimated from ADAPT (Morgan et al. 2007, Table 24).
3Ps cod: Rates of phenotypic change calculated from Brattey et al. (2004), Fig. 23A. The time series was split in 1993, because a fishing moratorium was imposed at this time. Generation length estimated as 11 years (COSEWIC 2003). F estimates are mean values from Myers (2007).
4T and 4Vn cod: Rates of phenotypic change calculated from Trippel (1995), Table 1. Generation length estimated as 9.5 years (COSEWIC 2003). F estimates are mean values from Myers (2007).
4Vs cod: Rates of phenotypic change calculated from Hutchings (2005), Fig. 2A, for periods pre- and postmoratorium (1993). Generation length estimated as 9 years (COSEWIC 2003). F values pre-1993 estimated from Myers (2007).
4W cod: Rates of phenotypic change calculated from Trippel (1995), Table 1. Generation length estimated as 9 years (COSEWIC 2003). F values estimated from Myers (2007).
4X cod: Rates of phenotypic change calculated from Trippel (1995), Table 1. Generation length estimated as 7.5 years (COSEWIC 2003). F estimates are mean values from Myers (2007).
5Z cod: Rates of phenotypic change calculated from Trippel (1995), Table 1. Generation length estimated as 7.5 years (COSEWIC 2003). F estimates are mean values from Myers (2007).
Baltic cod: Rates of phenotypic change calculated from Cardinale and Modin (1999), Fig. 3C. Generation length unknown. F values from Cardinale and Modin (1999), Table 1.
NE Arctic cod: Rates of phenotypic change calculated from Trippel (1995), Table 1. Generation length unknown. F estimates are mean values from Myers (2007).
North Sea plaice: Rates of phenotypic change calculated from Grift et al. (2003), Fig. 4. Generation length estimated as 5.5 years (Grift et al. 2003). F estimates are mean values for ages 2–10 from Grift et al. (2003), Fig. 1C.
Grayling: Rates of phenotypic change calculated from Haugen and Vollestad (2001), Fig. 4. Generation length estimated as 5.81 years (Haugen and Vollestad 2001). F estimates are maximum estimates from Haugen and Vollestad (2001).
4TVW haddock: Rates of phenotypic change calculated from Mohn and Simon (2002), Fig. 7. The fishery collapsed and was closed in 1993, so the time series was cut in this year. Generation length estimated as 6.56 years, calculated from the formula A50 + 1/M, where A50 is the mean age at maturity between 1965 and 1993 (3.7), and M = 0.35 (Mohn and Simon 2002). F estimates pre-1969 are from Mohn and Simon (2002), Fig. 13. F estimates post-1969 are mean values for ages 5–7, estimated from SPA (Frank et al. 2001, Table 21).
4Vn and 4Vs and 4W haddock: Rates of phenotypic change calculated from Trippel (1995), Table 2. Generation length estimated as 6.56 years, calculated from the formula A50 + 1/M, where A50 is the mean age at maturity between 1965 and 1993 (3.7), and M = 0.35 (Mohn and Simon 2002). F estimates are from Mohn and Simon (2002), Fig. 13.
4X haddock: Rates of phenotypic change calculated from Trippel (1995), Table 2. Generation length estimated as 6.56 (same as neighbouring haddock stocks). F estimates are mean values for ages 5–7, estimated from SPA (Hurley et al. 1999, Table 25).
Spring-spawning herring: Rates of phenotypic change calculated from Engelhard and Heino (2004), Fig. 2A. The time series was split in two at 1955, corresponding to exploitation periods defined by the authors (Engelhard and Heino 2004; Fig. 1). Generation length estimated as 6 years (G. Engelhard, pers. comm.). F values are mean estimates for ages 5–13 from Engelhard and Heino (2004), Fig. 1B.
Striped bass: Rates of phenotypic change calculated from Trippel (1995), Table 3. Generation length unknown. F estimates are mean values from Myers (2007). F estimates were only available for a subset of years in the time series (1982–87).
Walleye: Rates of phenotypic change calculated from Trippel (1995), Table 3. Generation length unknown. F estimates are mean values from Myers (2007). F estimates were only available for a subset of years in the time series (1949–66).
Appendix C: Rates of change in mid-points of probabilistic maturation reaction norms
Note: Only those rate estimates retained for the stock-level analysis are shown. Fishing mortality estimates are the mean of yearly fishing mortality rates over the time period indicated. The location of each stock is indicated in parentheses. See footnotes for details of how rates of phenotypic change and fishing mortality were calculated for each stock.
| Stock | Time period | Sex | Age | Time (year) | Time (gen) | Fishing mortality (year−1) | Rate darwins (×103) |
|---|---|---|---|---|---|---|---|
| American plaice (Hippoglossoides platessoides) | |||||||
| NAFO Div. 3LNO1 (Atlantic) | 1970–93 | F | 7 | 23 | 1 | 0.572 | −10.02 |
| NAFO Div. 3Ps2 (Atlantic) | 1973–92 | F | 7 | 19 | 1 | 0.257 | −8.02 |
| Atlantic cod (Gadus morhua) | |||||||
| NAFO Div. 2J3 (Atlantic) | 1992–02 | F | 5 | 10 | 1 | 0.246 | 0.13 |
| NAFO Div. 3K3 (Atlantic) | 1992–02 | F | 5 | 10 | 1 | 0.246 | −5.18 |
| NAFO Div. 3L3 (Atlantic) | 1983–92 | F | 5 | 9 | 1 | 1.000 | −15.71 |
| NAFO Div. 3NO4 (Atlantic) | 1994–01 | F | 5 | 7 | 1 | 0.099 | 7.26 |
| NAFO Div. 3Ps5 (Atlantic) | 1976–93 | F | 5 | 17 | 1 | 0.633 | −20.70 |
| NAFO Div. 5Y6 (Atlantic) | 1970–94 | F | 3 | 24 | 2 | 1.106 | −27.48 |
| NAFO Div. 5Zjm7 (Atlantic) | 1970–94 | F | 3 | 24 | 4 | 0.653 | −18.85 |
| European plaice (Pleuronectes platessa) | |||||||
| North Sea8 | 1955–95 | F | 4 | 40 | 7 | 0.343 | −2.60 |
| Spring-spawning herring (Clupea harengus) | |||||||
| Norwegian Sea9 | 1930–55 | F + M | 5 | 25 | 4 | 0.119 | 0.34 |
3LNO American plaice: Rates of phenotypic change calculated from Barot et al. (2005), Fig. 4. The time series was split in 1993, the year a moratorium was imposed for this stock. PMRN midpoints were calculated for ages 4–9; however, we only included one (age 7) in the final analysis to avoid pseudoreplication. The choice of age should not influence our results because temporal trends were similar, and statistically significant for all ages (Barot et al. 2005). Generation length estimated as 16 years (average for all American plaice stocks; Busby et al. 2007). F estimates are mean values for ages 9–14, estimated from VPA (Dwyer et al. 2007, Fig. 27).
3Ps American plaice: Rates of phenotypic change calculated from Barot et al. (2005), Fig. 4. The time series was split in 1994, because fishing mortality dropped dramatically after this year. As above, PMRN midpoints were calculated for ages 4–9; however, we only included one (age 7) in the final analysis to avoid pseudoreplication. The choice of age should not influence our results because temporal trends were similar, and statistically significant for all ages (Barot et al. 2005). Generation length estimated as 16 years (average for all American plaice stocks; Busby et al. 2007). F estimates are mean values from Myers (2007).
2J, 3K, 3L cod: Rates of phenotypic change calculated from Olsen et al. (2005), Figs 6 and 7. Time series were split in 1992, because a fishing moratorium was imposed at this time. PMRN midpoints were calculated for ages 5 and 6; however we only included one in the final analysis (age 5 because it was the most complete) to avoid pseudoreplication. Generation length estimated as 11 years (COSEWIC 2003). F values premoratorium (1992) estimated from Myers (2007). F values postmoratorium estimated from Lilly et al. (2003), Table 44.
3NO cod: Rates of phenotypic change calculated from Olsen et al. (2005), Figs 6 and 7. Time series were split in 1994, because a fishing moratorium was imposed at this time. As above, PMRN midpoints were calculated for ages 5 and 6; however we only included one in the final analysis (age 5 because it was the most complete) to avoid pseudoreplication. Generation length estimated as 11 years (COSEWIC 2003). F estimates are mean values for ages 6–9, estimated from ADAPT (Morgan et al. 2007, Table 24).
3Ps cod: Rates of phenotypic change calculated from Olsen et al. (2005), Figs 6 and 7. Time series were split in 1993, because a fishing moratorium was imposed at this time. As above, PMRN midpoints were calculated for ages 5 and 6; however we only included one in the final analysis (age 5 because it was the most complete) to avoid pseudoreplication. Generation length estimated as 11 years (COSEWIC 2003). F estimates are mean values for ages 5–10, estimated from QLSPA, run B (Brattey et al. 2004, Fig. 33F).
5Y cod: Rates of phenotypic change calculated from Barot et al. (2004), Fig. 5. The time series was split in1994, because fishing mortality decreased dramatically after this year. PMRN midpoints were calculated for ages 1–5; however we only included one in the final analysis (age 3 because it was the longest) to avoid pseudoreplication. The choice of age should not influence our results because temporal trends were similar for all ages (Barot et al. 2004). Generation length estimated as 10.8 years (NEFSC 2002). F estimates are mean values for ages 4–5, estimated from Mayo and O'Brien (2006), Fig. 1.6.
5Z cod: Rates of phenotypic change calculated from Barot et al. (2004), Fig. 5. The time series was split in1994, because fishing mortality decreased dramatically after this year. PMRN midpoints were calculated for ages 1–5; however we only included one in the final analysis (age 3 because it was the longest) to avoid pseudoreplication. The choice of age should not influence our results because temporal trends were similar for all ages (Barot et al. 2004). Generation length estimated as 7.5 years (COSEWIC 2003). F estimates are mean values from Myers (2007).
North Sea plaice: Rates of phenotypic change calculated from Grift et al. (2003), Fig. 7. PMRN midpoints were calculated for ages 2–6; however we only included one in the final analysis (age 4 because it had the smallest confidence intervals) to avoid pseudoreplication. The choice of age should not influence our results because temporal trends were similar for all ages (Grift et al. 2003). Generation length estimated as 5.5 years (Grift et al. 2003). F estimates are mean values for ages 2–10 from Grift et al. (2003), Fig. 1C.
Spring-spawning herring: Rates of phenotypic change calculated from Engelhard and Heino (2004), Fig. 4. The time series was split in two at 1955, corresponding to exploitation periods defined by the authors (Engelhard and Heino 2004; Fig. 1). PMRN midpoints were calculated for ages 3–8; however, we only included one in the final analysis (age 5 because it was one of the most complete and in the middle of the range of possible ages) to avoid pseudoreplication. Generation length estimated as 6 years (G. Engelhard, pers. comm.). F values are mean estimates for ages 5–13 from Engelhard and Heino (2004), Fig. 1B.
Literature cited
- Abrams PA, Rowe L. The effects of predation on the age and size of maturity of prey. Evolution. 1996;50:1052–1061. doi: 10.1111/j.1558-5646.1996.tb02346.x. [DOI] [PubMed] [Google Scholar]
- Andersen KH, Farnsworth KD, Thygesen UH, Beyer JE. The evolutionary pressure from fishing on size at maturation of Baltic cod. Ecological Modelling. 2007;204:246–252. [Google Scholar]
- Barot S, Heino M, O'Brien L, Dieckmann U. Long-term trend in the maturation reaction norm of two cod stocks. Ecological Applications. 2004;14:1257–1271. [Google Scholar]
- Barot S, Heino M, Morgan MJ, Dieckmann U. Maturation of Newfoundland American plaice (Hippoglossoides platessoides): long-term trends in maturation reaction norms despite low fishing mortality? Ices Journal of Marine Science. 2005;62:56–64. [Google Scholar]
- Borisov VM. The selective effect of fishing on the population structure of species with a long life cycle. Journal of Ichthyology. 1978;18:896–904. [Google Scholar]
- Brattey J, Cadigan NG, Healey BP, Lilly GR, Murphy EF, Shelton PA, Mahe JC. 2004. Assessment of the cod stock in NAFO Subdivision 3Ps in October 2004. DFO Can. Sci. Advis. Sec. Res. Doc. 2004/083.
- Busby CD, Morgan MJ, Dwyer KS, Fowler GM, Morin R, Treble M, Parsons DM, et al. 2007. Review of the structure, the abundance and distribution of American plaice (Hippoglossoides platessoides) in Atlantic Canada in a species-at-risk context. DFO Can. Sci. Advis. Sec. Res. Doc. 2007/069.
- Cardinale M, Modin J. Changes in size-at-maturity of Baltic cod (Gadus morhua) during a period of large variations in stock size and environmental conditions. Fisheries Research. 1999;41:285–295. [Google Scholar]
- Carlson SM, Edeline E, Vollestad LA, Haugen TO, Winfield IJ, Fletcher JM, et al. Four decades of opposing natural and human-induced artificial selection acting on Windermere pike (Esox lucius. Ecology Letters. 2007;10:512–521. doi: 10.1111/j.1461-0248.2007.01046.x. [DOI] [PubMed] [Google Scholar]
- Conover DO, Baumann H. The role of experiments in understanding fishery-induced evolution. Evolutionary Applications. 2009;2:276–290. doi: 10.1111/j.1752-4571.2009.00079.x. [DOI] [PMC free article] [PubMed] [Google Scholar]
- Conover DO, Munch SB. Sustaining fisheries yields over evolutionary time scales. Science. 2002;297:94–96. doi: 10.1126/science.1074085. [DOI] [PubMed] [Google Scholar]
- Conover DO, Arnott SA, Walsh MR, Munch SB. Darwinian fishery science: lessons from the Atlantic silverside (Menidia menidia. Canadian Journal of Fisheries and Aquatic Sciences. 2005;62:730–737. [Google Scholar]
- COSEWIC. Ottawa: Committe on the Status of Endangered Wildlife in Canada; 2003. Assessment and Status Update Status Report on the Atlantic cod Gadus Morhua. [Google Scholar]
- Cox SP, Hinch SG. Changes in size at maturity of Fraser River sockeye salmon (Oncorhynchus nerka) (1952–1993) and associations with temperature. Canadian Journal of Fisheries and Aquatic Sciences. 1997;54:1159–1165. [Google Scholar]
- Darimont CT, Carlson SM, Kinnison MT, Paquet PC, Reimchen TE, Wilmers CC. Human predators outpace other agents of trait change in the wild. Proceedings of the National Academcy of Sciences USA. 2009;106:952–954. doi: 10.1073/pnas.0809235106. [DOI] [PMC free article] [PubMed] [Google Scholar]
- Dieckmann U, Heino M. Probabilistic reaction norms: their history, strengths, and limitations. Marine Ecology-Progress Series. 2007;225:253–269. [Google Scholar]
- Dunlop ES, Baskett ML, Heino M, Dieckmann U. Propensity of marine reserves to reduce the evolutionary effects of fishing in a migratory species. Evolutionary Applications. 2009;2:371–393. doi: 10.1111/j.1752-4571.2009.00089.x. [DOI] [PMC free article] [PubMed] [Google Scholar]
- Dwyer KS, Morgan MJ, Parsons DM, Brodie WB, Healey BP. 2007. An assessment of American plaice in NAFO Div. 3LNO. NAFO SCR Doc. 07/56.
- Enberg K, Jorgensen C, Dunlop ES, Heino M, Dieckmann U. Implications of fisheries-induced evolution for stock rebuilding and recovery. Evolutionary Applications. 2009;2:394–414. doi: 10.1111/j.1752-4571.2009.00077.x. [DOI] [PMC free article] [PubMed] [Google Scholar]
- Engelhard GH, Heino M. Maturity changes in Norwegian spring-spawning herring Clupea harengus: compensatory or evolutionary responses? Marine Ecology-Progress Series. 2004;272:245–256. [Google Scholar]
- Ernande B, Dieckmann U, Heino M. Adaptive changes in harvested populations: plasticity and evolution of age and size at maturation. Proceedings of the Royal Society of London Series B-Biological Sciences. 2004;271:415–423. doi: 10.1098/rspb.2003.2519. [DOI] [PMC free article] [PubMed] [Google Scholar]
- Fenberg PB, Roy K. Ecological and evolutionary consequences of size-selective harvesting: how much do we know? Molecular Ecology. 2008;17:209–220. doi: 10.1111/j.1365-294X.2007.03522.x. [DOI] [PubMed] [Google Scholar]
- Frank KT, Mohn RK, Simon JE. 2001. Assessment of the status of Div. 4TVW Haddock: 2000. DFO Can. Sci. Advis. Sec. Res. Doc. 2001/100.
- Gingerich PD. Quantification and comparison of evolutionary rates. American Journal of Science. 1993;293A:453–478. [Google Scholar]
- Gingerich PD. Rates of evolution on the time scale of the evolutionary process. Genetica. 2001;112–113:127–144. [PubMed] [Google Scholar]
- Gjedrem T. Genetic variation in quantitative traits and selective breeding in fish and shellfish. Aquaculture. 1983;33:51–72. [Google Scholar]
- Grant PR, Grant RB. Unpredictable evolution in a 30-year study of Darwin's finches. Science. 2002;296:707–711. doi: 10.1126/science.1070315. [DOI] [PubMed] [Google Scholar]
- Grift RE, Rijnsdorp AD, Barot S, Heino M, Dieckmann U. Fisheries-induced trends in reaction norms for maturation in North Sea plaice. Marine Ecology-Progress Series. 2003;257:247–257. [Google Scholar]
- Haldane JBS. Suggestions as to quantitative measurement of rates of evolution. Evolution. 1948;3:51–56. doi: 10.1111/j.1558-5646.1949.tb00004.x. [DOI] [PubMed] [Google Scholar]
- Haugen TO, Vollestad LA. A century of life-history evolution in grayling. Genetica. 2001;112:475–491. [PubMed] [Google Scholar]
- Heino M. Management of evolving fish stocks. Canadian Journal of Fisheries and Aquatic Sciences. 1998;55:1971–1982. [Google Scholar]
- Heino M, Dieckmann U. Detecting fisheries-induced life history evolution: an overview of the reaction norm approach. Bulletin of Marine Science. 2008;83:69–93. [Google Scholar]
- Heino M, Godo OR. Fisheries-induced selection pressures in the context of sustainable fisheries. Bulletin of Marine Science. 2002;70:639–656. [Google Scholar]
- Heino M, Dieckmann U, Godo OR. Estimating reaction norms for age and size at maturation with reconstructed immature size distributions: a new technique illustrated by application to Northeast Arctic cod. ICES Journal of Marine Science. 2002;59:562–575. [Google Scholar]
- Hendry AP, Kinnison MT. Perspective: the pace of modern life: measuring rates of contemporary microevolution. Evolution. 1999;53:1637–1653. doi: 10.1111/j.1558-5646.1999.tb04550.x. [DOI] [PubMed] [Google Scholar]
- Hendry AP, Farrugia TJ, Kinnison MT. Human influences on rates of phenotypic change in wild animal populations. Molecular Ecology. 2008;17:20–29. doi: 10.1111/j.1365-294X.2007.03428.x. [DOI] [PubMed] [Google Scholar]
- Hurley PCF, Black GAP, Comeau PA, Mohn RK. 1999. Assessment of 4X haddock in 1998 and the first half of 1999. DFO Can. Sci. Advis. Sec. Res. Doc. 1999/147.
- Hutchings JA. Life history consequences of overexploitation to population recovery in Northwest Atlantic cod (Gadus morhua. Canadian Journal of Fisheries and Aquatic Sciences. 2005;62:824–832. [Google Scholar]
- Hutchings JA, Baum JK. Measuring marine fish biodiversity: temporal changes in abundance, life history and demography. Philosophical Transactions of the Royal Society B-Biological Sciences. 2005;360:315–338. doi: 10.1098/rstb.2004.1586. [DOI] [PMC free article] [PubMed] [Google Scholar]
- Jennings S, Kaiser MJ. The effects of fishing on marine ecosystems. Advances in Marine Biology. 1998;34:201–352. [Google Scholar]
- Jennings S, Greenstreet SPR, Reynolds JD. Structural changes in an exploited fish community: a consequence of differential fishing effects on species with contrasting life histories. Journal of Animal Ecology. 1999;68:617–627. [Google Scholar]
- Jorgensen C, Enberg K, Dunlop ES, Arlinghaus R, Boukal DS, Brander K, Ernande B, et al. Managing evolving fish stocks. Science. 2007;318:1247–1248. doi: 10.1126/science.1148089. [DOI] [PubMed] [Google Scholar]
- Jorgensen C, Ernande B, Fiksen O. Size-selective fishing gear and life history evolution in the Northeast Arctic cod. Evolutionary Applications. 2009;2:394–414. doi: 10.1111/j.1752-4571.2009.00075.x. [DOI] [PMC free article] [PubMed] [Google Scholar]
- Kinnison MT, Hendry AP. The pace of modern life II: from rates of contemporary microevolution to pattern and process. Genetica. 2001;112–113:145–164. [PubMed] [Google Scholar]
- Kraak SBM. Does the probabilistic maturation reaction norm approach disentangle phenotypic plasticity from genetic change? Marine Ecology-Progress Series. 2007;335:295–299. [Google Scholar]
- Kuparinen A, Merila J. Detecting and managing fisheries-induced evolution. Trends in Ecology and Evolution. 2007;22:652–659. doi: 10.1016/j.tree.2007.08.011. [DOI] [PubMed] [Google Scholar]
- Law R. Fishing, selection, and phenotypic evolution. ICES Journal of Marine Science. 2000;57:659–668. [Google Scholar]
- Law R, Grey DR. Evolution of yields from populations with age-specific cropping. Evolutionary Ecology. 1989;3:343–359. [Google Scholar]
- Lilly GR, Shelton PA, Brattey J, Cadigan NG, Healey BP, Murphy EF, Stansbury DE, et al. 2003. An assessment of the cod stock in NAFO Divisions 2J+3KL in February 2003. DFO Can. Sci. Advis. Sec. Res. Doc. 2003/023.
- Mayo R, O'Brien L. 2006. Atlantic cod. Status of Fishery Resources off the Northeastern USURL http://www.nefsc.noaa.gov/sos/spsyn/pg/cod.html.
- Miller RB. Have the genetic patterns of fishes been altered by introductions or by selective fishing? Journal of the Fisheries Research Board of Canada. 1957;14:797–806. [Google Scholar]
- Mohn RK, Simon JE. 2002. Biological information relevant to the management of 4TVW haddock. DFO Can. Sci. Advis. Sec. Res. Doc. 2002/102.
- Morgan MJ, Brodie WB, Power D, Walsh SJ. 2002. An Assessment of American plaice in NAFO Subdivision 3Ps. DFO Can. Sci. Advis. Sec. Res. Doc. 2002/093.
- Morgan MJ, Murphy EF, Brattey J. 2007. An assessment of the cod stock in NAFO divisions 3NO. NAFO SCR Doc. 2007/40.
- Myers RA. 2007. Stock recruitment database http://ram.biology.dal.ca/~myers/welcome.html.
- NEFSC. 2002. Final report of the working group on re-evaluation of biological reference points for New England groundfish. Northeast Fish. Sci. Cent. Ref. Doc. 02-04.
- Nelson K, Soulé M. Genetical conservation of exploited fishes. In: Ryman M, Utter F, editors. Population Genetics and Fisheries Management. Seattle: Washington Sea Grant Program; 1987. pp. 345–368. [Google Scholar]
- Okamoto K, Whitlock R, Magnan P, Dieckmann U. Mitigating fisheries-induced evolution in lacustrine brook charr (Salvelinus fontinalis) in southern Quebec, Canada. Evolutionary Applications. 2009;2:415–437. doi: 10.1111/j.1752-4571.2009.00095.x. [DOI] [PMC free article] [PubMed] [Google Scholar]
- Olsen EM, Heino M, Lilly GR, Morgan MJ, Brattey J, Ernande B, Dieckmann U. Maturation trends indicative of rapid evolution preceded the collapse of northern cod. Nature. 2004;428:932–935. doi: 10.1038/nature02430. [DOI] [PubMed] [Google Scholar]
- Olsen E, Lilly GR, Heino M, Morgan MJ, Brattey J, Dieckmann U. Assessing changes in age and size at maturation in collapsing populations of Atlantic cod (Gadus morhua. Canadian Journal of Fisheries and Aquatic Sciences. 2005;62:811–823. [Google Scholar]
- Policansky D. Fishing as a cause of evolution in fishes. In: Stokes TK, McGlade JM, Law R, editors. The Exploitation of Evolving Resources. Berlin: Springer-Verlag; 1993. pp. 8–18. [Google Scholar]
- R Development Core Team. R: A Language and Environmental for Statistical Computing. Vienna, Austria: R Foundation for Statistical Computing; 2007. [Google Scholar]
- Ratner S, Lande R. Demographic and evolutionary responses to selective harvesting in populations with discrete generations. Ecology. 2001;82:3093–3104. [Google Scholar]
- Reznick DN, Ghalambor CK. Can commercial fishing cause evolution? Answers from guppies (Poecilia reticulata. Canadian Journal of Fisheries and Aquatic Sciences. 2005;62:791–801. [Google Scholar]
- Reznick DA, Bryga H, Endler JA. Experimentally-induced life history evolution in a natural population. Nature. 1990;346:357–359. [Google Scholar]
- Ricker WE. Changes in the average size and average age of Pacific salmon. Canadian Journal of Fisheries and Aquatic Sciences. 1981;38:1636–1656. [Google Scholar]
- Rijnsdorp AD. Fisheries as a large-scale experiment on life-history evolution: disentangling phenotypic and genetic effects in changes in maturation and reproduction of North Sea plaice, Pleuronectes platessa L. Oecologia. 1993;96:391–401. doi: 10.1007/BF00317510. [DOI] [PubMed] [Google Scholar]
- Rochet MJ. Short-term effects of fishing on life history traits of fishes. ICES Journal of Marine Science. 1998;55:371–391. [Google Scholar]
- De Roos AM, Boukal DS, Persson L. Evolutionary regime shifts in age and size at maturation of exploited fish stocks. Proceedings of the Royal Society B-Biological Sciences. 2006;273:1873–1880. doi: 10.1098/rspb.2006.3518. [DOI] [PMC free article] [PubMed] [Google Scholar]
- Showell MA, Beanlands D, Mohn RK, Fowler GM. 2003. Assessment of the Scotian shelf silver hake population to 2003. DFO Can. Sci. Advis. Sec. Res. Doc. 2003/117.
- Smith PJ. Genetic Diversity of Marine Fisheries Resources: Possible Impacts of Fishing. 1994. FAO Fisheries Technical Paper, FAO, 53 pages.
- Stearns SC. The genetic basis of differences in life history traits among 6 populations of mosquitofish (Gambusia affinis) that shared ancestors in 1905. Evolution. 1983;37:618–627. doi: 10.1111/j.1558-5646.1983.tb05578.x. [DOI] [PubMed] [Google Scholar]
- Stearns SC. The Evolution of Life Histories. Oxford: Oxford University Press; 1992. [Google Scholar]
- Stokes K, Law R. Fishing as an evolutionary force. Marine Ecology-Progress Series. 2000;208:307–309. [Google Scholar]
- Stokes TK, McGlade JM, Law R, editors. The Exploitation of Evolving Resources. Berlin: Springer-Verlag; 1993. [Google Scholar]
- Trippel EA. Age at maturity as a stress indicator in fisheries. BioScience. 1995;45:759–771. [Google Scholar]
- Trzcinski MK, Mohn RK, Bowen WD. Continued decline of an Altantic cod population: how important is grey seal predation? Ecological Applications. 2006;16:2276–2292. doi: 10.1890/1051-0761(2006)016[2276:cdoaac]2.0.co;2. [DOI] [PubMed] [Google Scholar]
- Walsh MR, Munch SB, Chiba S, Conover DO. Maladaptive changes in multiple traits caused by fishing: impediments to population recovery. Ecology Letters. 2006;9:142–148. doi: 10.1111/j.1461-0248.2005.00858.x. [DOI] [PubMed] [Google Scholar]