

Abstract
Chronic wasting disease is a transmissible spongiform encephalopathy of cervids, similar to sheep scrapie that has only recently been detected in wild populations of white-tailed deer (Odocoileus virginianus) and mule deer (Odocoileus hemionus hemionus) in western Canada. Relatively little is known about local transmission dynamics of the disease or the potential for long-distance spread. We analysed the population genetic structure of over 2000 white-tailed deer sampled from Alberta, British Columbia, and Saskatchewan using microsatellite profiles and mtDNA sequencing to assess the relative risk of disease spread. There was very little differentiation among subpopulations and a weak trend of increasing differentiation with geographic distance. This suggests that the potential for long-distance disease spread through the dispersal of infected individuals is possible, yet the risk of spread should gradually diminish with distance from infection foci. Within subpopulations, females were more related than expected by chance (R > 0) within a radius of approximately 500 m. Sex-biased philopatry and social interactions among related females may facilitate local disease transmission within social groups. Local herd reduction may therefore be an effective tool for reducing the disease prevalence when implemented at the appropriate spatial scale.
Keywords: chronic wasting disease, Odocoileus virginianus, population genetics, prion, spatial genetic structure, white-tailed deer, wildlife management
Introduction
Chronic wasting disease (CWD) is a transmissible spongiform encephalopathy (TSE) that infects members of the Cervidae including elk (Cervus elaphus, Linnaeus, 1758), moose (Alces alces, Linnaeus, 1758), mule deer (Odocoileus hemionus hemionus, Rafinesque, 1817) and white-tailed deer (Odocoileus virginianus, Zimmermann, 1780) (Williams and Young 1980, 1982; Baeten et al. 2007). Infection occurs by transmission of a proteinaceous infectious particle (prion) (Prusiner 1998). TSE's are always fatal and incubation is typically greater than one year before clinical signs develop, where the onset and duration of clinical signs vary (Williams and Young 1982; Williams et al. 2002). CWD is the only TSE to infect wild populations, and aside from scrapie is the only one that is infectious (Miller et al. 2000).
Chronic wasting disease has been detected in wild cervid populations in both the USA and Canada and continues to spread. Due to the potential long-term effects on economically important cervid populations (Williams et al. 2002; Biship 2004; Joly et al. 2006), preventing further spread and eradication of the disease would be ideal (Conner et al. 2008). It is actively being managed in most areas but it is difficult to control due to the extended incubation period, the difficulty in detecting infectious individuals and the lack of vaccination or treatment (Williams et al. 2002; Joly et al. 2006; Sigurdson and Aguzzi 2007). Active management options are limited to enhanced surveillance, as well as selective and/or nonselective culling (Williams et al. 2002). There is still much to learn about the long-term effects of CWD on wildlife and the affected ecosystems, but models indicate that CWD could lead to high mortality in mule deer populations where local extinctions may be necessary to eliminate the disease (Gross and Miller 2001).
The pattern of CWD spread is spatially heterogeneous and not a monotonic wave-front (Conner and Miller 2004; Miller and Conner 2005; Farnsworth et al. 2006), suggesting that numerous factors influence spread (Hastings et al. 2005). CWD transmission can occur directly, through the contact of infectious and susceptible individuals, or indirectly, through contact with infectious prions in the environment. Direct transmission is thought to be predominantly horizontal between interacting individuals, rather than vertical across the placental barrier (Miller and Williams 2003; Miller et al. 2006). Direct transmission is likely the predominate mechanism in a newly endemic region (Williams et al. 2002). Consequently, understanding the factors that influence horizontal transmission could lead to improved disease-control strategies.
Population genetics provides a potentially useful set of tools to study factors affecting disease spread if patterns of gene flow can be used as a proxy for the movement of infectious individuals. For instance, at the broad scale, a landscape genetic approach can identify genetic discontinuities among subpopulations that can be related to spatial and ecological factors that regulate gene flow (Manel et al. 2003; Holderegger and Wagner 2006; Storfer et al. 2007) resulting in the low risk of spread of disease. These low-risk regions can be targeted for disease control because intervention will be most effective here (Russell et al. 2005; Rees et al. 2008, 2009). Both Blanchong et al. (2008) and Cullingham et al. (2009) found rivers limited movement for the host (white-tailed deer and raccoons, respectively) population. These river barriers corresponded to reduced disease incidence, therefore defining regions where it would be possible to halt the spread of disease. At the local scale, transmission can be influenced by both social organization and the density of susceptible individuals (Altizer et al. 2003). Individual-based genetic analyses can be used to understand the social organization of individuals. As an example, white-tailed deer social structure tends to follow a matriarchic society (Hawkins and Klimstra 1970; Bowyer 1984; Mathews and Porter 1993; Aycrigg and Porter 1997; Skuldt et al. 2008), and maternal lineage has been shown to influence tuberculosis infection (Blanchong et al. 2006, 2007). Fine-scale genetics can indicate whether related individuals are spatially proximate, and at what distance this relationship decays (Hardy and Vekemans 1999).
Our aim was to assess broad (>1000 km) and local population genetic structure (<200 km) of male and female white-tailed deer across Alberta, Saskatchewan, and portions of British Columbia using bi-parentally inherited microsatellites and maternally inherited mitochondrial (mt) DNA to understand factors potentially influencing the broad-scale spatial spread and local transmission of CWD. At the broad-scale, we tested for isolation by distance (IBD) among sampling areas, where we expected higher levels of differentiation among females than males because males are the predominant dispersers (Hawkins and Klimstra 1970; Long et al. 2005; Nixon et al. 2007; Skuldt et al. 2008), and dispersal distances range from 7 km to over 50 km (Hawkins and Klimstra 1970; Rosenberry et al. 1999; Long et al. 2005; Skuldt et al. 2008). Additionally, deer dispersal can be influenced by habitat types and fragmentation (Long et al. 2005; Nixon et al. 2007; Skuldt et al. 2008), therefore we analyzed the genetic structure of white-tailed deer using a clustering algorithm (structure, Pritchard et al. 2000) to determine whether there was cryptic genetic structure across the landscape. At the local scale, we used an individual-based approach to elucidate factors influencing transmission among individuals. We used spatial-genetic autocorrelation to characterize patterns of relatedness among individuals within subpopulations where CWD is endemic, and related these patterns to the potential for disease transmission. Due to female philopatry, we expected to find significant relatedness among females at short distances, and no evidence of relatedness among males.
Methods
Study area and sample collection
The area sampled extends from eastern British Columbia to eastern Saskatchewan (longitude: −120 to −101, latitude: 49 to 59; Fig. 1) spanning rugged mountain terrain, parkland, boreal forest, and open prairie grasslands. A total of 2088 white-tailed deer (female = 1146, male = 837, unknown = 105) were selected for the analysis from samples collected by Alberta Fish and Wildlife, Saskatchewan Environment, British Columbia Ministry of the Environment, Canadian Cooperative Wildlife Health Centre, Parks Canada, and University of Saskatchewan. Tissue samples typically consisted of muscle biopsies or ear punches and were stored dry or in 95% ethanol at −20°C. Alberta samples (n = 1442) were collected from road-kill (∼3%), government implemented hunter submissions (∼41%), a CWD-targeted control program conducted from 2005 to 2008 (∼56%), and Parks Canada (<1%). Most of the sampling by Alberta Fish and Wildlife occurred in the fall and winter when deer are more likely to associate in social groups (Geist 1998; Lingle 2003). Samples from Saskatchewan (n = 586) consisted of retropharyngeal lymph nodes from hunter surveillance (28%) and control program submissions (70%) and skin biopsies from anesthetized deer taken during research activities (2%) (2003–2007). Samples from British Columbia (n = 60) were collected from road kills and fall hunter submissions (∼1%) as part of their CWD surveillance program. All samples were referenced by sex, age category (fawn, juvenile, adult), and geographic location (either GPS (n = 1444) or by wildlife management unit/zone (n = 644)). Age was determined by tooth eruption and wear for both Alberta hunter killed and Saskatchewan deer; AB winter program deer used both tooth information and body morphometrics. Centroids of wildlife management unit/zones were used for point locations where necessary. A total of 47 white-tailed deer (23 males and 24 females, of which 5 and 2 were juveniles, respectively) tested positive for CWD (Fig. 1).
Figure 1.
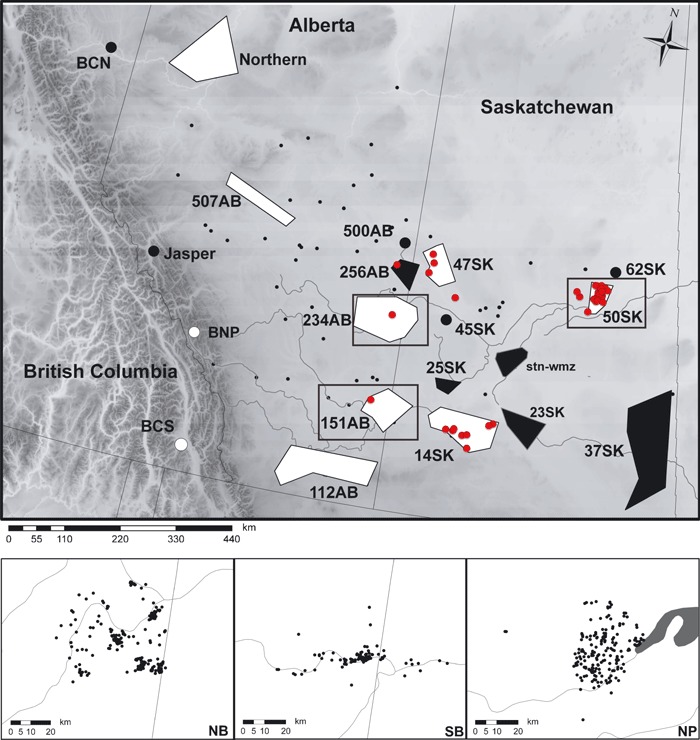
Distribution of 2088 white-tailed deer sample locations used for microsatellite analysis across the Canadian provinces of British Columbia, Alberta, and Saskatchewan. The shaded relief indicates the elevation and the location of the Rocky Mountains along the Alberta/British Columbia border. Subpopulation designations used in the mtDNA and microsatellite FST analyses are indicated as polygons. All subpopulations were used for the microsatellite analysis, while subpopulations used for the mtDNA analysis are marked in white. Locations of chronic wasting disease positive cases in free-ranging white-tailed deer are indicated in red. The small insets below are the samples used in the fine-scale analyses. North border (NB) corresponds to the region demarcated at subpopulation 234AB, south border (SB) is 151AB, and Nipawin (NP) is 50SK.
Samples were grouped into subpopulations a priori for some of the broad-scale analyses. Subpopulations were based on management units and spatial clustering of points based on visual inspection. The geographic extent of each group was estimated using minimum convex polygons as implemented by Hawth's tools version 3.27 (Beyer 2004) in ArcMap9.2 (ESRI, Redlands, CA, USA) (Fig. 1).
DNA extraction and genetic profiling
DNA was extracted using Qiagen 96 DNeasy® Blood and Tissue kit following the manufacturer's protocol (Mississauga, ON, Canada). DNA was quantified using a NanoDrop 1000™ (Thermo Fisher Scientific, Ottawa, ON, Canada) and diluted to 1 ng/μL for mt control region sequencing and 10 ng/μL for microsatellite analysis.
A representative subset (n = 557) including CWD-positive samples were selected for mtDNA control region sequencing. We aimed for a minimum of 10 individuals from subpopulations to provide broad coverage (Fig. 1). The control region was amplified using primers developed from published sequences (Miyamoto et al. 1990: accession ODOMTFVLA), forward primer – F1 (5′-TCT CCC TAA GAC TCA AGG AAG), and reverse primer – R1 (5′-GTC ATT AGT CCA TCG AGA TGT C). Reaction conditions were as follows: 2 ng template, 100 μm dNTPs, 15 nmol each primer, 1 U Invitrogen Taq (Burlington, ON, Canada) in a 1× PCR buffer [200 mm Tris–HCl (pH 8.4), 500 mm KCl] in a total volume of 20 μL. Polymerase chain reaction (PCR) cycles followed 94°C for 5 min, 30 cycles of 94°C for 30 s, 54°C for 30 s, and 72°C for 30 s, with a final extension of 2 min at 72°C; all amplifications were performed on Mastercycler ep gradient thermocyclers (Eppendorf; Mississauga, ON, Canada). Once amplification of the 699-bp fragment was confirmed by visualizing 5 μL of product on a 1.5% agarose gel, 5 μL was purified using 0.02 μL of EXO, 0.2 μL SAP (both USB, Cleveland, OH, USA), and 3.78 μL of UltraPur water (Gibco, Burlington, ON, Canada). Sequences were generated using the forward primer and the BigDye® Terminator v3.1 Cycle Sequencing Kit (Applied Biosystems, Foster City, CA, USA). Sequence data were generated on an ABI Prism 3730 DNA Analyzer (Applied Biosystems).
Unique genetic profiles were generated for all individuals using 14 microsatellite loci in three multiplex PCRs (L1a, L1b, and L2). PCR chemistry for all reactions included 25 ng DNA, 5 μL 2× Qiagen Multiplex mix (Mississauga, ON, Canada), 0.5 μL Ultrapur water (Gibco), and 2 μL primer mix. Details on loci including primer concentration, sequence, fluorescent label, multiplex panel, and source are included in Appendix. Amplification cycles for all multiplex reactions were: 95°C for 15 min, 33 cycles of 95°C for 30 s 60°C for 1 min 30 s, and 72°C for 1 min with a final extension of 30 min at 72°C; all reactions were carried out on Mastercycler ep gradient thermocyclers (Eppendorf). For fragment analysis, PCR products were diluted to 1:40 and analyzed on an ABI 3730 DNA Analyzer using GeneScan™ 500LIZ™ as a size standard (Applied Biosystems). Muliplex L1a and L1b were pooled for analysis on the ABI. Genotypes were scored manually using GeneMapper v4.0 software (Applied Biosystems).
To quantify error rates across loci, 95 duplicate samples were run and genotypes were compared. We identified potential inconsistencies and the presence of null alleles for the entire data set using micro-checker (Oosterhout et al. 2004).
mtDNA analyses
Sequences were trimmed and aligned manually in BioEdit (Hall 1999) and unique haplotypes were confirmed by sequencing in the reverse direction. Haplotype and nucleotide diversity measures were calculated in arlequin v3.11 (Excoffier et al. 2005). A mismatch distribution was examined for signatures of recent expansion (Rogers and Harpending 1992). Phylogenetic relationships among haplotypes were inferred using a median-joining network (Bandelt et al. 1999) produced using network version 4.5 (http://fluxus-engineering.com/sharenet.htm; accessed 5 February 2009). The network was generated using only haplotypes that occurred more than once for network clarity, transversions were weighted, and the value of epsilon was varied to ensure that the optimal tree was produced (Fluxus Technology Inc. 2008, Suffolk, England).
Diversity measures and genetic differentiation among subpopulations was estimated using arlequin v3.11 using both ΦST (Excoffier et al. 1992) and the traditional approach (FST), which only considers haplotype frequencies. We used a Mantel test (Mantel 1967) to test for IBD. Prior to Mantel testing, the geographic distance matrix was log-transformed and the genetic matrix was also transformed [FST/(1 − FST)] as recommended by Rousset (1997). All Mantel tests were carried out in zt-win (Bonnet and Van de Peer 2002) using 10 000 permutations.
Microsatellite analysis
Allelic diversity, observed (HO), and expected (HE; Nei 1978) heterozygosity were calculated in GenAlEx v6.1 (Peakall and Smouse 2006). GenePop (Raymond and Rousset 1995; web version, http://genepop.curtin.edu.au/) was used to test for Hardy–Weinberg equilibrium (HWE) and linkage disequilibrium (LD) using exact tests. All measures were calculated for the global data set and the subpopulations. The Bonferroni correction was applied to correct for multiple statistical tests (Petit et al. 2001) to minimize Type I error (Zar 1999).
Broad-scale population structure
Analysis at the broad scale was conducted using two approaches. First, we assessed patterns of genetic differentiation among subpopulations using Mantel tests (Mantel 1967). This procedure tests for association between geographic and genetic distance matrices where a positive association indicates IBD. We also assessed IBD with respect to directionality by constraining the geographic distance matrix to east–west distance and north–south distance. We used two different measures of genetic differentiation, FST and Jost's (2008)D, because recent literature has indicated FST does not accurately reflect genetic differentiation when heterozygosities within subpopulations are high (Jost 2008, 2009; Heller and Siegismund 2009). We compared females and males separately analyzing only subpopulations with n > 20 males and females combined. Geographic and FST matrices were generated using spagedi1.2 (Hardy and Vekemans 2002). D was calculated among subpopulations using the arithmetic mean across loci using smogd (Crawford 2009). Transformation of distance matrices and Mantel testing were conducted as described for the mtDNA analysis.
We also assessed population structure using microsatellites across the entire study area independent of subpopulation designation using the Bayesian clustering program structure 2.2 (Pritchard et al. 2000; Falush et al. 2003, 2007). This program groups individuals into K genetically homogenous population clusters that optimize HWE. We chose the conservative admixture model and ran five simulations at each K (for K = 1–6) with a burn-in period of 100 000 Markov chains and 500 000 chains for data collection. The optimal K was selected by analyzing the relative change in the Ln probability of the runs using the equation developed by Evanno et al. (2005), as well as a thorough inspection of the assignment probabilities of individuals. Other methods of cluster analysis were not considered [i.e. Geneland (Guillot et al. 2005) or TESS (Francois et al. 2006)] because Chen et al. (2007) found that they do not perform as well when genetic connectivity is high.
Fine-scale population structure
We looked at genetic spatial autocorrelation within three regions: Nipawin (NP; n = 234, 1961 km2), North Border (NB; n = 498, 2142 km2), and South Border (SB; n = 354, 1652 km2) (Fig. 1). These areas were selected because they have large numbers of geo-referenced samples and they are CWD-endemic regions. We used Moran's I statistic for genetic data (Legendre and Fortin 1989; Hardy and Vekemans 1999) to estimate relative relatedness among individuals at 500 m distance classes up to 3000 m. This was calculated separately in each region for each sex class in spagedi1.2 (Hardy and Vekemans 2002). Significance of the autocorrelation was assessed by permuting individuals and locations for each distance class 10 000 times. The significance of the correlogram was evaluated using the progressive Bonferroni adjustment (Legendre and Fortin 1989).
To determine whether disease status was associated with relatedness, we calculated pair-wise relatedness among positive CWD cases in NP and compared the distribution with pair-wise relatedness of matched, nondiseased ‘case–controls’, where we matched sex, location, and where possible age. We restricted our analysis to NP because it is the region with the greatest number of positive white-tailed deer cases. Pair-wise relatedness (Queller and Goodnight 1989) between individuals within groups was calculated in spagedi 1.2 (Hardy and Vekemans 2002) using all samples from NP as the baseline. The distributions of pair-wise relatedness values are not independent points, so we used a nonparametric permutation approach to test for a significant difference between the means (Dietz 1983). In r version 2.9.1, we developed a script that generates two random samples from all of our pair-wise values (without replacement) and calculates the difference between the means. We permuted this 10 000 times to generate a distribution and compared with our actual value; if our value was within 95% of the distribution then our null hypothesis would be accepted.
Results
mtDNA analyses
Following sequence alignment and end trimming, we identified 79 variable sites comprising 37 haplotypes in a 611-bp fragment. The majority of sites were transitions (73); however, there were three transversions, two sites with both transitions and transversions, and one single base pair insertion. Haplotype diversity was 0.857 ± 0.014 and nucleotide diversity was 0.020 ± 0.001. The mismatch distribution was characterized by three peaks and did not indicate any signal of recent expansion. The resulting network indicates a number of lineages (Fig. 2) that are not spatially segregated (Fig. 3). We characterized haplotypes in 45 CWD-positive deer, and found similar haplotype diversity as in the total sample.
Figure 2.
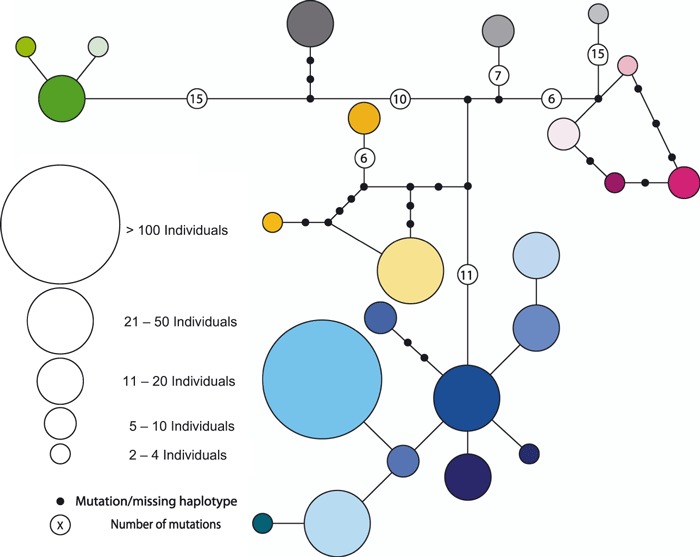
Median-joining network of 37 white-tailed deer haplotypes, haplotypes that occurred only once (n = 14) are not included for clarity. Circles are proportioned to represent the number of individuals sharing each haplotype and the colors correspond to the pie charts in Fig. 3 to indicate individual haplotypes.
Figure 3.
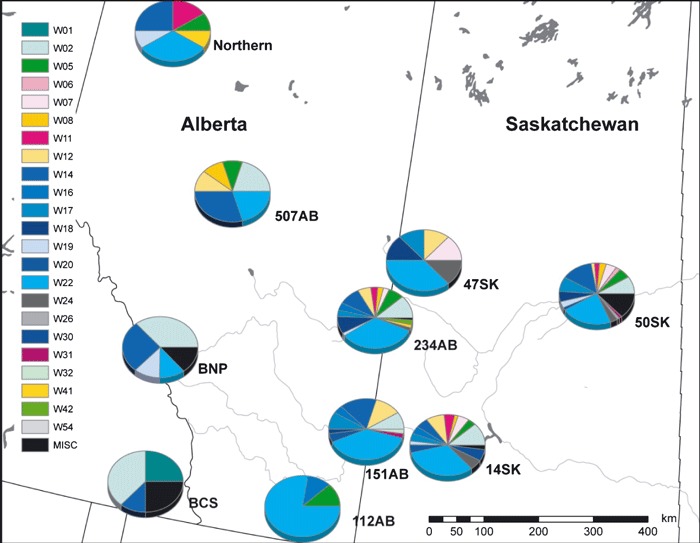
Pie charts indicate the distribution of white-tailed deer mtDNA haplotypes for each subpopulation in western Canada. The colors of the pie pieces correspond to Fig. 2 for reference.
Samples from 10 subpopulations (Fig. 1, Table 1, n = 8–240) were sequenced. Subpopulation 112AB had relatively lower haplotype diversity (H = 0.417). Nucleotide diversity ranged from 0.003 to 0.023, where higher values indicated the presence of different lineages within that region. Global differentiation was low, FST = 0.015 (P = 0.009) and ΦST = 0.010 (P = 0.112). Patterns of pair-wise genetic differentiation for FST and ΦST were similar and mostly nonsignificant (35/45 and 37/45, respectively). Most of the significant comparisons involved British Columbia South (BCS), the only sample to the west of the Rocky Mountains. Genetic and geographic distances were not correlated (Mantel tests: FST, r = 0.09, P = 0.321 and ΦST, r = 0.15, P = 0.248; Fig. 4). Due to higher pair-wise genetic differences between BCS and all other subpopulations, we performed a post hoc partial Mantel test using the separation of subpopulations across the Rocky Mountains. This separation explained 50% of the variance in ΦST among subpopulations (partial Mantel test: r = 0.71, P = 0.027; Fig. 4).
Table 1.
Haplotype (H) and nucleotide (π) diversity calculated for mtDNA control region using arlequin v3.11 (Excoffier et al. 2005) within each subpopulation (sample size is indicated as n) and observed heterozygosity (HO) and inbreeding coefficient (FIS) for microsatellites as estimated using GenAlEx v6.1 (Peakall and Smouse 2006) and GenePop (Raymond and Rousset 1995)
| mtDNA | Microsatellite | |||||
|---|---|---|---|---|---|---|
| Subpopulation | n | H | π | n | HO | FIS |
| 112AB | 9 | 0.417 ± 0.200 | 0.012 ± 0.008 | 29 | 0.671 ± 0.043 | −0.033 ± 0.042 |
| 14SK | 56 | 0.860 ± 0.034 | 0.020 ± 0.010 | 78 | 0.627 ± 0.054 | 0.096 ± 0.027 |
| 151AB | 50 | 0.792 ± 0.044 | 0.012 ± 0.006 | 415 | 0.671 ± 0.051 | 0.030 ± 0.018 |
| 234AB | 142 | 0.846 ± 0.023 | 0.021 ± 0.010 | 742 | 0.677 ± 0.047 | 0.033 ± 0.015 |
| 47SK | 8 | 0.893 ± 0.111 | 0.023 ± 0.013 | 58 | 0.633 ± 0.051 | 0.077 ± 0.038 |
| 507AB | 10 | 0.889 ± 0.075 | 0.023 ± 0.013 | 32 | 0.675 ± 0.056 | 0.016 ± 0.036 |
| 50SK | 240 | 0.903 ± 0.011 | 0.022 ± 0.011 | 257 | 0.671 ± 0.042 | 0.056 ± 0.018 |
| BCS | 8 | 0.857 ± 0.108 | 0.003 ± 0.002 | 56 | 0.539 ± 0.061 | 0.037 ± 0.020 |
| BNP | 8 | 0.857 ± 0.108 | 0.003 ± 0.002 | 22 | 0.598 ± 0.066 | 0.020 ± 0.044 |
| Northern | 13 | 0.872 ± 0.067 | 0.023 ± 0.013 | 16 | 0.623 ± 0.066 | 0.100 ± 0.053 |
| 23SK | 15 | 0.659 ± 0.059 | 0.027 ± 0.049 | |||
| 256AB | 45 | 0.643 ± 0.054 | 0.079 ± 0.034 | |||
| 25SK | 20 | 0.624 ± 0.069 | 0.077 ± 0.058 | |||
| 37SK | 36 | 0.623 ± 0.053 | 0.109 ± 0.036 | |||
| 45SK | 18 | 0.650 ± 0.054 | 0.040 ± 0.045 | |||
| 500AB | 64 | 0.665 ± 0.053 | 0.038 ± 0.047 | |||
| 62SK | 17 | 0.681 ± 0.062 | 0.018 ± 0.008 | |||
| BCN | 5 | 0.743 ± 0.077 | −0.146 ± 0.106 | |||
| Jasper | 20 | 0.674 ± 0.056 | 0.032 ± 0.042 | |||
| stn-wmz | 18 | 0.675 ± 0.060 | 0.018 ± 0.040 | |||
Locations of subpopulations are indicated in Fig. 1.
Figure 4.
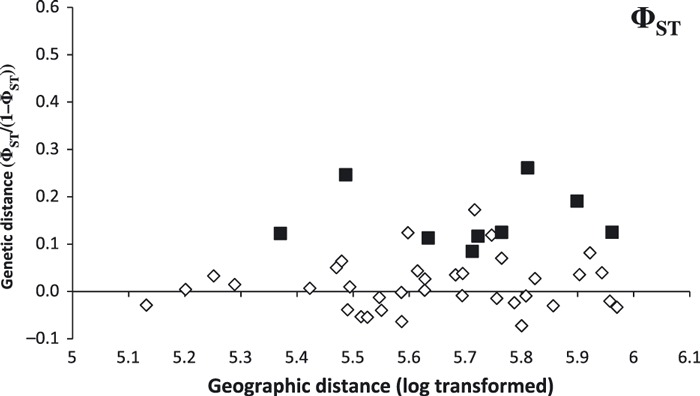
ΦST as a measure of genetic distance at the mtDNA control region plotted as a function of geographic distance between white-tailed deer subpopulations. Distances between subpopulations separated by the Rocky Mountains are indicated by black squares.
Microsatellite analysis
Genetic profiles were generated for 2088 individuals with 1.9% missing data, and <1% error rate overall. The loci used were highly variable with the number of alleles/locus ranging from 6 to 27, with an overall observed heterozygosity of 0.677 (Table 2). Global FIS for each locus ranged from −0.008 to 0.140, and was statistically significant from 0 at six loci following Bonferroni correction. LD was significant in 4 of 91 pair-wise comparisons (n with Rt5 and OCAM, INRA011 with OarFCB193, and OCAM with BM6438). These loci are unlikely to be linked because subpopulation LD analysis did not support the associations, and they have been considered independent in previous population-genetic studies on white-tailed deer (Dewoody et al. 1995; DeYoung et al. 2002; Jones et al. 2002). Observed heterozygosities were similar across subpopulations (0.539–0.743).
Table 2.
Number of alleles (Na), observed and expected heterozygosities (HO and HE, respectively) were calculated in GenAlEx 6.1 (Peakall and Smouse 2006), and FIS (Weir and Cockerham's 1984) was estimated in Genepop (Raymond and Rousset 1995)
| Locus | Na | HO | HE | FIS |
|---|---|---|---|---|
| BBJ2 | 8 | 0.510 | 0.523 | 0.026 |
| BL25 | 16 | 0.872 | 0.882 | 0.084* |
| BM4107 | 17 | 0.809 | 0.817 | 0.059* |
| BM6438 | 9 | 0.498 | 0.501 | 0.012 |
| Cervid1 | 27 | 0.840 | 0.891 | 0.009 |
| INRA011 | 7 | 0.510 | 0.592 | 0.006 |
| K | 12 | 0.777 | 0.823 | 0.023* |
| N | 7 | 0.445 | 0.485 | 0.057* |
| O | 17 | 0.762 | 0.810 | 0.140* |
| OarFCB193 | 6 | 0.365 | 0.373 | −0.008 |
| OCAM | 17 | 0.879 | 0.873 | 0.056* |
| R | 7 | 0.541 | 0.560 | 0.033* |
| Rt5 | 18 | 0.826 | 0.825 | −0.002 |
| Rt7 | 15 | 0.843 | 0.853 | 0.012 |
| Average | 13.1 | 0.677 | 0.701 | 0.036 |
Significant following Bonferroni correction.
Broad-scale population structure
Global genetic differentiation was very weak but statistically significant (FST = 0.006, P < 0.001, D = 0.022) and genetic differentiation between subpopulations was positively related to their geographic distance (Mantel tests: rFST = 0.273, P = 0.048; rD = 0.298, P = 0.035; Fig. 5). We performed a post hoc partial Mantel test to test for a potential effect of the Rocky Mountains on genetic differentiation because we observed differences for these two groupings in the mtDNA and the Bayesian structure analysis. The Rocky Mountains explained most of the variation in genetic distance (partial Mantel test: rFST = 0.858, P = 0.0001; rD = 0.764, P = 0.002; Fig. 5). We removed the BC subpopulation from the directional IBD analysis because it would have undue influence. IBD was pronounced along the North/South axis, where there was a significant pattern of IBD (rnorth/south = 0.395, P = 0.001), whereas there was no pattern along the east/west axis (reast/west = −0.140, P = 0.178).
Figure 5.
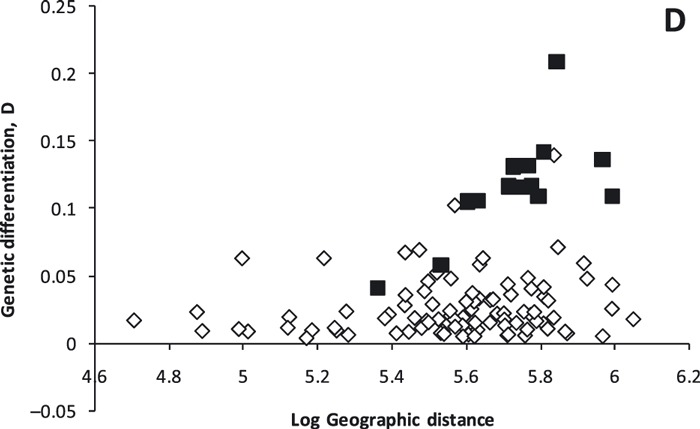
Genetic distance (D) plotted as a function of geographic distance between white-tailed deer subpopulations in western Canada based on microsatellite differentiation. Distances between subpopulations are separated by the Rocky Mountains and are indicated by black squares.
We did not observe sex bias in patterns of genetic differentiation among 10 subpopulations (those with n > 20: 112AB, 14SK, 151AB, 234AB, 256AB, 37SK, 47SK, 500AB, 507AB, and 50SK). Global differentiation was similar among male and female data subsets (FSTF = 0.002, P = 0.0002, DF = 0.014; FSTM = 0.002, P = 0.0016, DM = 0.018), and IBD patterns were similar using D (rD(F) = 0.365, P = 0.055; rD(M) = 0.366, P = 0.038) and FST (rFst(F) = 0.105, P = 0.346; rFst(M) = 0.307, P = 0.103).
We found only one cluster using the Bayesian structure analysis. There was very little change in Ln(P|K) through increasing values of K, and the assignment probabilities of individuals declined monotonically with increasing K (approximately 1/K). However, approximately 60% of the samples from British Columbia had higher group membership and were consistently assigned to the same cluster regardless of K. This suggests there may be two genetic clusters in the data. Large differences in sample size can affect the ability of structure to detect all populations (Serre and Paabo 2004; Rosenberg et al. 2005). When we performed a post hoc analysis using a subset of samples (112AB, BCS, BNP, and Jasper) and the same initial model parameters, we found evidence of K = 2, with 87% of BCS samples assigned to cluster 1 with over 0.80 membership and 61% of the Alberta samples assigned to cluster 2.
Fine-scale population structure
Spatial genetic autocorrelation disappeared by 1000 m in female white-tailed deer in NP, NB, and SB (NP, NF = 173; NB, NF = 277; SB, NF = 215; Fig. 6). Spatial autocorrelation among females at 500 m at NP (I = 0.052; Fig. 6) was much greater than among females separated by 500 m at NB (I = 0.019; Fig. 6) and SB (I = 0.016; Fig. 6). Males were unrelated at all distances at the NB and SB (NB, NM = 184, SB, NM = 139), and were not tested in NP due to low sample size (NM = 61).
Figure 6.
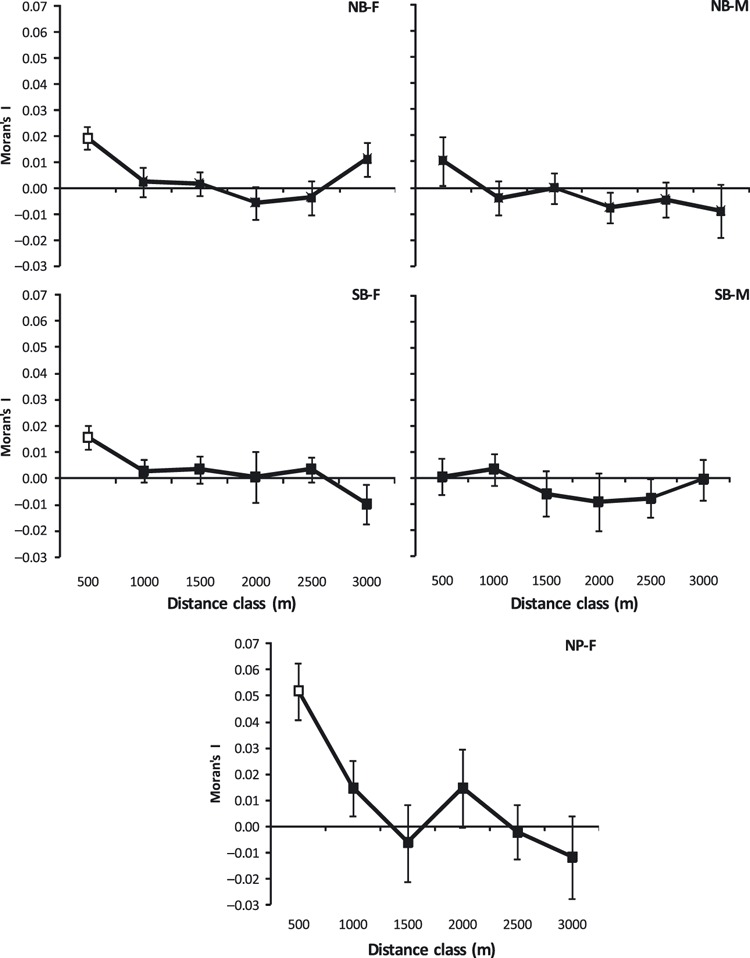
Moran's I among female and male white-tailed deer in the North Border (NB – top graphs), in the South Border (SB – middle graphs), and females in Nipawin (bottom graph). Open symbols indicate significant values >0 following a progressive Bonferroni correction. Jackknife estimates of standard error are shown.
Distributions of relatedness among diseased and case–control deer in NP did not significantly differ based on our permutation test (diseased = −0.020 ± 0.008, case–control = −0.025 ± 0.007).
Discussion
White-tailed deer were very weakly differentiated by genetics within our study area indicating an overall absence of historical and current barriers to gene flow east of the Rocky Mountains. In the early to middle 1900s, white-tailed deer populations on the Canadian prairies expanded from extremely low levels both in numbers and in the extent of their range (Wishart 1984; Natural Resources Service 1995). If their expansion occurred as a slow moving front, any signature of expansion would not be apparent and heterozygosity would have been maintained (Austerlitz et al. 1997). These expansion events together with the natural capability of deer to disperse distances of over 50 km (Hawkins and Klimstra 1970; Nelson 1993; Rosenberry et al. 1999; Long et al. 2005) likely lead to the weak population structure that we observed in both the mtDNA and microsatellite data. Previous genetic studies on white-tailed deer also show weak population structure (DeYoung et al. 2003; Doerner et al. 2005; Blanchong et al. 2008). The exception to this are populations in the south-eastern USA that show greater genetic differentiation (Ellsworth et al. 1994; Purdue et al. 2000), this is likely due to the stable history of these populations both pre- and post-Pleistocene (Cronin 1991; Purdue et al. 2000). Geographic distance does not explain genetic differentiation along the east/west axis but it does for the north/south axis. The absence of genetic differentiation along the east–west axis could result from dispersal along the major river drainages in the study area as they are oriented east-west (Fig. 1).
Mammalian dispersal is often sex-biased, where males disperse and females remain philopatric Greenwood 1980; Handley and Perrin 2007). When female philopatry is strong, different patterns of genetic differentiation between males and females arise, and patterns measured by maternal and bi-parental genetic markers are likely to differ (Storz 1999; Goudet et al. 2002; Prugnolle and de Meeus 2002; Avise 2004). Our fine-scale analyses support female philopatry at the local level, suggesting a larger proportion of females remain philopatric. However, we found weak mtDNA differentiation and similar levels of male and female microsatellite differentiation at broad scales, even though male white-tailed deer are the predominant dispersers (Hawkins and Klimstra 1970; Nelson and Mech 1984; Aycrigg and Porter 1997; Kilpatrick et al. 2001). There may be several reasons for this. First, due to recent range expansion across the Canadian Prairies, the populations may not be in mutation-drift equilibrium and therefore population structure has not had the time to establish (Ibrahim et al. 1996). Second, because deer have a high effective population size, a limited number of female dispersers would prevent the development of sex-biased differentiation (Mills and Allendorf 1996). Third, hunting can alter deer behavior (Williams et al. 2008) and affect genetic population structure (Allendorf et al. 2008).
The low overall genetic differentiation and absence of barriers to gene flow across Alberta and Saskatchewan suggest that CWD has the potential to spread from current foci of infection across the region over the long-term via dispersal. However, genetic structure across the Rocky Mountains implies a potential barrier to disease spread into British Columbia. At present, there are three major disease foci across Alberta and Saskatchewan, which are each separated by over 300 km. Each disease focus likely originated independently through contact between infected individuals in farming facilities and wild animals (Williams et al. 2002; Bollinger et al. 2004; Vercauteren et al. 2007). In the 13 years since CWD was first detected in captive cervids in Saskatchewan, documented cases of CWD remain highly clustered. Detection of CWD tends to be higher in males (Grear et al. 2006; Osnas et al. 2009) and a high proportion of white-tailed male juveniles disperses (46–80%; Hawkins and Klimstra 1970; Nelson and Mech 1984; Dusek et al. 1989; Nelson 1993; Nixon et al. 2007; Skuldt et al. 2008), therefore young male white-tailed deer may be the most likely vectors for long-distance disease spread in the short term. As a result, the distribution of male dispersal distances may be the most appropriate metric for estimating the per generation range for CWD spread and for guiding targeted management in the fall to ensure that the extent of the surveillance corresponds to male dispersal ability. However, the nondetection of new cases far from infection foci may be because the majority of sampling is focused in the general vicinity of CWD positive cases. White-tailed deer in many areas of the northern range are seasonally migratory, and tend to split their distribution between winter and summer ranges typically to avoid heavy snows (Nelson 1998; Nelson and Mech 1999). Distances moved during migration can equal those of dispersal and also may promote spread beyond the focal areas because animals in winter usually concentrate in snow-free areas. Conner and Miller (2004) suggested that migration of mule deer in Colorado was the most likely mechanism for disease spread among population units. Because migratory movements do not necessarily relate to gene flow, the relationship between disease spread and genetic structure may be decoupled in populations that exhibit long-distance seasonal migration.
White-tailed deer form female social groups that comprised mothers and their subsequent offspring. The structure of these groups is described as a rose petal (Porter et al. 1991; Nelson and Mech 1999) where the centre will have highly related individuals (mother–daughter) and relatedness will decrease as you move away from the centre. Our data provide evidence in support of this social structure at the local scale in all regions. The local genetic structure is consistent with other fine-scale analyses on white-tailed deer (Mathews and Porter 1993; Purdue et al. 2000; Blanchong et al. 2006). Schauber et al. (2007) analyzed contact rates among within- and between-group pairs and found a large disparity in contact rate, where within-group pairs were more likely to interact directly. Taken together, these data suggest that the scale and degree of social cohesion may be important in the transmission of CWD at the local level. This pattern may be more pronounced at certain times of the year. Our sampling was primarily conducted during the winter when deer will tend to form more cohesive social groups (Lingle 2003). We may have seen weaker patterns had our samples been collected during the rearing months. For example, Latch and Rhodes (2006) found that for wild turkeys (Meleagris gallopavo), genetic neighborhoods were very distinct in the winter when they flock together, yet during the breeding season unrelated individuals could be found in close proximity.
We find marked differences between NP, and the NB and SB populations, both in terms of relatedness and CWD prevalence (Figs 1 and 6), where both are higher in NP. If higher relatedness corresponds to increased transmission risk, the difference in prevalence among the regions could be related to the degree of social cohesion. From this, we would expect to see increased relatedness among infected individuals, for example increased relatedness among deer has been found in white-tailed deer infected with bovine tuberculosis (Blanchong et al. 2007). However, we did not detect elevated relatedness among CWD-infected pairs of white-tailed deer, but our sample size was limited by the small number of positive cases. CWD prevalence is higher in mule deer than white-tailed deer in Alberta, where approximately 90% of cases are mule deer. Nakada (2009) surveyed mule deer spatial-genetic structure in both the NB and SB using most of the same microsatellite loci reported here with samples collected under the same surveillance program and found higher levels of relatedness in both regions than we estimated for white-tailed deer (at 500 m: NB, IMD = 0.04, IWTD = 0.02; SB, IMD = 0.09, IWTD = 0.01) suggesting stronger social cohesion. In addition, diseased individuals were found to be more related than noninfected individuals. If there is elevated transmission within social groups of related deer, this would suggest that the pattern of spatial autocorrelation among female white-tailed deer may indicate the range of increased local transmission risk. Female pairs within <1000 m are positively related in all three regions. Although there are other factors that could also contribute to regional and species differences including disease sampling effort, time since CWD was established, density of deer, differential land-use, winter behavior, hunting pressure, and predation, they are beyond the scope of this analysis. It is also important to note that our study focused on deer-to-deer transmission. Environmentally mediated transmission is also likely to be important, since biological material such as saliva, urine, blood, feces, and carcasses are infectious (Miller and Williams 2003; Miller et al. 2004, Mathiason et al. 2006; Johnson et al. 2007; Haley et al. 2009; Tamgüney et al. 2009). However, the contribution of environmental contamination to disease spread is not known.
Disease management
Disease dynamics may occur at two spatial scales. At a broad-scale, biased dispersal can create opportunities for longer-distance disease spread. At a local scale, social cohesion and matriarchal associations provide a context for within-group transmission dynamics. Current CWD control programs are limited to density-reduction methods (Williams et al. 2002; Pybus and Hwang 2008) with the goal of reducing CWD prevalence or eliminating it from newly infected regions. The three main approaches to accomplish this are: (i) increasing hunter quotas, (ii) nonselective culling (Joly et al. 2006) and (iii) test and cull. For test and cull, testing is either conducted on live animals in the field that are removed once CWD infection is confirmed (Wolfe et al. 2004) or hunter submissions are tested and culls are carried out in the area where positive animals were harvested (Pybus 2007; Connor et al. 2007). Given our data, a combination of these approaches could contribute to reducing disease spread. Hunting seasons generally coincide with fall dispersal, and juvenile dispersing males are the most vulnerable to hunting mortality (Nelson and Mech 1986; Rosenberry et al. 1999; McCoy et al. 2005). By increasing hunter quotas for males, the number of successful male juvenile dispersers would be reduced, which could potentially limit the geographic spread of CWD (Gross and Miller 2001). Additionally the extent of surveillance should consider the migration patterns as these movements may provide alternative means of geographic spread. For test and cull strategies to be effective, the extent and timing of the cull must be considered. Because the factors that influence transmission are poorly understood (Gross and Miller 2001; Williams et al. 2002; Wasserberg et al. 2009), the culled regions have been calculated based on deer home-range size (7.25 and 3 km radii; Joly et al. 2006; Pybus 2007, respectively). For female–female interactions, the extent of the cull should include all individuals that potentially interacted with the diseased individual, i.e. the extent of positive spatial autocorrelation (<1000 m). Wolfe et al. (2004) did not find the removal of CWD-positive animals to have an effect on overall disease incidence. However, they removed only the individual infected, where other members in their social group may have contracted the disease and should have been removed as well. Regarding timing, deer form their social groups during the fall and winter seasons (Lingle 2003), therefore culls should be conducted during these seasons to ensure that the individuals associated with the positive case are eliminated. Male–male and male–female interactions also likely play a role in disease transmission (Miller and Williams 2003; Joly et al. 2006; Wasserberg et al. 2009), therefore the extent and timing of these interactions will also need to be considered in management strategies.
Chronic wasting disease is relatively new, and hence there is still considerable uncertainty regarding transmission, resistance, and long-term persistence (Williams et al. 2002; Wasserberg et al. 2009). Future CWD research should focus on two areas, understanding factors associated with spread and transmission, and disease prevention. In terms of better understanding transmission and spread, we need to determine how migratory movements and different seasonal behaviors contribute to disease spread. We also need to estimate the risk of transmission from environmental contamination and understand how it contributes to persistence (Miller et al. 2004, 2006). For disease prevention, the development of prophylactic treatment such as a vaccine is important. Wildlife managers would be better equipped to manage and potentially eradicate the disease with these tools. The use of oral vaccination for other wildlife diseases such as rabies (Cross et al. 2007) has been effective.
Acknowledgments
This work was funded by the Alberta Prion Research Institute and PrioNet Canada. The authors gratefully acknowledge the support and dedication of the large number of Alberta Fish and Wildlife enforcement, biological, administration and management staff, together with Saskatchewan Environment and Canadian Cooperative Wildlife Health Centre who contributed to ongoing CWD programs. Their efforts largely provided the sample source contained in this study. We also acknowledge support from the Alberta Conservation Association, Alberta Cooperative Conservation Research Unit, Alberta Professional Outfitter Society Alberta, Alberta Ingenuity, and the Canadian Foundation for Innovation. We thank the assistance of many people including Mark Ball, Bill Clark, Corey Davis, Laura Elliott, Chris Garrett, Tom Habib, Patrick James, Erica Kubanek, Erin Silbernagel, Chris Wilke, Marnie Zimmer, two anonymous reviewers, and the cooperating landowners and hunters in CWD-affected areas of AB and SK.
Appendix: Microsatellite primer information
Locus information for 16 microsatellites used to amplify white-tailed deer, included are forward and reverse primer sequence, multiplex panel, primer concentrations, florescent label and source.
| Panel | Locus | Primer sequence | Primer (μm) | Label | Reference | |
|---|---|---|---|---|---|---|
| 1a | BM6438 | 5′-TTGAGCACAGACACAGACTGG | 0.30 | PET | Bishop et al. (1994) | |
| 5′-ACTGAATGCCTCCTTTGTGC | ||||||
| N | 5′-TCCAGAGAAGCAACCAATAG | 0.20 | NED | Jones et al. (2002) | ||
| 5′-GTGTGCCTTAAACAACCTGT | ||||||
| O | 5′-ACGAGGTTCAGTGGTTCC | 0.20 | 6-FAM | Jones et al. (2002) | ||
| 5′-CAGGGCATAGTTTCCAAA | ||||||
| 1b | BBJ2 | 5′-GCACTTTAGCTCACTTCCTG | 0.10 | VIC | Wilson and Strobeck (1999) | |
| 5′-ACACTGCCCCGGTATCTTTG | ||||||
| Cervid1 | 5′-AAATGACAACCCGCTCCAGTATC | 0.25 | PET | Dewoody et al. (1995) | ||
| 5′-GTTTCCGTGCATCTCAACATGAGTTAG | ||||||
| INRA011 | 5′-CGAGTTTCTTTCCTCGTGGTAGGC | 0.10 | NED | Vainman et al. (1992) | ||
| 5′-GCTCGGCACATCTTCCTTAGCAAC | ||||||
| OCAM | 5′-CCTGACTATAATGTACAGATCCTC | 0.25 | VIC | Moore et al. (1992) | ||
| 5′-GCAGAATGACTAGGAAGGATGGCA | ||||||
| 2 | BL25 | 5′-AACAGTGGCAATGGAAGTGG | 0.10 | VIC | Bishop et al. (1994) | |
| 5′-AGTCAGGATCTAGTGGGTGAGTG | ||||||
| BM4107 | 5′-AGCCCCTGCTATTGTGTGAG | 0.20 | PET | Bishop et al. (1994) | ||
| 5′-ATAGGCTTTGCATTGTTCAGG | ||||||
| K | 5′-GCAGGAAGGAGGAGACAGTA | 0.20 | PET | Jones et al. (2002) | ||
| 5′-GCTGGTTCGTTATCATTTAGC | ||||||
| OarFCB193 | 5′-TTCATCTCAGACTGGGATTCAGAAAGGC | 0.20 | 6-FAM | Buchanan and Crawford (1993) | ||
| 5′-GCTTGGAAATAACCCTCCTGCATCCC | ||||||
| R | 5′-GGGGTCTTCTCAATCCA | 0.20 | 6-FAM | Jones et al. (2002) | ||
| 5′-TCAGTTGGAACTCTAAAGT | ||||||
| Rt5 | 5′-AATTCCATGAACAGAGGAG | 0.20 | VIC | Wilson et al. (1997) | ||
| 5′-CAGCATAATTCTGACAAGTG | ||||||
| Rt7 | 5′-CCTGTTCTACTCTTCTTCTC | 0.20 | VIC | Wilson et al. (1997) | ||
| 5′-ACTTTTCACGGGCACTGGTT |
Literature cited
- Albon SD, Staines HJ, Guinness FE, Clutton-Brock TH. Density-dependent changes in the spacing behaviour of female kin in red deer. Journal of Animal Ecology. 1992;61:131–137. [Google Scholar]
- Allendorf FW, England PR, Luikart G, Ritchie PA, Ryman N. Genetic effects of harvest on wild animal populations. Trends in Ecology & Evolution. 2008;23:327–337. doi: 10.1016/j.tree.2008.02.008. [DOI] [PubMed] [Google Scholar]
- Altizer S, Nunn CL, Thrall PH, Gittleman JL, Antonovics J, Cunningham AA, Dobson AP, et al. Social organization and parasite risk in mammals: integrating theory and empirical studies. Annual Review of Ecology Evolution and Systematics. 2003;34:517–547. [Google Scholar]
- Austerlitz F, JungMuller B, Godelle B, Gouyon PH. Evolution of coalescence times, genetic diversity and structure during colonization. Theoretical Population Biology. 1997;51:148–164. [Google Scholar]
- Avise JC. Molecular Markers, Natural History, and Evolution. 2nd edn. Sunderland, MA: Sinauer Associates; 2004. [Google Scholar]
- Aycrigg JL, Porter WF. Sociospatial dynamics of white-tailed deer in the central Adirondack Mountains, New York. Journal of Mammalogy. 1997;78:468–482. [Google Scholar]
- Baeten LA, Powers BE, Jewell JE, Spraker TR, Miller MW. A natural case of chronic wasting disease in a free-ranging moose (Alces alces shirasi. Journal of Wildlife Diseases. 2007;43:309–314. doi: 10.7589/0090-3558-43.2.309. [DOI] [PubMed] [Google Scholar]
- Bandelt HJ, Forster P, Rohl A. Median-joining networks for inferring intraspecific phylogenies. Molecular Biology and Evolution. 1999;16:37–48. doi: 10.1093/oxfordjournals.molbev.a026036. [DOI] [PubMed] [Google Scholar]
- Beyer HL. 2004. Hawth's Analysis Tools for ArcGIS http://www.spatialecology.com/htools. (accessed 18 August 2008)
- Bishop R. The economic impacts of chronic wasting disease (CWD) in Wisconsin. Human Dimensions of Wildlife. 2004;9:181–192. [Google Scholar]
- Bishop MD, Kappes SM, Keele JW, Stone RT, Sunder SLF, Hawkins GA, Toldo SS, et al. A genetic linkage map for cattle. Genetics. 1994;136:619–639. doi: 10.1093/genetics/136.2.619. [DOI] [PMC free article] [PubMed] [Google Scholar]
- Blanchong JA, Joly DO, Samuel MD, Langenberg JA, Rolley RE, Sausen JF. White-tailed deer harvest from the chronic wasting disease eradication zone in south-central Wisconsin. Wildlife Society Bulletin. 2006;34:725–731. [Google Scholar]
- Blanchong JA, Scribner KT, Kravchenko AN, Winterstein SR. TB-infected deer are more closely related than non-infected deer. Biology Letters. 2007;3:103–105. doi: 10.1098/rsbl.2006.0547. [DOI] [PMC free article] [PubMed] [Google Scholar]
- Blanchong JA, Samuel MD, Scribner KT, Weckworth BV, Langenberg JA, Filcek KB. Landscape genetics and the spatial distribution of chronic wasting disease. Biology Letters. 2008;4:130–133. doi: 10.1098/rsbl.2007.0523. [DOI] [PMC free article] [PubMed] [Google Scholar]
- Bollinger T, Caley P, Merrill E, Messier F, Miller MW, Samuel MD, Vanopdenbosch E. Chronic Wasting Disease in Canadian Wildlife: An Expert Opinion on the Epidemiology and Risks to Wild Deer. Saskatoon, SK, Canada: Canadian Cooperative Wildlife Health Centre, Western College of Veterinary Medicine; 2004. Prepared by: Expert Scientific Panel on Chronic Wasting Disease, July 2004. [Google Scholar]
- Bonnet E, Van de Peer Y. zt: a software tool for simple and partial Mantel tests. Journal of Statistical Software. 2002;10:1–12. [Google Scholar]
- Bowyer RT. Sexual segregation in southern mule deer. Journal of Mammalogy. 1984;65:410–417. [Google Scholar]
- Buchanan FC, Crawford AM. Ovine mirosatellites at the OarFCB11, OarFCB128, OarFCB193, OarFCB266, and OarFCB204 loci. Animal Genetics. 1993;24:145. doi: 10.1111/j.1365-2052.1993.tb00269.x. [DOI] [PubMed] [Google Scholar]
- Chen C, Durand E, Forbes F, Francois O. Bayesian clustering algorithms ascertaining spatial population structure: a new computer program and a comparison study. Molecular Ecology Notes. 2007;7:747–756. [Google Scholar]
- Conner MM, Miller MW. Movement patterns and spatial epidemiology of a prion disease in mule deer population units. Ecological Applications. 2004;14:1870–1881. [Google Scholar]
- Conner MM, Ebinger MR, Blanchong JA, Cross PC. Infectious disease in cervids of north America – data, models, and management challenges. In: Ostfeld RS, Schlesinger WH, editors. Year in Ecology and Conservation Biology 2008. New York: Wiley-Blackwell; 2008. pp. 146–172. [DOI] [PubMed] [Google Scholar]
- Connor MM, Miller MW, Ebinger MR, Burnham KP. A meta-baci approach for evaluating management intervention on chronic wasting disease in mule deer. Ecological Applications. 2007;17:140–153. doi: 10.1890/1051-0761(2007)017[0140:amafem]2.0.co;2. [DOI] [PubMed] [Google Scholar]
- Crawford NG. SMOGD: software for the measurement of genetic diversityMolecular Ecology Resources. 2009;10:556–557. doi: 10.1111/j.1755-0998.2009.02801.x. [DOI] [PubMed] [Google Scholar]
- Cronin MA. Mitochondrial-DNA phylogeny of deer (Cervidae) Journal of Mammalogy. 1991;72:553–566. [Google Scholar]
- Cross ML, Buddle BM, Aldwell FE. The potential of oral vaccines for disease control in wildlife species. The Veterinary Journal. 2007;174:472–480. doi: 10.1016/j.tvjl.2006.10.005. [DOI] [PubMed] [Google Scholar]
- Cullingham CI, Kyle CJ, Pond BA, Rees EE, White BN. Differential permeability of rivers to raccoon gene flow corresponds to rabies incidence in Ontario, Canada. Molecular Ecology. 2009;18:43–53. doi: 10.1111/j.1365-294X.2008.03989.x. [DOI] [PubMed] [Google Scholar]
- Dewoody JA, Honeycutt RL, Skow LC. Microsatellite markers in white-tailed deer. Journal of Heredity. 1995;86:317–319. doi: 10.1093/oxfordjournals.jhered.a111593. [DOI] [PubMed] [Google Scholar]
- DeYoung RW, Demarais S, Gonzales RA, Honeycutt RL, Gee KL. Multiple paternity in white-tailed deer (Odocoileus virginianus) revealed by DNA microsatellites. Journal of Mammalogy. 2002;83:884–892. [Google Scholar]
- DeYoung RW, Demarais S, Honeycutt RL, Gonzales RA, Gee KL, Anderson JD. Evaluation of a DNA microsatellite panel useful for genetic exclusion studies in white-tailed deer. Wildlife Society Bulletin. 2003;31:220–232. [Google Scholar]
- Dietz EJ. Permutation tests for association between two distance matrices. Systematic Zoology. 1983;32:21–26. [Google Scholar]
- Doerner KC, Braden W, Cork J, Cunningham T, Rice A, Furman BJ, McElroy D. Population genetics of resurgence: white-tailed deer in Kentucky. Journal of Wildlife Management. 2005;69:345–355. [Google Scholar]
- Dusek GL, Mackie RJ, Herriges JD, Compton BB. Population Ecology of White-Tailed Deer Along the Lower Yellowstone River. Wildlife Monographs. 1989;104:3–68. [Google Scholar]
- Ellsworth DL, Honeycutt RL, Silvy NJ, Smith MH, Bickham JW, Klimstra WD. White-tailed deer restoration to the Southeastern United-States – evaluating genetic-variation. Journal of Wildlife Management. 1994;58:686–697. [Google Scholar]
- Evanno G, Regnaut S, Goudet J. Detecting the number of clusters of individuals using the software STRUCTURE: a simulation study. Molecular Ecology. 2005;14:2611–2620. doi: 10.1111/j.1365-294X.2005.02553.x. [DOI] [PubMed] [Google Scholar]
- Excoffier L, Smouse PE, Quattro JM. Analysis of molecular variance inferred from metric distances among DNA haplotypes – application to human mitochondrial-DNA restriction data. Genetics. 1992;131:479–491. doi: 10.1093/genetics/131.2.479. [DOI] [PMC free article] [PubMed] [Google Scholar]
- Excoffier L, Laval G, Schneider S. Arlequin (version 3.0): an integrated software package for population genetics data analysis. Evolutionary Bioinformatics. 2005;1:47–50. [PMC free article] [PubMed] [Google Scholar]
- Falush D, Stephens M, Pritchard JK. Inference of population structure using multilocus genotype data: linked loci and correlated allele frequencies. Genetics. 2003;164:1567–1587. doi: 10.1093/genetics/164.4.1567. [DOI] [PMC free article] [PubMed] [Google Scholar]
- Falush D, Stephens M, Pritchard JK. Inference of population structure using multilocus genotype data: dominant markers and null alleles. Molecular Ecology Notes. 2007;7:574–578. doi: 10.1111/j.1471-8286.2007.01758.x. [DOI] [PMC free article] [PubMed] [Google Scholar]
- Farnsworth ML, Hoeting JA, Hobbs NT, Miller MW. Linking chronic wasting disease to mule deer movement scales: a hierarchical Bayesian approach. Ecological Applications. 2006;16:1026–1036. doi: 10.1890/1051-0761(2006)016[1026:lcwdtm]2.0.co;2. [DOI] [PubMed] [Google Scholar]
- Francois O, Ancelet S, Guillot G. Bayesian clustering using hidden Markov random fields in spatial population genetics. Genetics. 2006;174:805–816. doi: 10.1534/genetics.106.059923. [DOI] [PMC free article] [PubMed] [Google Scholar]
- Geist V. Deer of the World. Their Evolution, Behavior, and Ecology. Mechanicsburg, PA: Stackpole Books; 1998. [Google Scholar]
- Goudet J, Perrin N, Waser P. Tests for sex-biased dispersal using bi-parentally inherited genetic markers. Molecular Ecology. 2002;11:1103–1114. doi: 10.1046/j.1365-294x.2002.01496.x. [DOI] [PubMed] [Google Scholar]
- Grear DA, Samuel MD, Langenberg JA, Keane D. Demographic patterns and harvest vulnerability of chronic wasting disease infected white-tailed deer in Wisconsin. Journal of Wildlife Management. 2006;70:546–553. [Google Scholar]
- Greenwood PJ. Mating systems, philopatry and dispersal in birds and mammals. Animal Behaviour. 1980;28:1140–1162. [Google Scholar]
- Gross JE, Miller MW. Chronic wasting disease in mule deer: disease dynamics and control. Journal of Wildlife Management. 2001;65:205–215. [Google Scholar]
- Guillot G, Mortier F, Estoup A. GENELAND: a computer package for landscape genetics. Molecular Ecology Notes. 2005;5:712–715. [Google Scholar]
- Haley NJ, Seeling DM, Zabel MD, Telling GC, Hoover EA. Detection of CWD prions in urine and saliva of deer by transgenic mouse bioassay. PLoS ONE. 2009;4:e4848. doi: 10.1371/journal.pone.0004848. doi: 10.1371/journal.pone.0004848. [DOI] [PMC free article] [PubMed] [Google Scholar]
- Hall TA. BioEdit: a user-friendly biological sequence alignment editor and analysis program for Windows 95/98/NT. Nucleic Acids Symposium Series. 1999;41:95–98. [Google Scholar]
- Handley LJL, Perrin N. Advances in our understanding of mammalian sex-biased dispersal. Molecular Ecology. 2007;16:1559–1578. doi: 10.1111/j.1365-294X.2006.03152.x. [DOI] [PubMed] [Google Scholar]
- Hardy OJ, Vekemans X. Isolation by distance in a continuous population: reconciliation between spatial autocorrelation analysis and population genetics models. Heredity. 1999;83:145–154. doi: 10.1046/j.1365-2540.1999.00558.x. [DOI] [PubMed] [Google Scholar]
- Hardy OJ, Vekemans X. SPAGEDi: a versatile computer program to analyze spatial genetic structure at the individual or population levels. Molecular Ecology Notes. 2002;2:618–620. [Google Scholar]
- Hastings A, Cuddington K, Davies KF, Dugaw CJ, Elmendorf S, Freestone A, Harrison S, et al. The spatial spread of invasions: new developments in theory and evidence. Ecology Letters. 2005;8:91–101. [Google Scholar]
- Hawkins RE, Klimstra WD. A preliminary study of social organization of white-tailed deer. Journal of Wildlife Management. 1970;34:407. [Google Scholar]
- Heller R, Siegismund HR. Relationship between three measures of genetic differentiation G(ST), D-EST and G’(ST): how wrong have we been? Molecular Ecology. 2009;18:2080–2083. doi: 10.1111/j.1365-294x.2009.04185.x. [DOI] [PubMed] [Google Scholar]
- Holderegger R, Wagner HH. A brief guide to landscape genetics. Landscape Ecology. 2006;21:793–796. [Google Scholar]
- Ibrahim K, Nichols R, Hewitt G. Spatial patterns of genetic variation generated by different forms of dispersal during range expansion. Heredity. 1996;77:282–291. [Google Scholar]
- Johnson CJ, Pedersen JA, Chappell RJ, McKenzie D, Aiken JM. Oral transmissibility of prion disease is enhanced by binding to soil particles. PLoS Pathogens. 2007;3:874–881. doi: 10.1371/journal.ppat.0030093. [DOI] [PMC free article] [PubMed] [Google Scholar]
- Joly DO, Samuel MD, Langenberg JA, Blanchong JA, Batha CA, Rolley RE, Keane DP, et al. Spatial epidemiology of chronic wasting disease in Wisconsin white-tailed deer. Journal of Wildlife Diseases. 2006;42:578–588. doi: 10.7589/0090-3558-42.3.578. [DOI] [PubMed] [Google Scholar]
- Jones KC, Levine KF, Banks JD. Characterization of 11 polymorphic tetranucleotide microsatellites for forensic applications in California elk (Cervus elaphus canadensis. Molecular Ecology Notes. 2002;2:425–427. [Google Scholar]
- Jost L. G(ST) and its relatives do not measure differentiation. Molecular Ecology. 2008;17:4015–4026. doi: 10.1111/j.1365-294x.2008.03887.x. [DOI] [PubMed] [Google Scholar]
- Jost L. D vs. G(ST): response to Heller and Siegismund (2009) and Ryman and Leimar (2009) Molecular Ecology. 2009;18:2088–2091. [Google Scholar]
- Kilpatrick HJ, Spohr SM, Lima KK. Effects of population reduction on home ranges of female white-tailed deer at high densities. Canadian Journal of Zoology-Revue Canadienne De Zoologie. 2001;79:949–954. [Google Scholar]
- Latch EK, Rhodes E. Evidence for bias in estimates of local genetic structure due to sampling scheme. Animal Conservation. 2006;9:308–315. [Google Scholar]
- Legendre P, Fortin MJ. Spatial pattern and ecological analysis. Vegetatio. 1989;80:107–138. [Google Scholar]
- Lingle S. Group composition and cohesion in sympatric white-tailed deer and mule deer. Canadian Journal of Zoology – Revue Canadienne De Zoologie. 2003;81:1119–1130. [Google Scholar]
- Long ES, Diefenbach DR, Rosenberry CS, Wallingford BD, Grund MRD. Forest cover influences dispersal distance of white-tailed deer. Journal of Mammalogy. 2005;86:623–629. [Google Scholar]
- Manel S, Schwartz MK, Luikart G, Taberlet P. Landscape genetics: combining landscape ecology and population genetics. Trends in Ecology & Evolution. 2003;18:189–197. [Google Scholar]
- Mantel N. The detection of disease clustering and a generalized regression approach. Cancer Research. 1967;27:209–220. [PubMed] [Google Scholar]
- Mathews NE, Porter WF. Effect of social-structure on genetic-structure of free-ranging white-tailed deer in the Adirondack Mountains. Journal of Mammalogy. 1993;74:33–43. [Google Scholar]
- Mathiason C, Powers J, Dahmes S, Osborn D, Miller K, Warren R, Mason G, et al. Infectious prions in the saliva and blood of deer with chronic wasting disease. Science. 2006;314:133–136. doi: 10.1126/science.1132661. [DOI] [PubMed] [Google Scholar]
- McCoy JE, Hewitt DG, Bryant FC. Dispersal by yearling male white-tailed deer and implications for management. Journal of Wildlife Management. 2005;69:366–376. [Google Scholar]
- Miller MW, Conner MM. Epidemiology of chronic wasting disease in free-ranging mule deer: spatial, temporal, and demographic influences on observed prevalence patterns. Journal of Wildlife Diseases. 2005;41:275–290. doi: 10.7589/0090-3558-41.2.275. [DOI] [PubMed] [Google Scholar]
- Miller MW, Williams ES. Horizontal prion transmission in mule deer. Nature. 2003;425:35–36. doi: 10.1038/425035a. [DOI] [PubMed] [Google Scholar]
- Miller MW, Williams ES, McCarty CW, Spraker TR, Kreeger TJ, Larsen CT, Thorne ET. Epizootiology of chronic wasting disease in free-ranging cervids in Colorado and Wyoming. Journal of Wildlife Diseases. 2000;36:676–690. doi: 10.7589/0090-3558-36.4.676. [DOI] [PubMed] [Google Scholar]
- Miller MW, Williams ES, Hobbs NT, Wolfe LL. Environmental sources of prion transmission in mule deer. Emerging Infectious Diseases. 2004;10:1003–1006. doi: 10.3201/eid1006.040010. [DOI] [PMC free article] [PubMed] [Google Scholar]
- Miller MW, Hobbs NT, Tavener SJ. Dynamics of prion disease transmission in mule deer. Ecological Applications. 2006;16:2208–2214. doi: 10.1890/1051-0761(2006)016[2208:dopdti]2.0.co;2. [DOI] [PubMed] [Google Scholar]
- Mills LS, Allendorf FW. The one-migrant-per-generation rule in conservation and management. Conservation Biology. 1996;10:1509–1518. [Google Scholar]
- Miyamoto MM, Kraus F, Ryder OA. Phylogeny and evolution of antlered deer determined from mitochondrial-dna sequences. Proceedings of the National Academy of Sciences of the United States of America. 1990;87:6127–6131. doi: 10.1073/pnas.87.16.6127. [DOI] [PMC free article] [PubMed] [Google Scholar]
- Moore SS, Barendse W, Berger KT, Armitage SM, Hetzel DJ. Bovine and ovine DNA microsatellites from EMBL and GENBANK databases. Animal Genetics. 1992;5:463–467. doi: 10.1111/j.1365-2052.1992.tb02168.x. [DOI] [PubMed] [Google Scholar]
- Nakada SM. Edmonton, AB: University of Alberta; 2009. Molecular epidemiology of chronic wasting disease in free-ranging mule deer (Odocoileus Hemionus) of Western Canada. MSc Thesis. [Google Scholar]
- Natural Resources Service. Management Plan for White-Tailed Deer in Alberta. Edmonton, AB: Alberta Environmental Protection Natural Resources, Government of Alberta; 1995. [Google Scholar]
- Nei M. Estimation of average heterozygosity and genetic distance from a small number of individuals. Genetics. 1978;89:583–590. doi: 10.1093/genetics/89.3.583. [DOI] [PMC free article] [PubMed] [Google Scholar]
- Nelson ME. Natal dispersal and gene flow in white-tailed deer in Northeastern Minnesota. Journal of Mammalogy. 1993;74:316–322. [Google Scholar]
- Nelson M. Development of migratory behavior in northern white-tailed deer. Canadian Journal of Zoology. 1998;76:426–432. [Google Scholar]
- Nelson ME, Mech LD. Home-range formation and dispersal of deer in Northeastern Minnesota. Journal of Mammalogy. 1984;65:567–575. [Google Scholar]
- Nelson ME, Mech LD. Mortality of white-tailed deer in northeastern Minnesota. Journal of Wildlife Management. 1986;50:691–698. [Google Scholar]
- Nelson ME, Mech LD. Twenty-year home-range dynamics of a white-tailed deer matriline. Canadian Journal of Zoology – Revue Canadienne De Zoologie. 1999;77:1128–1135. [Google Scholar]
- Nixon CM, Mankin PC, Etter DR, Hansen LP, Brewer PA, Chelsvig JE, Esker TL, et al. White-tailed deer dispersal behavior in an agricultural environment. American Midland Naturalist. 2007;157:212–220. [Google Scholar]
- Oosterhout CV, Hutchinson WF, Wills DPM, Shipley P. MICRO-CHECKER: software for identifying and correcting genotyping errors in microsatellite data. Molecular Ecology Notes. 2004;4:535–538. [Google Scholar]
- Osnas EE, Heisey DM, Rolley RE, Samuel MD. Spatial and temporal patterns of chronic wasting disease: fine-scale mapping of a wildlife epidemic in Wisconsin. Ecological Applications. 2009;19:1311–1322. doi: 10.1890/08-0578.1. [DOI] [PubMed] [Google Scholar]
- Peakall R, Smouse PE. GENALEX 6: genetic analysis in Excel. Population genetic software for teaching and research. Molecular Ecology Notes. 2006;6:288–295. doi: 10.1093/bioinformatics/bts460. [DOI] [PMC free article] [PubMed] [Google Scholar]
- Petit E, Balloux F, Goudet J. Sex-biased dispersal in a migratory bat: a characterization using sex-specific demographic parameters. Evolution. 2001;55:635–640. doi: 10.1554/0014-3820(2001)055[0635:sbdiam]2.0.co;2. [DOI] [PubMed] [Google Scholar]
- Porter WF, Mathews NE, Underwood HB, Sage RW, Behrend DF. Social-organization in deer – implications for localized management. Environmental Management. 1991;15:809–814. [Google Scholar]
- Pritchard JK, Stephens M, Donnelly P. Inference of population structure using multilocus genotype data. Genetics. 2000;155:945–959. doi: 10.1093/genetics/155.2.945. [DOI] [PMC free article] [PubMed] [Google Scholar]
- Prugnolle F, De Meeus T. Inferring sex-biased dispersal from population genetic tools: a review. Heredity. 2002;88:161–165. doi: 10.1038/sj.hdy.6800060. [DOI] [PubMed] [Google Scholar]
- Prusiner SB. Prions. Proceedings of the National Academy of Sciences of the United States of America. 1998;95:13363–13383. doi: 10.1073/pnas.95.23.13363. [DOI] [PMC free article] [PubMed] [Google Scholar]
- Purdue JR, Smith MH, Patton JC. Female philopatry and extreme spatial genetic heterogeneity in white-tailed deer. Journal of Mammalogy. 2000;81:179–185. [Google Scholar]
- Pybus MJ. Alberta Fish and Wildlife. Edmonton, AB: Alberta Government; 2007. Alberta's chronic wasting disease response program: March 2007. http://www.srd.alberta.ca/BiodiversityStewardship/WildlifeDiseases/ChronicWastingDisease/documents/AlbertaCWDResponseProgram-ExecutiveSummary-March2007.pdf (accessed 3 November 2009) [Google Scholar]
- Pybus MJ, Hwang YT. 2008. Chronic Wasting Disease Workshop Report. Alberta Fish and Wildlife and Saskatchewan Ministry of Environment, Edmonton Alberta http://www.environment.gov.sk.ca/Default.aspx?DN=48a16642-8ecc-479e-be3b-15b9bdd69c44 (accessed on 4 November 2009)
- Queller DC, Goodnight KF. Estimating relatedness using genetic-markers. Evolution. 1989;43:258–275. doi: 10.1111/j.1558-5646.1989.tb04226.x. [DOI] [PubMed] [Google Scholar]
- Raymond M, Rousset F. Genepop (version-1.2) – population-genetics software for exact tests and ecumenicism. Journal of Heredity. 1995;86:248–249. [Google Scholar]
- Rees EE, Pond BA, Cullingham CI, Tinline RR, Ball D, Kyle CJ, White BN. Assessing a landscape barrier using genetic simulation modelling: implications for raccoon rabies management. Preventative Veterinary Medicine. 2008;86:107–123. doi: 10.1016/j.prevetmed.2008.03.007. [DOI] [PubMed] [Google Scholar]
- Rees EE, Pond BA, Cullingham CI, Tinline RR, Ball D, Kyle CJ, White BN. Landscape modelling spatial bottlenecks: implications for raccoon rabies disease spread. Biology Letters. 2009;5:387–390. doi: 10.1098/rsbl.2009.0094. [DOI] [PMC free article] [PubMed] [Google Scholar]
- Rogers AR, Harpending H. Population-growth makes waves in the distribution of pairwise genetic-differences. Molecular Biology and Evolution. 1992;9:552–569. doi: 10.1093/oxfordjournals.molbev.a040727. [DOI] [PubMed] [Google Scholar]
- Rosenberg NA, Mahajan S, Ramachandran S, Zhao CF, Pritchard JK, Feldman MW. Clines, clusters, and the effect of study design on the inference of human population structure. PLoS Genetics. 2005;1:660–671. doi: 10.1371/journal.pgen.0010070. [DOI] [PMC free article] [PubMed] [Google Scholar]
- Rosenberry CS, Lancia RA, Conner MC. Population effects of white-tailed deer dispersal. Wildlife Society Bulletin. 1999;27:858–864. [Google Scholar]
- Rousset F. Genetic differentiation and estimation of gene flow from F-statistics under isolation by distance. Genetics. 1997;145:1219–1228. doi: 10.1093/genetics/145.4.1219. [DOI] [PMC free article] [PubMed] [Google Scholar]
- Russell CA, Smith DL, Childs JE, Real LA. Predictive spatial dynamics and strategic planning for a raccoon rabies emergence in Ohio. PLoS Biology. 2005;3:e88. doi: 10.1371/journal.pbio.0030088. doi: 10.1371/journal.pbio.0030088. [DOI] [PMC free article] [PubMed] [Google Scholar]
- Schauber EM, Storm DJ, Nielsen CK. Effects of joint space use and group membership on contact rates among white-tailed deer. Journal of Wildlife Management. 2007;71:155–163. [Google Scholar]
- Serre D, Paabo SP. Evidence for gradients of human genetic diversity within and among continents. Genome Research. 2004;14:1679–1685. doi: 10.1101/gr.2529604. [DOI] [PMC free article] [PubMed] [Google Scholar]
- Sigurdson CJ, Aguzzi A. Chronic wasting disease. Biochimica Et Biophysica Acta – Molecular Basis of Disease. 2007;1772:610–618. doi: 10.1016/j.bbadis.2006.10.010. [DOI] [PMC free article] [PubMed] [Google Scholar]
- Skuldt LH, Mathews NE, Oyer AM. White-tailed deer movements in a chronic wasting disease area in south-central Wisconsin. Journal of Wildlife Management. 2008;72:1156–1160. [Google Scholar]
- Storfer A, Murphy MA, Evans JS, Goldberg CS, Robinson S, Spear SF, Dezzani R, et al. Putting the ‘landscape’ in landscape genetics. Heredity. 2007;98:128–142. doi: 10.1038/sj.hdy.6800917. [DOI] [PubMed] [Google Scholar]
- Storz JF. Genetic consequences of mammalian social structure. Journal of Mammalogy. 1999;80:553–569. [Google Scholar]
- Tamgüney G, Miller MW, Wolfe LL, et al. Asymptomatic deer excrete infectious prions in faeces. Nature. 2009;461:529–532. doi: 10.1038/nature08289. [DOI] [PMC free article] [PubMed] [Google Scholar]
- Vaiman D, Osta R, Mercier D, Grohs C, Leveziel H. Characterization of five new bovine dinucleotide repeats. Animal Genetics. 1992;23:537–541. doi: 10.1111/j.1365-2052.1992.tb00175.x. [DOI] [PubMed] [Google Scholar]
- Vercauteren KC, Lavelle MJ, Seward NW, Fischer JW, Phillips GE. Fence-line contact between wild and farmed cervids in Colorado: potential for disease transmission. Journal of Wildlife Management. 2007;71:1594–1602. [Google Scholar]
- Wasserberg G, Osnas EE, Rolley RE, Samuel MD. Host culling as an adaptive management tool for chronic wasting disease in white-tailed deer: a modelling study. Journal of Applied Ecology. 2009;46:457–466. doi: 10.1111/j.1365-2664.2008.01576.x. [DOI] [PMC free article] [PubMed] [Google Scholar]
- Weir B, Cockerham C. Estimating F-statistics for the analysis of population structure. Evolution. 1984;38:1358–1370. doi: 10.1111/j.1558-5646.1984.tb05657.x. [DOI] [PubMed] [Google Scholar]
- Williams ES, Young S. Chronic wasting disease of captive mule deer – spongiform encephalopathy. Journal of Wildlife Diseases. 1980;16:89–98. doi: 10.7589/0090-3558-16.1.89. [DOI] [PubMed] [Google Scholar]
- Williams ES, Young S. Spongiform encephalopathy of rocky-mountain elk. Journal of Wildlife Diseases. 1982;18:465–471. doi: 10.7589/0090-3558-18.4.465. [DOI] [PubMed] [Google Scholar]
- Williams ES, Miller MW, Kreeger TJ, Kahn RH, Thorne ET. Chronic wasting disease of deer and elk: a review with recommendations for management. Journal of Wildlife Management. 2002;66:551–563. [Google Scholar]
- Williams SC, DeNicola AJ, Ortega IM. Behavioral responses of white-tailed deer subjected to lethal management. Canadian Journal of Zoology. 2008;86:1358–1366. [Google Scholar]
- Wilson GA, Strobeck C, Wu L, Coffin JW. Characterization of microsatellite loci in caribou Rangifer tarandus, and their use in other artiodactyls. Molecular Ecology. 1997;6:697–699. doi: 10.1046/j.1365-294x.1997.00237.x. [DOI] [PubMed] [Google Scholar]
- Wilson GA, Stroebeck C. Genetic variation within and relatedness among wood and plains bison populations. Genome. 1999;42:483–496. [PubMed] [Google Scholar]
- Wishart WD. Whitetail populations and habitats: western Canada. In: Halls LK, editor. White-Tailed Deer: Ecology and Management. Washington, DC: The Wildlife Management Institution; 1984. pp. 475–486. [Google Scholar]
- Wolfe LL, Miller MW, Williams ES. Feasibility of “test-and-cull” for managing chronic wasting disease in urban mule deer. Wildlife Society Bulletin. 2004;32:500–505. [Google Scholar]
- Zar JH. Biostatistical Analysis. Upper Saddle River, NJ: Prentice Hall; 1999. [Google Scholar]