

Abstract
Introduction:
We aim to determine to what degree whole-slide images (WSI) can be compressed without impacting the ability of the pathologist to distinguish benign from malignant tissues. An underlying goal is to demonstrate the utility of a visual discrimination model (VDM) for predicting observer performance.
Materials and Methods:
A total of 100 regions of interest (ROIs) from a breast biopsy whole-slide images at five levels of JPEG 2000 compression (8:1, 16:1, 32:1, 64:1, and 128:1) plus the uncompressed version were shown to six pathologists to determine benign versus malignant status.
Results:
There was a significant decrease in performance as a function of compression ratio (F = 14.58, P < 0.0001). The visibility of compression artifacts in the test images was predicted using a VDM. Just-noticeable difference (JND) metrics were computed for each image, including the mean, median, ≥90th percentiles, and maximum values. For comparison, PSNR (peak signal-to-noise ratio) and Structural Similarity (SSIM) were also computed. Image distortion metrics were computed as a function of compression ratio and averaged across test images. All of the JND metrics were found to be highly correlated and differed primarily in magnitude. Both PSNR and SSIM decreased with bit rate, correctly reflecting a loss of image fidelity with increasing compression. Observer performance as measured by the Receiver Operating Characteristic area under the curve (ROC Az) was nearly constant up to a compression ratio of 32:1, then decreased significantly for 64:1 and 128:1 compression levels. The initial decline in Az occurred around a mean JND of 3, Minkowski JND of 4, and 99th percentile JND of 6.5.
Conclusion:
Whole-slide images may be compressible to relatively high levels before impacting WSI interpretation performance. The VDM metrics correlated well with artifact conspicuity and human performance.
Keywords: Compression, human visual system discrimination model, observer performance, pathology whole slide images
BACKGROUND
Despite a great deal of research and technological development in the past few years, there are still important technological issues that remain to be resolved regarding the practical clinical use of whole-slide images (WSI) in pathology.[1–7] One of the major challenges is the size of the digitized images. The image files are quite large affecting the transmission rates at which they are retrieved for display from a server or storage device, and the amount of storage space they occupy. The issue is complicated even further depending on the clinical task - some cases require only a low-resolution (40× objective) scan, while others require resolutions significantly higher (80× or 100× objective).[8] Some scanners create even larger images[9] (especially emerging scanners with z-axis capabilities[3] that create a series of images) and there is concern in the DICOM (Digital Imaging and Communications in Medicine) Pathology Working Group (WG-26) that DICOM cannot handle images larger than 64,000 pixels and 2 GB total size.[10] Compression is one way to deal with this massive amount of data, but it is difficult to define a single acceptable level of compression (hence image quality) for use across all clinical questions.[8,11]
There have been few rigorous studies of the effects of image compression on diagnostic performance with WSI slides. Most studies have been concerned either with the compression schemes[12–14] or with assessing the visibility of compression artifacts.[15,16] Our goal in a series of experiments has been to demonstrate the utility of the JPEG 2000 compression/decompression standard in telepathology so that other clinical specialties may utilize the resulting information and perhaps the methods to verify its utility in those applications. Another goal is to demonstrate utility of a visual discrimination model (VDM) for predicting observer performance. Our overriding hypothesis was that it is possible to improve the presentation of compressed telepathology images for accurate diagnoses by tailoring image compression schemes and displays based on information about the capabilities and limitations of the human visual system. This scenario primarily applies to static telepathology applications, but optimizing compression for real time and hybrid systems could be accomplished with the same techniques as well. To test this hypothesis, we have had two goals: (1) Measure the visibility of lossy compression artifacts and evaluate the utility of a VDM for predicting visually lossless compression levels with telepathology WSI slides; and (2) determine with human and model observers the point at which visible compression artifacts negatively impact interpretation and visual search performance with WSI slides.
In our first experiment,[16] bit rates corresponding to visually lossless JPEG 2000 compression were measured with human observers for image regions selected from pathology WSI slides. Observer performance in 2AFC (alternative forced choice) trials showed that compression ratios of about 7:1 or four times the reversible compression ratio could be achieved before losses were detectable. Significant differences in visually lossless bit rates and PSNR (point signal-to-noise ratio) were observed across test images due to normal variations in tissue structures, which affect image compressibility. VDM metrics computed for bit rates at the visually lossless thresholds were nearly constant, however, corresponding to equal JND visibility for compression losses. This uniformity suggests that a JND (just noticeable difference) target level corresponding to visually lossless compression could be applied to adaptively compress diverse images to different bit rates and different PSNR values and still achieve uniform image quality defined in terms of compression artifact visibility.
In the next study,[17] threshold likelihood functions for visually lossless JPEG 2000 compression were determined experimentally using the Bayesian adaptive QUEST psychometric procedure. Mean thresholds ranged from 8.5:1 to 21.1:1 for 20 test images with a mean of 12.9:1. The statistical significance of variations in threshold likelihood functions across test images was evaluated for various threshold metrics using a likelihood ratio chi-square test. The threshold metric showing the greatest uniformity across images (likelihood ratio chi-square P = 0.84 and ΔJND < 0.5) was the 99th percentile JND computed by the VDM. This result was likely due to a combination of image, encoder, and observer task characteristics, primarily the spatially nonuniform emergence at threshold of noticeable artifacts embedded in highly structured images with significant contrast/texture masking effects, and a discrimination task requiring visual search among distractors.
Although both of the previous studies determined at what level of compression artifacts were noticeable, neither of the studies directly examined the impact of compression on pathologists’ ability to render a diagnostic decision. In the present study, an ROC (Receiver Operating Characteristic) experiment was conducted to determine the effects of lossy JPEG 2000 compression on the discrimination of benign and malignant breast tissue in WSI slides. Simulations were performed to determine the correlation between human performance (area under the ROC curve, Az) and image distortion metrics derived from a model of human visual perception. The Siemens Visual Discrimination Model (VDM) was used to compute just-noticeable difference (JND) metrics for the ROC test images as a function of compression bit rate. The primary aim of this study was to establish the rate of compression at which discrimination performance decreases significantly and determine the corresponding image distortion visibility in terms of JNDs.
MATERIALS AND METHODS
A set of 100 (512 × 512 pixels) regions of interest (ROIs) were cropped by an experienced pathologist (not participating in the ROC study) from a set of breast biopsy WSI slides (acquired with the DMetrix scanner; DMetrix, Inc., Tucson, AZ, USA) (half benign, half malignant). All images were initially zoomed to the same level of magnification before cropping. They were then compressed using the Kakadu 6.0[18] implementation of JPEG 2000 to 6 levels (original uncompressed, 8:1, 16:1, 32:1, 64:1, and 128:1) and randomized to create a set of 600 test images. Six pathologists (three Board Certified pathologists; two Fellows; one senior level (PGY4) pathology resident) viewed each set of images on a Barco Coronis Fusion 6MP (Barco NV, Belgium) color display (maximum luminance 400 cd/m2). Their task was to determine whether each image was benign or malignant and report their confidence in that decision using a 6-point scale. They did not have access to the original glass slides. The results were analyzed using the MultiReader MultiCase (MRMC) ROC technique.[19]
The Siemens VDM simulates factors in the ocular and early cortical processing of luminance and chrominance stimuli by the human visual system.[20,21] Color images were transformed from RGB space to three opponent color channels: black-white (luminance), red-green, and blue-yellow.[22] Initial stages of the model account for the effects of the ocular modulation transfer function and luminance adaptation. The resulting image is processed by a 2D Fourier transform and filtered in the frequency domain by a set of biologically inspired spatial frequency- and orientation-tuned channels using bandpass log-Gabor filters.[23] Local band-limited contrast[24] is computed by dividing the output of each bandpass channel by the output of a low-pass, isotropic Gaussian filter applied to the image. Channel contrasts are then normalized to 1 JND at the detection threshold using a contrast sensitivity function that depends on spatial frequency and luminance.[25] Contrast discrimination sensitivity at suprathreshold (JND>1) contrast levels and interactions between channels are modeled by a combination of nonlinear excitatory and inhibitory (divisive suppression) factors associated with contrast or texture masking.[26] In the final stage, channel JND maps are max-pooled over orientation and frequency at each pixel. Summary JND metrics can then be evaluated by spatial pooling across pixels, typically by computing the mean, a histogram percentile, or Minkowski summation[24] with an exponent of 4. Metrics can be computed across an entire image or within regions or frequency/orientation channels containing specific features of interest. When applied to a pair of uncompressed and compressed images, the VDM generates objective measures of the visibility of compression artifacts in perceptually linear JND units.
VDM simulations were performed by pairing each of the 100 uncompressed images selected for the ROC experiment with the same image after lossy JPEG 2000 compression. We used the Kakadu 6.0 implementation of JPEG 2000 with rate control based on mean squared error (MSE) minimization. Images were compressed to the five ratios used in the ROC study: 8:1, 16:1, 32:1, 64:1, and 128:1. JND metrics were computed for each compressed image and then averaged for the 100 images at each compression ratio. Metrics included the mean, median, Minkowski-pooled, 90th, 95th, and 99th percentiles, and maximum JND. Two additional error metrics were computed for comparison: peak signal-to-noise ratio (PSNR) and structural similarity (SSIM).[27] Rate-distortion plots were generated with values of each metric as a function of compression rate in bits per pixel. Parametric functions from the image compression literature were fit to the rate-distortion data using a least-squares error criterion. A log-linear function (Equation 1) with three parameters,
d(r) = a1log(r) + a2r + a3w (1)
was fit to the JND metrics and PSNR.
A five-parameter logistic function (Equation 2),
d(r) = a1{0.5-[1+exp(a2(r-a3))]-1} + a4r + a5 (2)
was fit to the SSIM metrics.
RESULTS
Three Board Certified pathologists (27, 39, 5 years), 2 fellows (Board certified 1 year), and 1 senior level (PGY4) pathology resident served as readers. There were three males (average age = 52.33, sd = 15.62, range = 31–68) and three females (average age = 33.33, sd = 2.05, range = 31--36). Four of the six readers wore corrective lenses and on average their last eye examination was 34.17 months ago (sd = 39.76, range = 1–120 months). Five of the six readers had been reading WSI slides for 3–5 years, and one for more than 10 years; with two having read 1–100, one having read 101–500, one having read 501–1000, one having read 1001–5000, and one having read 5001–10,000.
In the human study, there was a significant decrease in performance as a function of compression level (F = 14.58, P< 0.0001) even though performance at each level was high (1:1 mean Az = 0.959; 1:8 mean Az = 0.960; 1:16 mean Az = 0.959; 1:32 mean Az = 0.957; 1:64 mean Az = 0.937; 1:128 mean Az = 0.877). Post hoc analyses revealed that performance at 64:1 and 128:1 was significantly lower than at the lower compression levels. Figure 1 shows the same image in the original uncompressed state (left), compressed to 16:1 (center, does not affect performance), and compressed to 64:1 (right, starts to impact performance). There were no significant differences between the experienced Board Certified pathologists, fellows, and the resident in terms of where diagnostic performance decreased as a function of compression level.
Figure 1.

Example of an image ROI at the original uncompressed level (left), compressed to 16:1 (center) and compressed to 64:1 (right)
Rate-distortion data are presented in Figures 2 and 3. Three representative JND metrics – mean, Minkowski-pooled, and 99th percentile – spanning a wide range of values are plotted in Figure 2. As expected, JNDs increased with decreasing bit rate, corresponding to higher compression ratios. Mean and Minkowski JNDs have been shown in previous studies to be well correlated with human task performance.[7] The 99th percentile JND was found to be the best predictor of bit rates for visually lossless compression in a previously conducted observer performance experiment.[7] All of the JND metrics in the present study were found to be highly correlated and differed primarily in magnitude. Both PSNR and SSIM decreased with bit rate [Figure 3] correctly reflecting a loss of image fidelity with increasing compression.
Figure 2.
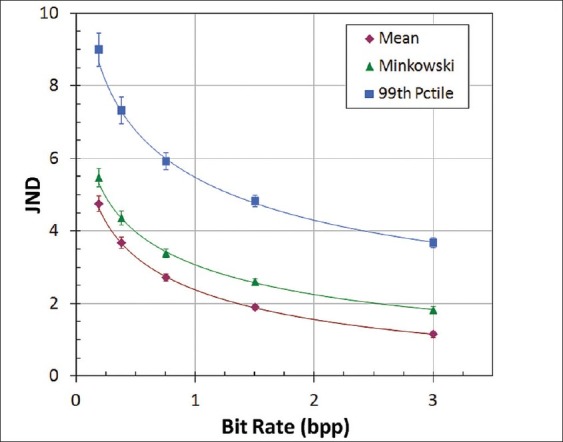
JND metrics as a function of compression bit rate, averaged for 100 test images. Error bars show the standard deviation
Figure 3.
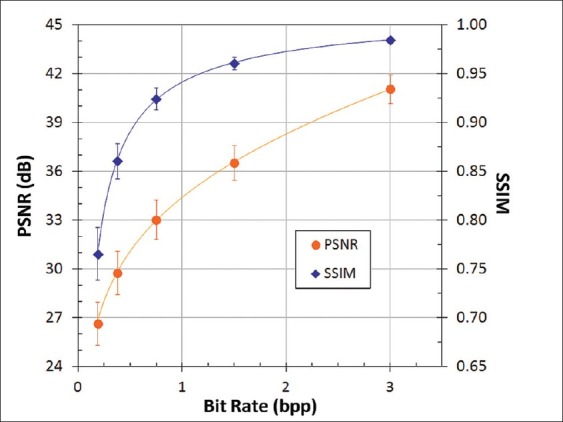
PSNR and SSIM as a function of compression bit rate, averaged for 100 test images. Error bars show the standard deviation
The correlation of observer performance in the ROC experiment with image distortion metrics is shown in Figures 4–6. Observer performance (Az) was nearly constant up to a compression ratio of 32:1, and then decreased significantly for 64:1 and 128:1 compression. The initial decline in Az occurred around a mean JND of 3, Minkowski JND of 4, and 99th percentile JND of 6.5 [Figure 4]. JND values can be interpreted by their correspondence to observer performance in a 2AFC detection or discrimination task:
Figure 4.
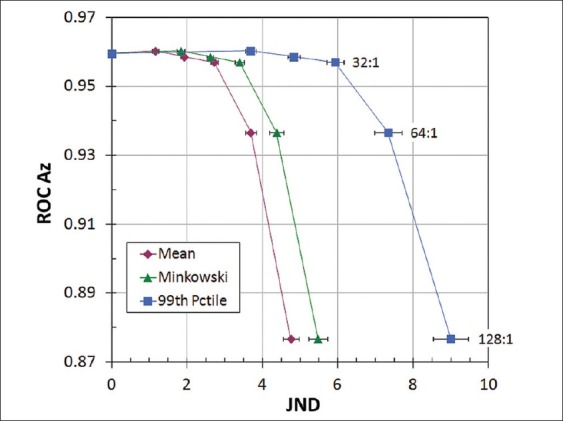
Correlation between ROC observer performance and JND metrics, averaged for 100 test images at each compression rati
Figure 6.
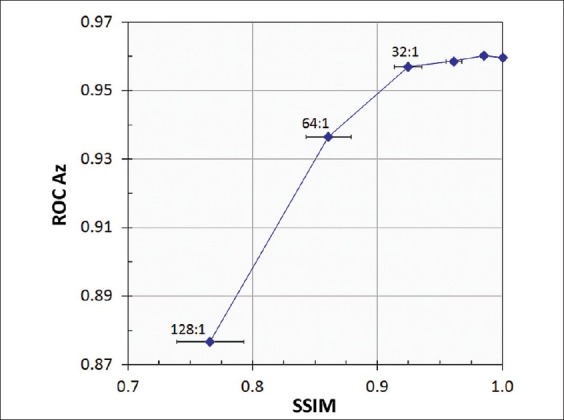
Correlation between ROC observer performance and SSIM, averaged for 100 test images at each compression ratio. Error bars show the standard deviations
JND: 75% correct - barely detectable
JND: 94% correct - evident but sometimes missed
JND: 98% correct - conspicuous, rarely missed.
A mean value of 3 JND corresponds to compression losses that are readily visible in side-by-side comparisons with uncompressed images. This interpretation is consistent with our observation that images compressed by 64:1 had conspicuous artifacts (primarily blurring) over much of the image area, while the distortions at 32:1 were evident but generally more subtle and localized. The decrease in Az between 32:1 and 64:1 compression corresponded to PSNR of about 32 dB and SSIM near 0.90 [Figures 5 and 6]. Unlike JNDs, however, there is no established correspondence of these metrics with artifact conspicuity or detection task performance.
Figure 5.
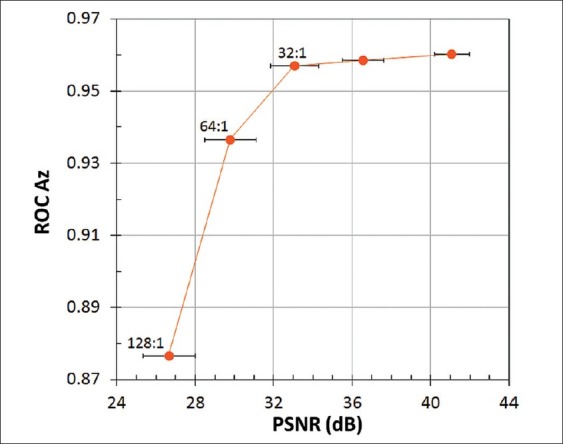
Correlation between ROC observer performance and PSNR, averaged for 100 test images at each compression ratio. Error bars show the standard deviations
CONCLUSIONS
The previous observer performance study[7] established the superior utility of high-percentile JNDs for predicting variable compression bit rates corresponding to visually lossless compression. The predictive value of the 99th percentile JND was significantly better for that purpose than compression ratio, PSNR, SSIM, or lower JND metrics. A similar comparison of metrics is not possible for the current ROC study, however, because the Az values and distortion metrics are averaged over 100 test images to produce a single value for each compression ratio. If the ROC experiment were repeated with different sets of test images, ideally with different structural characteristics affecting their compressibility and different compression ratios at which a significant decline in discrimination performance occurs, we could hypothesize greater consistency in JND metric values at that performance threshold compared to PSNR, SSIM, or other nonperceptual metrics. If this hypothesis were confirmed, it would establish the greater utility of a perceptual metric over compression ratio or other metrics for maximizing the compression of individual images or WSI slide regions without sacrificing interpretation accuracy.
Although discrimination performance was quite high with all levels of compression, there was a steady and ultimately statistically significant drop in performance at the 64:1 compression level. What was interesting and somewhat surprising was the fact that the presence of compression artifacts did not impact discrimination at lower levels of compression. It was encouraging that there were no significant differences between the experienced Board Certified pathologists, Fellows and the resident in terms of where performance decreased as a function of compression level. However, it should be noted that the task used in this study was only one of discriminating benign vs malignant status, and the overall pathologic interpretation task is much more complex. It is quite likely that more significant differences would have been observed between the Board Certified pathologists and the Fellows and residents if we had evaluated performance in a more complex task.
These results combined with the VDM results suggest that it may be possible to compress regions of diagnostically relevant tissue in breast biopsy virtual slides to at least 32:1 before impacting diagnosis.. The potential for compressing entire virtual slides using scalable, region-of-interest methods, such as JPEG 2000, is much greater due to the large fraction of the total area that typically consists of irrelevant tissue and air. The actual benefit of adaptive, ROI compression is likely to be much higher. Given the very high levels of performance the question is whether higher levels of compression could be achieved before impacting performance clinically. Further study is obviously required, especially using the entire image rather than select ROIs as well as asking readers to provide a complete diagnosis rather than just a discrimination of benign vs malignant, but an earlier study we conducted suggested that higher levels might be appropriate depending on the image content. In the future we will be testing higher levels of compression and their impact on observer performance.
One limitation of our study is that it is based solely on breast tissue evaluation. Breast tissue has a range of proliferative patterns ranging from clearly benign to conclusively malignant. Based on this spectrum, even minor compression artifacts make it difficult to reach a definitive diagnosis. In future, it may be worthwhile to consider carrying out the study with images having fewer nuances of diagnostic patterns (e.g., a moderately to well-differentiated squamous cell carcinoma). More overtly malignant cell features seen in these tumors may be perceptible despite compression artifact. Likewise, in evaluating tissue invasion by squamous cell carcinoma, the diagnostic pattern may continue to be recognizable despite image degradation by compression. As already noted previously, another limitation is the use of select ROIs rather than the entire image, and the limited task of discriminating benign from malignant rather than addressing the complete interpretation task.
ACKNOWLEDGMENTS
This work was supported in part by NIH/NIBIB grant R01 EB008055.
Footnotes
Available FREE in open access from: http://www.jpathinformatics.org/text.asp?2012/3/1/17/95129
REFERENCES
- 1.Weinstein RS, Graham AR, Richter LC, Barker GP, Krupinski EA, Lopez AM, et al. Overview of telepathology, virtual microscopy, and whole slide imaging: prospects for the future. Hum Pathol. 2009;40:1057–69. doi: 10.1016/j.humpath.2009.04.006. [DOI] [PubMed] [Google Scholar]
- 2.Williams S, Henricks WH, Becich MJ, Toscano M, Carter AB. Telepathology for patient care: What am I getting myself into? Adv Anat Pathol. 2010;17:130–49. doi: 10.1097/PAP.0b013e3181cfb788. [DOI] [PubMed] [Google Scholar]
- 3.Pantanowitz L, Valenstein PN, Evans AJ, Kaplan KJ, Pfeifer JD, Wilbur DC, et al. Review of the current state of whole slide imaging in pathology. J Pathol Inform. 2011;2:36. doi: 10.4103/2153-3539.83746. [DOI] [PMC free article] [PubMed] [Google Scholar]
- 4.Gabril MY, Yousef GM. Informatics for practicing anatomical pathologists: marking a new era in pathology practice. Mod Pathol. 2010;23:349–58. doi: 10.1038/modpathol.2009.190. [DOI] [PubMed] [Google Scholar]
- 5.Rocha R, Vassallo J, Soares F, Miller K, Gobbi H. Digital slides: present status of a tool for consultation, teaching, and quality control in pathology. Pathol Res Pract. 2009;205:735–41. doi: 10.1016/j.prp.2009.05.004. [DOI] [PubMed] [Google Scholar]
- 6.Daniel C, Rojo MG, Klossa J, Della Mea V, Booker D, Beckwith BA, et al. Standardizing the use of whole slide images in digital pathology. Comput Med Imaging Graph. 2011;35:496–505. doi: 10.1016/j.compmedimag.2010.12.004. [DOI] [PubMed] [Google Scholar]
- 7.Wilbur DC, Madi K, Colvin RB, Duncan LM, Faquin WC, Ferry JA, et al. Whole-slide imaging digital pathology as a platform for teleconsultation: a pilot study using paired subspecialist correlations. Arch Pathol Lab Med. 2009;133:1949–53. doi: 10.1043/1543-2165-133.12.1949. [DOI] [PMC free article] [PubMed] [Google Scholar]
- 8.Weinstein RS, Descour MR, Liang C, Barker G, Scott KM, Richter L, et al. An array microscope for ultrarapid virtual slide processing and telepathology.Design, fabrication, and validation study. Hum Pathol. 2004;35:1303–14. doi: 10.1016/j.humpath.2004.09.002. [DOI] [PubMed] [Google Scholar]
- 9.Rojo MG, Garcia GB, Mateos CP, Garcia JG, Vicente MC. Critical comparison of 31 commercially available digital slide systems in pathology. Int J Surg Path. 2006;14:285–305. doi: 10.1177/1066896906292274. [DOI] [PubMed] [Google Scholar]
- 10.DICOM WG-26 Pathology. [Last accessed on 2011 Dec 30]. Available from: http://www.conganat.org/digital/index.htm .
- 11.Yagi Y, Gilberson JR. Digital imaging in pathology: the case for standardization. J Telemed Telecare. 2005;11:109–16. doi: 10.1258/1357633053688705. [DOI] [PubMed] [Google Scholar]
- 12.Tuominen VJ, Isola J. Linking whole-slide microscope images with DICOM by using JPEG2000 interactive protocol. J Digit Imaging. 2010;23:454–62. doi: 10.1007/s10278-009-9200-1. [DOI] [PMC free article] [PubMed] [Google Scholar]
- 13.Huisman A, Looijen A, van den Brink SM, van Diest PJ. Creation of a fully digital pathology slide archive by high-volume tissue slide scanning. Hum Pathol. 2010;41:751–7. doi: 10.1016/j.humpath.2009.08.026. [DOI] [PubMed] [Google Scholar]
- 14.Hedvat CV. Digital microscopy: past, present, and future. Arch Pathol Lab Med. 2010;134:1666–70. doi: 10.5858/2009-0579-RAR1.1. [DOI] [PubMed] [Google Scholar]
- 15.McCleary D, Diamond J, Crookes D, Grabsch H, Hamilton PW. Compression in virtual microscopy: how low can you go? J Pathol. 2009;217(S1):S13. [Google Scholar]
- 16.Johnson JP, Krupinski EA, Nafziger JS, Yan M, Roehrig H. Visually lossless compression of breast biopsy virtual slides for telepathology. Proc SPIE Med Imag. 2009;7236N-1:7236N-10. [Google Scholar]
- 17.Johnson JP, Krupinski EA, Yan M, Roehrig H, Graham AR, Weinstein RS. Using a visual discrimination model for the detection of compression artifacts in virtual pathology images. IEEE Trans Med Imaging. 2011;30:306–14. doi: 10.1109/TMI.2010.2077308. [DOI] [PMC free article] [PubMed] [Google Scholar]
- 18.Kakadu JPEG. 2000. [Last accessed on 2012 Jan 30]. Available from: http://www.kakadusoftware.com .
- 19.Dorfman DD, Berbaum KS, Metz CE. Receiver operating characteristic rating analysis: Generalization to the population of readers and patients with the jackknife method. Invest Radiol. 1992;27:723–31. [PubMed] [Google Scholar]
- 20.Lubin J. A visual discrimination model for imaging system design and evaluation. In: Peli E, editor. Visual Models for Target Detection and Recognition. Singapore: World Scientific Publishers; 1995. pp. 245–83. [Google Scholar]
- 21.Daly S. The visual differences predictor: an algorithm for the assessment of image fidelity. In: Watson A, editor. Digital Images and Human Vision. Cambridge: MIT Press; 1993. pp. 179–206. [Google Scholar]
- 22.Hunt RG. The Reproduction of Colour. West Sussez: Wiley and Sons; 2004. [Google Scholar]
- 23.Field DJ. Relations between the statistics of natural images and the response properties of cortical cells. J Opt Soc Am A. 1987;4:2379–94. doi: 10.1364/josaa.4.002379. [DOI] [PubMed] [Google Scholar]
- 24.Peli E. Contrast in complex images. J Opt Soc Am A. 1990;7:2032–40. doi: 10.1364/josaa.7.002032. [DOI] [PubMed] [Google Scholar]
- 25.Barten PG. Contrast sensitivity of the human eye and its effects on image quality. Bellingham, WA: SPIE Press; 1999. pp. 27–60. [Google Scholar]
- 26.Foley JM. Human luminance pattern-vision mechanisms: masking experiments require a new model. J Opt Soc Am A Opt Image Sci Vis. 1994;11:1710–9. doi: 10.1364/josaa.11.001710. [DOI] [PubMed] [Google Scholar]
- 27.Wang Z, Bovik AC, Sheikh HR, Simoncelli EP. Image quality assessment: from error visibility to structural similarity. IEEE Trans Image Process. 2004;13:600–12. doi: 10.1109/tip.2003.819861. [DOI] [PubMed] [Google Scholar]