

Abstract
The extent to which histopathology pattern recognition image analysis (PRIA) agrees with microscopic assessment has not been established. Thus, a commercial PRIA platform was evaluated in two applications using whole-slide images. Substantial agreement, lacking significant constant or proportional errors, between PRIA and manual morphometric image segmentation was obtained for pulmonary metastatic cancer areas (Passing/Bablok regression). Bland-Altman analysis indicated heteroscedastic measurements and tendency toward increasing variance with increasing tumor burden, but no significant trend in mean bias. The average between-methods percent tumor content difference was -0.64. Analysis of between-methods measurement differences relative to the percent tumor magnitude revealed that method disagreement had an impact primarily in the smallest measurements (tumor burden <3%). Regression-based 95% limits of agreement indicated substantial agreement for method interchangeability. Repeated measures revealed concordance correlation of >0.988, indicating high reproducibility for both methods, yet PRIA reproducibility was superior (C.V.: PRIA = 7.4, manual = 17.1). Evaluation of PRIA on morphologically complex teratomas led to diagnostic agreement with pathologist assessments of pluripotency on subsets of teratomas. Accommodation of the diversity of teratoma histologic features frequently resulted in detrimental trade-offs, increasing PRIA error elsewhere in images. PRIA error was nonrandom and influenced by variations in histomorphology. File-size limitations encountered while training algorithms and consequences of spectral image processing dominance contributed to diagnostic inaccuracies experienced for some teratomas. PRIA appeared better suited for tissues with limited phenotypic diversity. Technical improvements may enhance diagnostic agreement, and consistent pathologist input will benefit further development and application of PRIA.
Keywords: Artificial intelligence, computer-assisted diagnosis, digital pathology, medical informatics applications, stem cell pluripotency, whole-slide imaging
INTRODUCTION
Whole-slide digital imaging is transforming pathology diagnosis, consultation, education, and investigation.[1,2] This technology permits an entire histological slide to be optically scanned into a digitized image data file that can be evaluated on a computer monitor in a manner similar to microscopic examination.[2,3] In addition, morphometric image analysis tools, supported within digital slide imaging platforms, are accelerating the transition of pathology into a more quantitative science.[1,4]
Pattern recognition image analysis (PRIA) software represents a further technological advancement that provides automated identification and quantification of regions of interest within digitized histological images.[5,6] Most histological PRIA software packages require users to define and provide representative examples of each tissue class of interest from a set of training slides. Subsequently, the software applies an iterative training process to identify unique spatial-spectral features that discriminate image pixels for each tissue class. The resulting algorithm can then be run on study sets, as unknowns, in order to segment relevant image pixels.[5,7–9] Although most PRIA software packages use conceptually similar workflows, they differ in their user interface, training speed, whole slide vs. focal region of interest analyses, and size of training sets.[3] Currently, Aperio Technologies, Cambridge Research and Instrumentation, Definiens, and Visiopharm all market histologic PRIA software. Features of some commercially available PRIA software packages were recently reviewed.[3]
A variety of image analysis tools useful for identification and quantification of histologic features,[1,3,7,9,10] quantification of immunohistochemistry (IHC) labeling,[3,8,11] and tissue microarray construction[12,13] have been reported. Considerable interest in applying quantitative image analysis to IHC has been stimulated with the advent of US Food and Drug Administration approvals for quantifying HER2, estrogen receptor, and progesterone receptor expression in breast cancer patient biopsies.[11,14] [http://www.accessdata.fda.gov/cdrh_docs/pdf7/K073677.pdf]. Many emerging automated image analysis solutions quantify target protein expression by measuring immunhistochemical labeling within the nucleus, cytoplasm, and/or the plasma membrane, as well as provide applications for scoring tissue microarray slides.[8,11,15] Such approaches can minimize subjectivity inherent in traditional visual assessments of IHC, which typically employ 0, 1+, 2+, 3+ subjective scoring of the percentage and intensity of immunolabeling. Histological PRIA automates the detection, localization, and quantification of IHC-identified molecular events by coupling PRIA with follow-on analyses for detecting colorimetric IHC reactions that indicate specific protein localization.[6,11]
PRIA software provides the potential to develop algorithms that improve throughput screening of large numbers of histological images, such as those used in investigative and toxicological pathology studies.[1,4] Furthermore, conducting PRIA using morphological parameters has the potential to minimize subjective biases introduced when evaluations are carried out by multiple pathologists.[6,9] Considerable technical advancement is anticipated in this discipline;[3] however, the capability for current PRIA applications to serve as surrogates for expert visual histopathological assessments is not universally accepted, based upon the few published evaluations of commercially available PRIA software programs.[1] Despite the plausible advantages projected, expert interpretation and analysis of PRIA data output remain necessary in order to assure accuracy in image segmentation and quantification.[9] Therefore, further appraisals of computer-assisted PRIA software to validate the benefits and to identify current challenges would be informative. Consequently, we undertook a systematic assessment of the workflow and image segmentation output using a leading, commercially available, automated PRIA platform to assess the applicability of PRIA, specifically keying upon morphological features in whole-slide digital images. Evaluations included direct comparisons of the automated PRIA software application to (1) pulmonary metastatic cancer area measurements derived by manual image segmentation using equivalence, repeated measures, and limits of agreement statistical analyses, and to (2) expert visual assessments of PRIA algorithm performance on a collection of exceedingly morphologically complex, stem cell-derived teratomas.
ASSESSMENT OF SOFTWARE APPLICABILITY AND DIAGNOSTIC AGREEMENT
Digital Scanning and Algorithm Development
A PRIA software evaluation was initiated using Genie histology pattern recognition software (Genie Pro version, Aperio Technologies, Inc., Vista, California), in combination with an integrated whole-slide imaging platform used world-wide (ScanScope XT and Spectrum database (Aperio)). Early versions of PRIA software were developed for automated analyses of multispectral satellite image data used in geospatial feature extraction (Genetic Imagery Exploitation (GENie)) (http://genie.lanl.gov/).[5] In Genie, Los Alamos National Laboratories has developed a prototypic hybrid pattern recognition software incorporating evolutionary computational techniques with more traditional supervised classification methods.[5] This software technology was subsequently adapted to permit automated extraction of a range of features from color (RGB) images of histologic specimens. Genie has an interactive interface, through which users input histological features of interest for training analysis algorithms. In the course of training, the algorithms become refined during evolutionary computational learning, which involves a process of parallel competitive selection and reproduction among multiple training examples. This optimization process, known as a genetic algorithm, produces a best fit “population” of selected histological features for output analyses. Genie algorithms predominantly extract multispectral information from images with additional image processing performed by spatial, logical, and thresholding operators. Pixel-by-pixel spatial (morphological) processing operators that are part of the PRIA software are restricted to a predefined set of programmed primitive shapes (e.g., square, circle, diamond, cross, and lines).[5] Genie permits quantitative image analysis of morphological tissue features in selected regions as well as an entire slide.
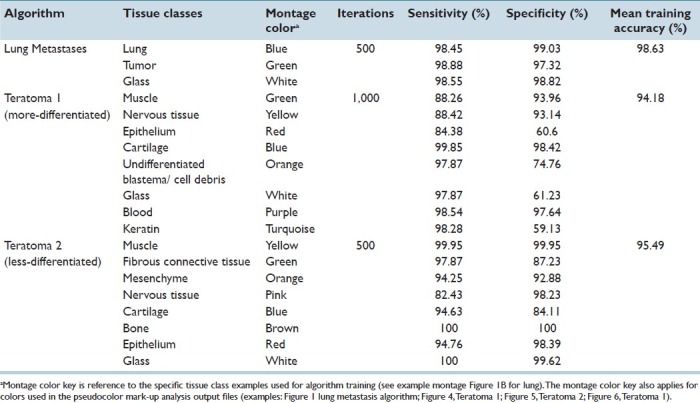
Strengths and limitations of this PRIA technology were assessed in specific applications. Histology tissue section image acquisition and Genie PRIA algorithm development were undertaken similar to previous studies.[8,9] Briefly, hematoxylin and eosin stained tissue sections mounted on glass slides were digitally scanned at 20× magnification using a ScanScope XT digital slide scanner (Aperio) to create whole-slide planar image data files at 0.5 μm/pixel resolution [Figure 1a]. Image files were stored in Spectrum Image Management System and viewed using ImageScope software (Aperio). Representative areas of each tissue class of interest were identified in training slides, based upon their histological features, and compiled in a digital montage at 5× magnification [Figure 1b]. The software then applied an iterative learning process, using a minimum of 500 iterations, to identify unique spatial-spectral features to discriminate each tissue class [Table 1]. Montages were subsequently examined independently by the software to determine sensitivities and specificities for the detection of each tissue class [Table 1]. This training process was repeated for all algorithms, taking roughly between 2 and 4 hours for the metastasis algorithm and requiring up to 8 hours to develop teratoma algorithms. PRIA of unknown testing slides averaged approximately 40 minutes per slide, but this phase is automated and could be performed overnight or while other tasks were being accomplished.
Figure 1.
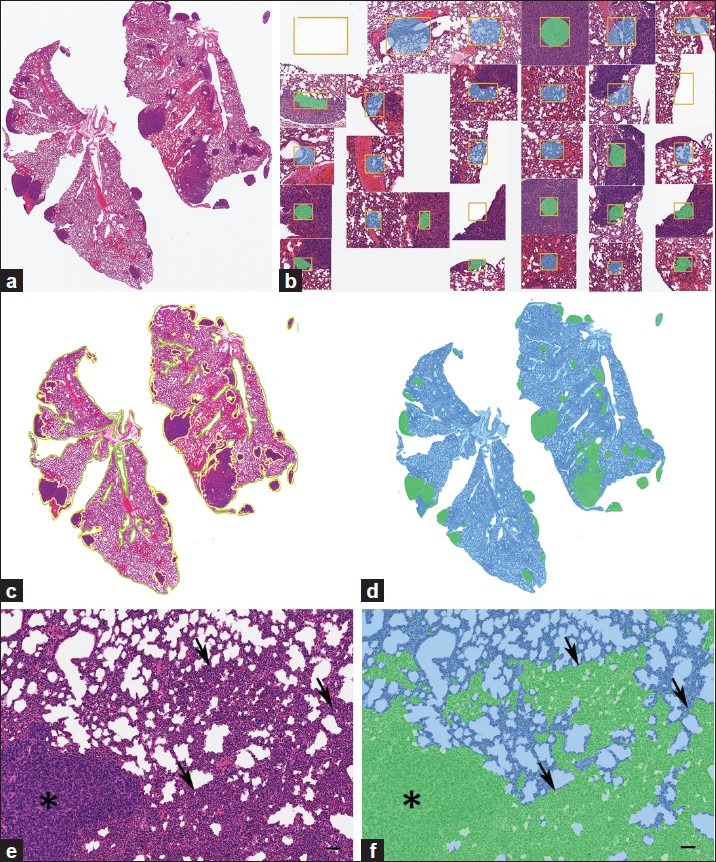
Quantifying metastatic mammary cancer in mouse lungs. (a) Representative metastatic mammary tumors. (b) Features used to train PRIA algorithm [Table 1]. (c) Manual segmentation performed using the image in (a). Area outlines in green (lung) and yellow (tumor). (d) Image mark-up of (a) following PRIA illustrates lung segmented as blue and metastatic tumor as green. (e) Detail of poorly differentiated tumor (*) and areas of pulmonary atelectasis (arrows). (f) Note, PRIA incorrectly segmented (e). Pulmonary atelectasis (arrows) segmented as false positive for tumor, green. Bar=50 μm
Table 1.
PRIA algorithms and their accuracy in analyses of pulmonary metastatic tumors and stem cell teratomas
Comparison of PRIA to Manual Morphometric Analysis
Tumor burden area measurements derived using automated PRIA were compared to those obtained by manual segmentation of the same digitized histologic images of mouse lung containing metastatic mammary carcinoma. Lungs from 39 mice were fixed by airway insufflation with formalin at the time of collection. They were paraffin embedded, sectioned at approximately 5 μm thickness, mounted on glass microscope slides, and stained with hematoxylin and eosin. Lung tissue sections included complete right and left lung sections (dorsal (coronal) plane orientation sections) [Figure 1a] (provided by Dr. Lalage Wakefield, National Cancer Institute, Bethesda, MD). In order to focus on the pulmonary parenchymal tumor burden, mediastinal tissues including thymus, lymph nodes, trachea, bronchi, esophagus, adipose tissue, and mediastinal metastases were excluded from both manual and automated analyses. To obtain manual morphometric measurements of tumor burden area, total pulmonary tissue areas and tumor areas were manually outlined using drawing tools in ImageScope software [Figure 1c]. Manual image segmentation for lung metastasis required approximately 30-90 minutes of continuous effort per slide, in contrast to the less labor-intensive measurements obtained using PRIA. Tissue classes used to create a PRIA algorithm for quantifying lung metastases included multiple examples of normal lung, tumor, and background (glass) from five training slides [Figure 1b]. The mean training accuracy of the algorithm was >98% [Table 1]. Following creation of the PRIA algorithm, the 39 lung section images were analyzed by Genie as unknowns (testing set) [Figure 1d]. Both manual and automated analyses were performed on the same digital images. Tumor area measurements were repeated manually by a second investigator and repeated for PRIA by developing a second metastasis algorithm to determine the reproducibility of each method.
The PRIA algorithm was able to differentiate metastatic carcinoma and lung in all tissue sections. Automated PRIA software outputs included total analysis areas (mm2) and percentages of each tissue class in analysis areas. Pseudo-color mark-up images were provided for all specimens within the testing set as part of the software workflow [Figure 1d]. These allowed for assessment of the degree to which the PRIA algorithm correctly recognized and segmented histologic features in each slide. A pathologist visually evaluated the mark-up images to ensure acceptable image segmentation as a quality assurance step. This served as an opportunity to accept the accuracy of the algorithm or judge the necessity for algorithm refinement. If necessary, refinements typically entailed providing alternative examples of each training class followed by further computational iterations, thereby creating a new algorithm. In our experience, development of PRIA algorithms must balance the sensitivities and specificities for segmenting each tissue class in order to provide suitable degrees of accuracy while minimizing major discrepancies in image segmentation. In this study, less accurate image segmentation occurred due to the presence of tangentially oblique sections of some bronchioles and focal areas of pulmonary atelectasis, which were falsely identified as tumor. These minor errors were present in the analyses of all 39 images of histologic sections and were consistent with similar studies employing well-defined algorithms.[9,16] We accepted these minor segmentation errors as background context. Occasionally, despite having a broadly valid algorithm, PRIA segmentation of a few individual specimens warranted further scrutiny (outliers discussed below).
Comparing new assay methods to a standard approach is frequently used to determine if the new method is advantageous and can replace the older test.[17] PRIA-derived measurements were compared to manually acquired measurements of lung and tumor areas. Method comparison was performed with Passing and Bablok nonparametric regression analysis[18] and Bland and Altman bias plots followed by calculation of uniform and regression-based 95% limits of agreement of the measurement difference.[17,19] Passing and Bablok regression is a nonparametric model, which allows measurement error (imprecision) in both methods, does not require the measurement error to be normally distributed, and is insensitive to outliers. The Bland-Altman analysis estimates how much two methods differ in the quantitative measurement and therefore aids in making the decision if one method can be substituted for another. In addition, the association between the difference and the magnitude of the measurements was examined by standard regression analysis of the difference between the two methods on their average (constant bias test), and the regression of absolute residuals from the difference against average regression (constant variance test). Reproducibility of measurements was analyzed with the concordance correlation coefficient (CCC)[20] and the coefficient of variation[21] using duplicate measurements obtained from each method. Analyses were done with MedCalc (MedCalc Software, Mariakerke, Belgium, version 11.5.1.0) and R programming language (version 2.13.0).
During the comparison of automated PRIA to manual image segmentation, manual measurements were considered the accepted values, since this approach has been an established morphometric data acquisition technique prior to introduction of PRIA. The range and mean percent tumor in lungs, calculated as areatumor/ (areatumor+ areatumor-freelungs), acquired by both methods are illustrated in Table 2. The PRIA and manual measurements were graphed in a scatter plot with the 45° line of identity and the Passing and Bablok regression line added to investigate possible systematic errors (constant and/or proportional) between the two methods [Figure 2a].[19] The regression analysis showed substantial agreement of both slope and intercept with the target values of 1 and 0 within the 95% confidence intervals (C.I.) (slope = 0.9744 [C.I. = 0.9154, 1.0256], intercept = -0.1508 [C.I. = -0.3920, 0.0600]). Moreover, the cumulative sum test for linearity showed no significant deviation from linearity (P>0.10), validating the linear regression approach for comparison of these two methods. Based on the scatter plot, three outlier values, which had been previously noted to have substantial PRIA segmentation errors during the quality assurance pathology review, were also revealed [Figure 2a]. In one specimen, areas of pulmonary atelectasis were incorrectly segmented as a tumor (false positive) [Figures 1e and f]. In the second specimen, the metastatic tumor exhibited varying degrees of cellular degeneration, which resulted in lesions being incorrectly segmented as lung (false negative, data not shown). Because the third specimen identified as an outlier had minimal metastatic tumor burden, the segmentation inaccuracies resulting from tangentially oblique-sectioned bronchioles and areas of pulmonary atelectasis were proportionally greater in this specimen. These circumstances are commonplace in tissues and inherent in tissue collection/processing and/or pathologic processes. Algorithms need to be capable of being optimized to compensate for such inherent features, if PRIA is to be widely suitable for tissue screening and automated decision making support.
Table 2.
Percent tumor area quantified within 39 mouse lungs using PRIA and manual image segmentation
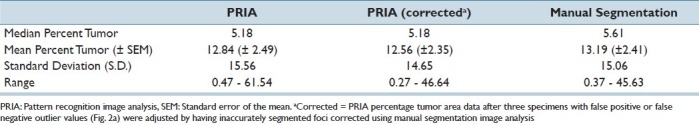
Figure 2.

Method comparisons of the percent metastatic tumor area in mouse lungs. Passing/Bablok regression depicting manual image segmentation (X-axis) and PRIA (Y-axis). (a) Data are plotted along a line of identity (solid blue line). Dotted lines indicate 95% C.I. Data points identified as outliers due to PRIA segmentation inaccuracies are highlighted in red. (b) All data were replotted after correction of outliers [Table 2 and text]. In both analyses, a regression line of best fit for PRIA vs. manual segmentation (solid black line) was not significantly different from the line of identity (P>0.1)
The potential effect of these three outlier values was evaluated further by using the manual image segmentation tool to separately quantify histological features erroneously mapped by PRIA. Area measurements corresponding to these inaccuracies identified on PRIA mark-up image file outputs were then used in calculating corrected automated PRIA area measurements [Table 2]. The Passing and Bablok regression analysis similarly demonstrated no significant constant (intercept = -0.1553 [C.I. = -0.3869, 0.03793]) or proportional (slope = 0.9757 [C.I. = 0.9216, 1.0233]) error between the methods, following corrections of outliers [Figure 2b]. In addition, the linear relationship between manual and PRIA measurements was similarly confirmed by the cumulative sum of linearity test (P>0.10). Therefore PRIA segmentation errors identified in this testing set appeared to have relatively little effect on the overall study population's association between manual and automated methodologies, or between the original and corrected PRIA [Table 2]. Finally, the plots suggested the degree of agreement may be slightly less in specimens with larger percentage tumor burden area, as these data points deviated from the line of identity to a greater extent than did specimens with relatively less tumor burden [Figure 2]. Planned analyses using the difference plot approach of Bland and Altman,[17] informative for comparing the extent of agreement between two methods, provided a subsequent means to examine this issue further.
Based upon the fact that different methods are unlikely to agree exactly regardless of the assays being compared,[17] and measurements remain imperfect despite the morphometric method used, true values for percentage tumor burden, calculated as areas of lung occupied by tumor for this study, remain unknown. Therefore, we chose to undertake further data analysis using the mean percent tumor areas of both the corrected PRIA and manual image analyses as the best estimate of the true value for each specimen.[17] Consequently, the difference between PRIA and manually acquired tumor burden areas was plotted against the mean of the two methods to assess the bias and limits of agreement [Figure 3a]. In the Bland-Altman method, the mean difference is an estimate of the bias, and the limits of agreement are the interval within which the difference between two measurements will lie with a probability of 95%. The average difference between the PRIA and manual methods was -0.64 and the limits of agreement (bias +/-1.96 standard deviation) included zero (-4.59, 3.31) as well as the majority of the measurement differences (36 out of 39 or 92%). Regardless, based upon the distribution of the differences [Figure 3a], the uniform 95% limits of agreement are not adequate estimates of the limits of agreement since heteroscedasticity appears to be present in the data. The limits of agreement ranges are clearly too wide for the measurements of smaller magnitude and possibly too narrow for the larger ones. Therefore, the assumption of constant mean and variance of the differences between the PRIA and manual method was formally tested. A zero slope of the regression of the absolute difference against the average of the two measurements confirmed no proportional bias between the two methods (slope = -0.03 ± 0.02, P = 0.21) [Figure 3a]. However, significant deviation from the zero slope of the regression of the absolute residuals, on average, evidenced dependence of the measurement variance on the measurement magnitude (slope = 0.07 ± 0.01, P < 0.001). We used the relationship of the absolute residuals to construct the 95% proportional limits of agreement,[19] where the lower limit = -0.85-0.2*Average and the upper limit = 0.29+0.14*Average. As shown in Figure 3a, improved method comparability was revealed, with 95% (37 out of 39) of differences included within the estimated proportional limits of agreement.
Figure 3.
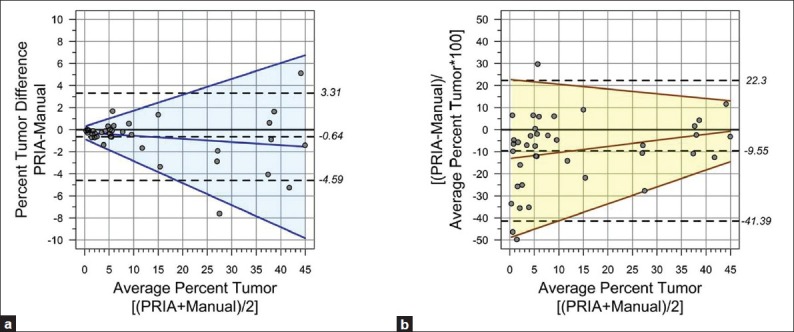
Percent pulmonary tumor burden limits of agreement (LoA). (a) Majority of the measurement differences (92%) fell within uniform 95% LoA (dashed lines). Regression of the absolute difference vs. average of the two methods confirmed no proportional bias (solid blue line, P=0.21). (b) Between-methods percent differences normalized to average tumor burden per sample was plotted to remove the effect of tumor burden extent. Mean PRIA was ≤10% than manual (dashed line). Constant variance test (yellow area =95% proportional LoA) revealed no proportional bias (solid brown line, P=0.12)
In order to remove dependence on the extent of tumor burden, the Bland-Altman method was subsequently performed by transforming the difference between PRIA and manual segmentation measurements to a percent difference scale ([PRIA-Manual]/Average*100), based on their tumor burden [Figure 3b]. On average, PRIA was approximately 10% smaller than manual measurements and the uniform 95% confidence limits of the bias contained 92% of the differences (36 out of 39). This analysis revealed that despite the effect of removing the measurement magnitude, the uniform limits of agreement seemed to be too wide for the largest measurements, and the measurement error appears relatively large in the smallest range of the measurements (mostly in the range of the tumor content below 3%). Therefore, we again tested the constant bias assumption and generated 95% proportional limits of agreement based on the absolute residual regression on the average. The slope of the regression fit of the percent difference versus average was not significant (slope = 0.28 ± 0.17, P = 0.12) and thus no proportional bias was identified between the PRIA and manual method. The regression-based 95% limits of agreement define the interval at the lower limit = -49+0.77*Average and at the upper limit = 23-0.22*Average, which contains 95% of the measurement differences (37 out of 39) [Figure 3b]. Overall, the Bland-Altman agreement analyses showed that individual measurements fall within the range of inherent variability of the tumor content measurement and thus indicate sufficient agreement for the methods to be used interchangeably.
Investigators versed in manually outlining histological features during morphometric analyses will recognize that the precision of this approach is less than perfect and the operator can introduce inaccuracies. Distinct advantages of PRIA are presumed to be its precision and the minimization of intra- and interoperator biases potentially influencing quantification of histological features.[6,9] In order to assess the reproducibility of automated PRIA compared to manual morphometrics, replicate metastatic tumor areas were acquired from the mouse lungs manually by a second operator, and by employing a second Genie algorithm created from the same slides used to train the original pulmonary metastatic tumor algorithm. Substantially concordant correlation coefficients were obtained for PRIA replicate measurement analysis (0.998, 95% C.I. = 0.9964-0.9989) and for manual replicate measurements (0.9889, 95% C.I. = 0.9806-0.9937). However, the manually acquired repeated measures were less reproducible (coefficient of variation = 17.10), compared to the measurements obtained with the two pulmonary PRIA algorithms (coefficient of variation = 7.40). This demonstrated the superior reproducibility of PRIA compared to manual morphometric acquisition.
Comparison of PRIA to Expert Diagnostic Assessment of Morphologically Complex Tissue Specimens
In order to evaluate PRIA software further, algorithms suitable for assessing more morphologically complex sets of tissues were developed in a second application using tissue sections from teratomas. Stem cell teratomas represent neoplasms derived from pluripotent cells capable of recapitulating the spectrum of embryonic development, phenotypically manifesting varying degrees of dysplastic cell differentiation and stratification.[22] Tissue sections from six sources of teratomas grown from mouse or human stem cells, grafted in immunodeficient mice, provided a highly complex morphological array for further PRIA assessment [Table 3]. Specimens were originally derived for the purposes of determining the potential for stem cell pluripotency. In vivo teratoma development with evidence of tissues/cells derived from all three ontogenic germ layers is considered the most stringent gauge of stem cell potential and pluripotency.[22,23] Teratomas developed from different sources of stem cells provided a spectrum of tissues including those recapitulating advanced degrees of differentiation (more-differentiated), as well as other teratomas that were predominantly composed of less-developed, primitive tissues (less-differentiated) [Table 3].
Table 3.
Characterization of stem-cell derived teratomas and diagnostic agreement of pluripotency obtained using PRIA
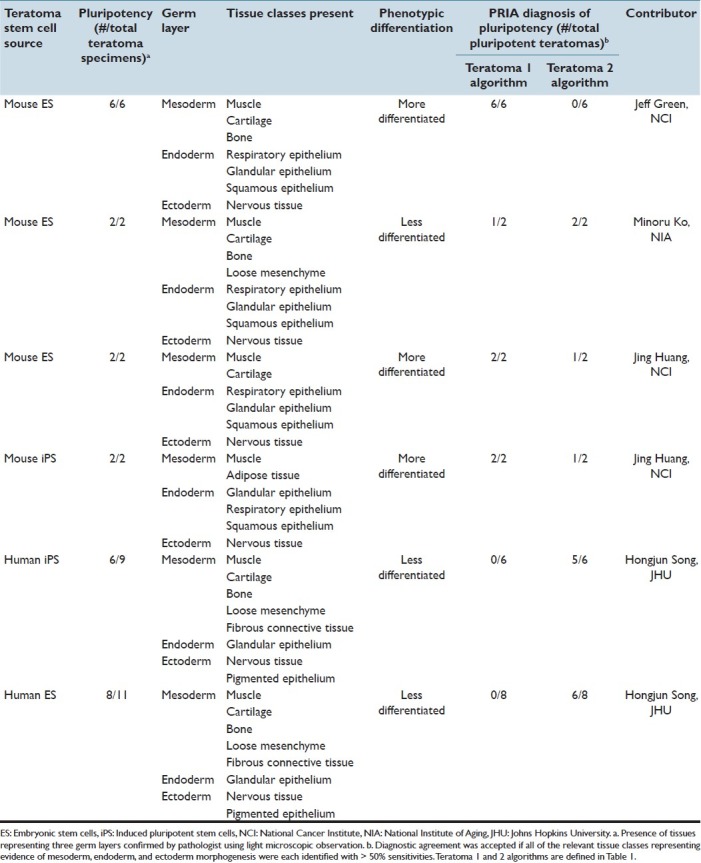
Supplied teratomas had been formalin-fixed, paraffin embedded, sectioned at approximately 5 μm thickness, and stained with hematoxylin and eosin. Whole-slide images were acquired as described above. Following a series of refinements to optimize tissue class sensitivities and specificities during the training process, an original PRIA algorithm was developed for teratomas using four training slides, including two more-differentiated and two less-differentiated teratomas, representing the histomorphologic spectrum within the collection [Table 1, Teratoma 1]. Specimens derived from both human and mouse stem cells were included in the training. Tissue classes selected for training included muscle, nervous tissue, epithelium, cartilage, undifferentiated cells/cell debris, glass/fat, blood, and keratin.
PRIA was compared to histopathologic assessments performed by a pathologist [Figure 4]. The Teratoma 1 PRIA algorithm [Table 1] provided an automated means to detect morphological evidence of pluripotency in those teratomas with more-differentiated features, which had previously been determined to include tissue components representing all three ontogenic germ cell layers [Table 3]. However, the Teratoma 1 algorithm performed relatively poorly on less-differentiated teratomas, conclusively identifying evidence of pluripotency in only 1 of 16 such teratomas in which all three germ layers were present [Table 3]. We concluded that the histomorphologic spectrum present in more- and less-differentiated teratomas was extremely broad and difficult to encompass in a single algorithm, even when the algorithm was developed using representative teratomas from multiple sources. For example, the ability to accommodate appropriate segmentation of nervous tissue characterized by neuroparenchyma with scattered perikarya and glial cells reminiscent of cerebral cortex, as well as encompass nervous tissue primarily consisting of primitive neuroectodermal cells arranged as multiple, densely cellular rosettes, proved problematic to achieve. The overlap of multiple histologic features among the various teratomas similarly contributed to this difficulty. Broadening training montage features in an attempt to accommodate the diversity of histological features frequently resulted in a detrimental trade-off, increasing PRIA error elsewhere in images at the expense of improving segmentation of features targeted for refinement.
Figure 4.
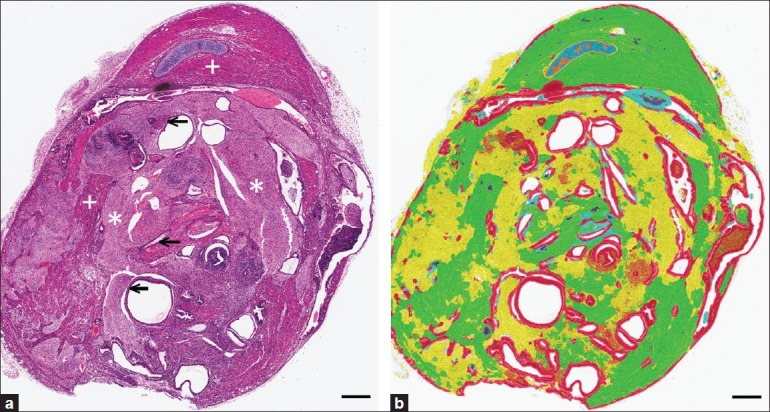
Automated PRIA-based diagnosis of pluripotency in teratomas. (a) Pathologist assessment for evidence of mesoderm, ectoderm, and endoderm morphogenesis: muscle (+), nervous tissue (*), and epithelium (←) are labeled in a teratoma. (b) Represents the same image in (a) after PRIA [Teratoma 1, Table 1]. Pseudo-color mark-up illustrates muscle (green), nervous tissue (yellow), cartilage (blue), and epithelium (red), evidence of pluripotency. PRIA diagnostic agreement was accepted if all of the tissue classes representing all germ layers (as in this example), were identified with >50% sensitivities. Bars=500um
The broad histomorphologic spectrum of tissue features occurring in the array of teratomas was addressed further by developing a second algorithm using only features of less-differentiated teratomas during training [Table 1, Teratoma 2]. This new algorithm led to detection of all three ontogenic germ cell layers for 13 of 16 less-differentiated teratomas that exhibited pluripotency [Figure 5 and Table 3]. However, when Teratoma 2 algorithm was applied to more-differentiated teratomas, only 2 of 10 had evidence of pluripotency detected appropriately, due to diminished segmentation accuracy within large areas of tissue, compared to the original algorithm [Figure 5].
Figure 5.
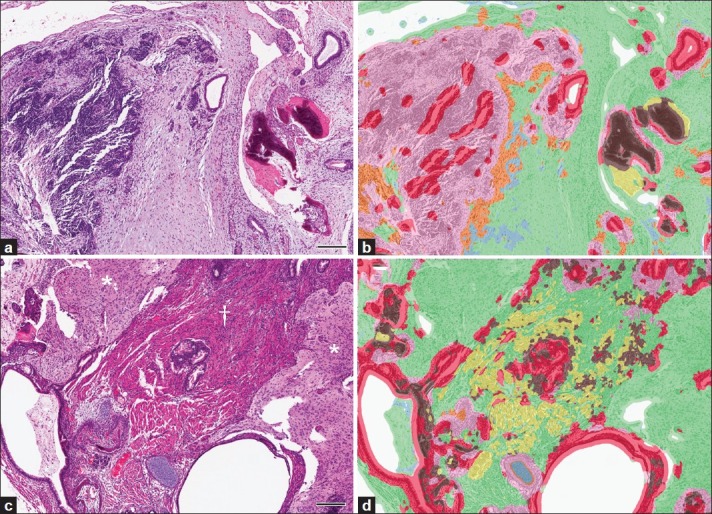
Teratoma phenotypic diversity highlighted challenges developing PRIA algorithms. (a, b, same field of view). Agreement with pathologist assessment of pluripotency by PRIA using Teratoma 2 algorithm for less-differentiated teratomas was documented in (b) by evidence of mesoderm (bone, brown; connective tissue, green), endoderm (epithelia, red), and ectoderm (nervous tissue, pink). However, more-differentiated teratomas (c, d, same field of view) were less accurately segmented. For example, large areas of muscle (†) and nervous tissue (*) were misidentified as connective tissue (green). 200 μm
The PRIA software is programmed to assign each image pixel in the set of testing images to a predesignated tissue class defined within the analysis montage during training. This can result in some false-positive (and false-negative) tissue feature classifications during image segmentation. Despite this, PRIA algorithms developed for teratomas in this evaluation yielded computer-assisted diagnosis of stem cell pluripotency for many specimens, through the confirmation of the presence of tissue layers representing ectoderm, mesoderm and endoderm morphogenesis [Table 3]. However, areas of less accurate image segmentation were similarly evident, as judged by pathologist histopathologic assessment. Regardless of the teratoma algorithm applied or a specimen's phenotypic differentiation, certain image segmentation inaccuracies were observed fairly consistently. Examples of these inaccuracies involved muscular-walled blood vessels, epithelia bordering a tissue cavity, and areas of cellular degeneration or necrosis. Cell death, in particular, resulted in such image segmentation inaccuracies due to its varied morphological manifestations and the fact that characteristics of necrosis can overlap with certain other histological features [Figure 6].
Figure 6.

Inaccurate automated PRIA segmentation of necrotic tissue within teratomas. (a) Necrosis within a teratoma, characterized by amorphous, eosinophilic cellular debris mixed with nuclear debris, characteristic of dying cells. (b) Pseudo-color mark-up of image depicted in (a) following PRIA [Teratoma 1, Table 1]. Despite a training class encompassing cell debris (orange), the region of necrosis was inaccurately segmented as nervous tissue (yellow) and muscle (green), with flecks of cartilage (blue). The algorithm more accurately mapped the congested vasculature present (purple). Bars = 50 μm
Out of these evaluations, it became apparent that the PRIA software's training montage size limit of 1.6 × 107 pixels restricted the number and characteristics of tissue class examples that could be incorporated into the teratoma training montage. This fact, coupled with the broad range of histomorphologies present within the teratoma specimens, necessitated the application of multiple algorithms in order to analyze the broad range of tissue features. Similar circumstances, dictating the development of multiple PRIA algorithms to address within tumor-type phenotypic heterogeneity, were encountered previously.[9]
SUMMARY AND CONCLUSION
Insight into how well PRIA agrees with histopathologic assessment was sought through comparisons to an accepted morphometric technique employing objectively obtained metrics, and by comparing PRIA with tissue evaluations familiar to many pathologists. Quantitative histopathologic assessment is a needed adjunct to both diagnostic and investigative pathology and the potential for PRIA to influence future histopathologic assessment was key in our rationale to undertake this software evaluation. The out-of-the-box application evaluation approach was made from a perspective similar to what many prospective users would employ.
The ability to apply automated image analysis represents both technical and logistical advances for quantifying phenotypic manifestations of diseases in tissues.[1] PRIA software provided the ability to obtain automated quantification of user-defined histological features from optically scanned, digitized tissue sections, and in particular performed well segmenting dichotomous lung features. As alluded to in previous reports,[6,9] the findings obtained in this study through repeated measures analyses demonstrated the ability to objectively achieve more reproducible image segmentation with PRIA, compared to interoperator manual segmentation. Significant agreement between PRIA and manual image segmentation of metastatic tumors in the lung was obtained across the sample population, with analytical tests revealing differences or ambiguities between methods to be largely inconsequential. There were sources of both false-positive and false-negative PRIA errors observed however, similar to a previous report.[6] Variations in tissue orientation, handling, processing, and staining among specimens can be sources of segmentation inaccuracies. Such variations are routinely encountered and interpretatively accommodated for in histologic sections by pathologists. Such circumstances influence the application of algorithms across entire studies or algorithm application to multiple different study sets, and minimizing the presence of preanalytical variables is advantageous for application of image analysis.[24] For example, in the present study, spatial-spectral features useful for discriminating aerated, expanded lung from tumor proved inadequate for segmenting collapsed, atelectic lung, for which the nuclear and tissue density features were more similar to metastatic tumor than to aerated lung tissue. Such factors led to the application of methods for computing corrected PRIA measurements, in order to evaluate the potential influence of segmentation inaccuracy on outlier data values more thoroughly. Although the necessity to manually correct the image segmentation inaccuracy did not appear to be a requirement in this study in retrospect, if such was a matter of routine it would be limiting for PRIA in general. Nonetheless, implementation of pathologist quality assurance review of image data mark-up files further substantiated the value of the review in enhancing the ability to distinguish tolerable from more substantial segmentation errors. Therefore pathologist quality assurance review should be a part of the image analysis workflow.
Despite confirming a significant degree of identity and a lack of proportional bias between PRIA and manual image segmentation, there was clear indication that the variance of measurement error detected between the two methods depended in part on measurement magnitude. The Bland-Altman analysis conducted to isolate the effect of the measurement magnitude and the amount of differences between PRIA and manual measurements highlighted the greatest disparities in the smallest range of the measurements (mostly in tumor content below 3%). The smallest tumor burdens appeared to disproportionately influence this. Retrospective examination of both manual and PRIA mark-up images from the seven specimens with limited tumor burdens deviating furthermost from equality [Figure 3b], yielded evidence that PRIA had greater specificity for tumor identification, but was less sensitive due to failure to detect limited tumor foci admixed with pulmonary hemorrhage or congestion. In contrast, manual image segmentation appeared to be more sensitive for delineating areas of limited neoplastic foci. However, nonneoplastic tissue changes (inflammation) were occasionally included at the margins of these foci, which diminished analytic specificity to a degree. Collectively, such identifications appeared to be near the threshold limits of technical and practical abilities to accurately distinguish measurable differences within tissues regardless which of these two methods was applied. Conceivably the expert can segment such features with greater accuracy, particularly when employing higher resolution images during segmentation, but this may be negated by the practical limits of doing so. Therefore, this should be considered when applying PRIA for detecting early lesions, treatment group differences, or minimal residual disease, for example.
Application of automated PRIA requires cross-validation. Algorithms demand varying degrees of customization that cannot always be predicted, a priori. In order for algorithms to be suitable, appropriate detection and identification of relevant features in unknown images in a testing set must be validated.[5,6] Transferring an algorithm from study to study in order to analyze tissue features with related histogenesis, works in some cases but not in other cases,[9] a circumstance encountered in the teratoma evaluations. Overall, the PRIA software performed reasonably well in detecting teratoma pluripotency. The complex phenotypic diversity of the teratomas presented a key challenge to achieving optimal diagnostic agreement, and led us to ultimately produce two algorithms incorporating more restricted training features for each. Prior to creating multiple algorithms however, the use of higher resolution images coupled with algorithms trained at higher resolution was considered during attempts to improve diagnostic agreement. We concluded that the enhanced file sizes, processing time requirements, and computational limitations inherent in doing so, constrained a systematic evaluation of these parameters at this time.[5,6]
Analyses of the series of morphologically complex teratomas provided evidence of limitations in PRIA diagnostic ability, compared to expert assessment. Histopathologic PRIA appeared to be best suited for analysis of a limited phenotypic range and few numbers of tissue features. Both tissue applications tested and the inability to optimize pulmonary and teratoma algorithms to commensurate levels of specificity and sensitivity supported this conclusion. In addition, this deduction is also consistent with the initial development of PRIA for geospatial image feature extraction.[5] Through this analysis, it became apparent that enhancement to the histopathologic PRIA process is in order. Certain foundational limitations we, and others, have encountered that appear to impact the ability to attain better diagnostic agreement must be addressed, either through additional improvements in technology and/or garnering additional user experience.[5,9,16] Examples of technical limitations encountered include presumptive restrictions in features that could be incorporated for algorithm training and computational reliance on multispectral features at the expense of sufficiently robust spatial image processing. File size limitations and spectral processing dominance are inherent software limitations that can be an issue in any analysis; however, they become exaggerated when analyzing highly heterogeneous tissues. Making multiple, more simplified, algorithms to apply to a series of the same lesions appeared to be the best means to deal with these issues currently, although this is a less than optimal work-around. Further software refinements to these limitations may improve discrimination of difficult to differentiate histological features, such as distinguishing cell death from several other tissue features, a repetitive diagnostic shortcoming in this and a previous study.[9] It is important to point out that these suppositions regarding the state of PRIA technology must be considered in the context of the limited, although representative, types of applications analyzed in this evaluation. In the same regard, this evaluation included only a single, although highly representative, PRIA software platform. Additional evaluations are therefore warranted.
The evolution of artificial intelligence applications, like PRIA, will be monitored by entities wishing to take maximum advantage of emerging knowledge-work automation technologies.[25] Such technology is apt to improve the throughput for screening large numbers of study slides, while permitting diagnostic criteria to be consistently applied across all specimens. Future developments in this technology, including improvements in automation and management of these systems, may shape the redefinition of the pathologist's role. However, organizations implementing this technology will likely discover that gains achieved through their “virtual pathologists” will be imperfect due to the need for contextual, integrative medical decision making in pathology interpretations. How this emerging technology is deployed and utilized will help to determine if anticipated competitive advantages can be achieved.[25] Attaining the greatest benefits from automated PRIA will entail an ongoing collaboration of experts in computer technology, image processing, and pathological diagnosis.
Competing Interests
The authors declare that they have no competing interests.
Authors’ Contributions
J.D.W. was involved with designing and conducting the study, analyzing data, performing pathology quality assurance, and drafting and editing the manuscript. A.M.M. designed the study, conducted statistical analyses, and drafted, and edited the manuscript. J.E.D. and K.N.C. conducted experiments, analyzed data, and edited the manuscript. B.R.W. was involved in study design, analyzing data, and writing the manuscript. T.J. and S.B.H. participated in designing the study and analyzing data. R.M.S. developed the study's concept, directed study design, analyzed data, and drafted and edited the manuscript.
ACKNOWLEDGMENTS
This research was supported by the Intramural Research Program, Center for Cancer Research, National Cancer Institute, Bethesda, MD. Currently, K.N.C. is a molecular pathology fellow in the NIH Comparative Biomedical Scientist Training Program supported by the National Institute of Neurological Disorders and Stroke, in a partnership with North Carolina State University. B.R.W. is an employee of the Science Applications International Corporation-Frederick, Inc., Frederick, Maryland, USA, on contract to the National Cancer Institute Intramural Research Program (Award N01-CO-12400). The authors acknowledge Drs. Lalage Wakefield and Yu-An Yang, NCI for providing mouse lung tissue sections. Stem cell-derived teratoma tissue samples were graciously provided by Drs. Christy Tomlinson, Jeffery Green, and Jing Huang, NCI, Drs. Minoru Ko and Yuhki Nakatake, The National Institute on Aging, and Dr. Hongjun Song at Johns Hopkins University.
Footnotes
Available FREE in open access from: http://www.jpathinformatics.org/text.asp?2012/3/1/18/95130
REFERENCES
- 1.Ying X, Monticello TM. Modern imaging technologies in toxicologic pathology: An overview. Toxicol Pathol. 2006;34:815–26. doi: 10.1080/01926230600918983. [DOI] [PubMed] [Google Scholar]
- 2.Jara-Lazaro AR, Thamboo TP, Teh M, Tan PH. Digital pathology: Exploring its applications in diagnostic surgical pathology practice. Pathology. 2010;42:512–8. doi: 10.3109/00313025.2010.508787. [DOI] [PubMed] [Google Scholar]
- 3.Mulrane L, Rexhepaj E, Callanan JJ, Gallagher WM. Automated image analysis in histopathology: A valuable tool in medical diagnostics. Expert Rev Mol Diagn. 2008;8:707–25. doi: 10.1586/14737159.8.6.707. [DOI] [PubMed] [Google Scholar]
- 4.Potts SJ, Young GD, Voelker FA. The role and impact of quantitative discovery pathology. Drug Discov Today. 2010;15:943–50. doi: 10.1016/j.drudis.2010.09.001. [DOI] [PubMed] [Google Scholar]
- 5.Brumby SP, Harvey NR, Perkins S, Porter RB, Szymanski JJ, Theiler J, et al. A genetic algorithm for combining new and existing image processing tools for multispectral imagery. Proc SPIE. 2000;4049:480–90. [Google Scholar]
- 6.Shamir L, Delaney JD, Orlov N, Eckley DM, Goldberg IG. Pattern recognition software and techniques for biological image analysis. PLoS Comput Biol. 2010;6:e1000974. doi: 10.1371/journal.pcbi.1000974. [DOI] [PMC free article] [PubMed] [Google Scholar]
- 7.Kriete A, Boyce K. Automated tissue analysis-a bioinformatics perspective. Methods Inf Med. 2005;44:32–7. [PubMed] [Google Scholar]
- 8.Brennan DJ, Brandstedt J, Rexhapaj E, Foley M, Pontein F, Uhlen M, et al. Tumor-specific HMG-CoAR is an independent predictor of recurrence free survival in epithelial ovarian cancer. BMC Cancer. 2010;10:125. doi: 10.1186/1471-2407-10-125. [DOI] [PMC free article] [PubMed] [Google Scholar]
- 9.Webster JD, Simpson ER, Michalowski AM, Hoover SB, Simpson RM. Quantifying histologic features of cancer biospecimens for biobanking quality assurance using automated morphometric pattern recognition image analysis algorithms. J Biomol Tech. 2011;22:108–18. [PMC free article] [PubMed] [Google Scholar]
- 10.Mete M, Xu X, Fan CY, Shafirstein G. Auotmatic delineation of malignancy in histopathological head and neck slides. BMC Bioinformatics. 2007;8(Suppl 7):S17. doi: 10.1186/1471-2105-8-S7-S17. [DOI] [PMC free article] [PubMed] [Google Scholar]
- 11.Lloyd MC, Allam-Nandyala P, Purohit CN, Burke N, Coppola D, Bui MM. Using image analysis as a tool for assessment of prognostic and predictive biomarkers for breast cancer: How reliable is it? J Pathol Inform. 2010;1:29. doi: 10.4103/2153-3539.74186. [DOI] [PMC free article] [PubMed] [Google Scholar]
- 12.Barsky SH, Gentchev L, Basu AS, Jimenez RE, Boussaid K, Gholap AS. Use and validation of epithelial recognition and fields of view algorithms on virtual slides to guide TMA construction. Bio Techniques. 2009;47:927–38. doi: 10.2144/000113207. [DOI] [PubMed] [Google Scholar]
- 13.Wang CW, Fennell D, Paul I, Savage K, Hamilton P. Robust automated tumour segmentation on histological and immunohistochemical tissue images. PLoS One. 2011;6:e15818. doi: 10.1371/journal.pone.0015818. [DOI] [PMC free article] [PubMed] [Google Scholar]
- 14.Gown AM. Current Issues in ER and HER2 testing by IHC in breast cancer. Mod Pathol. 2008;21(Suppl 2):S8–S15. doi: 10.1038/modpathol.2008.34. [DOI] [PubMed] [Google Scholar]
- 15.Stromberg S, Bjorklund MG, Asplund C, Skollermo A, Persson A, Wester K, et al. A high-throughput strategy for protein profiling in cell microarrays using automated image analysis. Proteomics. 2007;7:2142–50. doi: 10.1002/pmic.200700199. [DOI] [PubMed] [Google Scholar]
- 16.Angeletti C, Harvey NR, Khomitch V, Fischer AH, Levenson RM, Rimm DL. Detection of malignancy in cytology specimens using spectral-spatial analysis. Lab Invest. 2005;85:1555–64. doi: 10.1038/labinvest.3700357. [DOI] [PubMed] [Google Scholar]
- 17.Bland JM, Altman DG. Statistical methods for assessing agreement between two methods of clinical measurements. Lancet. 1986;327:307–10. [PubMed] [Google Scholar]
- 18.Passing H, Bablok W. A new biometrical procedure for testing the equality of measurements from two different analytical methods. Application of linear regression procedures for method comparison studies in clinical chemistry, Part I. J Clin Chem Clin Biochem. 1983;21:709–20. doi: 10.1515/cclm.1983.21.11.709. [DOI] [PubMed] [Google Scholar]
- 19.Bland JM, Altman DG. Measuring agreement in method comparison studies. Stat Methods Med Res. 1999;8:135–60. doi: 10.1177/096228029900800204. [DOI] [PubMed] [Google Scholar]
- 20.Lin L. A concordance correlation coefficient to evaluate reproducibility. Biometrics. 1989;45:255–68. [PubMed] [Google Scholar]
- 21.Lin L. A note on the concordance correlation coefficient. Biometrics. 2000;56:324–5. [Google Scholar]
- 22.Przyborski SA. Differentiation of human embryonic stem cells after transplantation in immune-deficient mice. Stem Cells. 2005;23:1242–50. doi: 10.1634/stemcells.2005-0014. [DOI] [PubMed] [Google Scholar]
- 23.Ameen C, Strehl R, Bjorquist P, Lindahl A, Hyllner J, Sartipy P. Human embryonic stem cells: current technologies and emerging industrial applications. Crit Rev Oncol Hematol. 2008;65:54–80. doi: 10.1016/j.critrevonc.2007.06.012. [DOI] [PubMed] [Google Scholar]
- 24.Dunstan RW, Wharton KA, Jr, Quigley C, Lowe A. The use of immunohistochemistry for biomarker assessment—can it compete with other technologies? Toxicol Pathol. 2011;39:988–1002. doi: 10.1177/0192623311419163. [DOI] [PubMed] [Google Scholar]
- 25.Malone TW, Laubacher RJ, Johns T. The age of hyperspecialization. Harv Bus Rev. 2011;89:57–65. [Google Scholar]