Summary
The amount of bone turnover in the body has been implicated as a factor that can influence fracture risk and bone strength. Here we test the idea that remodeling cavities promote local tissue failure by determining if microscopic tissue damage (microdamage) caused by controlled loading in vitro is more likely to form near resorption cavities. Specimens of human vertebral cancellous bone (L4, 7 male and 2 female, age 70 ± 10, mean ± SD) were loaded in compression to the yield point, stained for microscopic tissue damage and submitted to three-dimensional fluorescent imaging using serial milling (image voxel size 0.7 × 0.7 × 5.0 µm). We found the resulting damage volume per bone volume (DV/BV) was correlated with percent eroded surface (p < 0.01, r2 = 0.65), demonstrating that whole specimen measures of resorption cavities and microdamage are related. Locations of microdamage were more than two times as likely to have a neighboring resorption cavity than randomly selected sites without microdamage (relative risk 2.39, 95% confidence interval of relative risk: 2.09 – 2.73), indicating a spatial association between resorption cavities and microdamage at the local level. Individual microdamage sites were 48,700 (40,100; 62,700) µm3 in size (median, 25th and 75th percentiles). That microdamage was associated with resorption cavities when measured at the whole specimen level as well as at the local level provides strong evidence that resorption cavities play a role in mechanical failure processes of cancellous bone and therefore have the potential to influence resistance to clinical fracture.
Keywords: Bone remodeling, microdamage, cancellous bone, resorption cavities, biomechanics
1. INTRODUCTION
Increases in bone turnover, measured using whole body biomarkers of bone remodeling are associated with increased fracture risk, independent of bone mineral density [1]. While increased bone remodeling may be an indicator of more rapid rates of bone loss, it has also been suggested that the amount of bone remodeling in the body may influence bone strength and fragility independent of the amount of bone present [2, 3]. Although it is not known how the amount of bone remodeling might influence the biomechanical properties of cancellous bone, a commonly cited explanation is that cavities formed during the resorption phase of bone remodeling act as stress risers [4–7].
To date, evidence that resorption cavities are related to cancellous bone biomechanics has been limited to theoretical and computational models. Computational studies at the scale of individual trabeculae have suggested that the presence of resorption cavities on individual trabeculae causes as much as a 14 fold increase in local tissue stress and strain [8, 9]. However, only a total of four trabeculae have been analyzed in this fashion, all from animal specimens and one study did not observe a biomechanical effect of a cavity on a trabecula [10]. Finite element models of the entire cancellous bone structure have shown that cavities added digitally to the bone surface cause reductions in the stiffness and strength of cancellous bone that are greater than would be expected from the corresponding reduction in bone volume yet the biomechanical effect of cavities could be large or small depending on the spatial distribution of cavities [11, 12]. Theoretical studies therefore support the idea that resorption cavities influence the biomechanics of the cancellous bone structure.
If resorption cavities do have an adverse effect on cancellous bone biomechanics by acting as stress concentrations, their effect would be detectable at the local level in the form of microscopic cracks or other tissue damage (diffuse damage, trabecular microfracture) occurring in the immediate vicinity of resorption cavities. Traditionally, microscopic tissue damage is studied through examination of two-dimensional microscopy sections and is observed as linear microcracks, diffuse damage (diffuse sub-micron scale cracking) and trabecular microfracture [13, 14]. Collectively, these damage morphologies are referred to as microdamage. Microdamage can be generated in cancellous bone by applying mechanical loads in vitro. Previous studies of microdamage suggest that local tissue stresses may be greater in regions of the structure where microdamage forms [15, 16]. Theoretical and experimental studies suggest that microscopic tissue damage will form in localized regions of the cancellous bone structure (presumably around stress concentrations) at apparent strains below yield [17, 18]. Additionally it is known that cancellous bone damaged by an overloading event shows reduced stiffness and strength upon reloading, suggesting that damaged bone shows impaired biomechanical performance [19–21]. As a result, computational and experimental studies suggest that microdamage may be generated in cancellous bone well before yielding or failure and can influence subsequent biomechanical performance.
While theoretical studies support the idea that resorption cavities can influence cancellous bone biomechanics, experimental support for the hypothesis is scant. Scanning electron micrographs of trabecular bone suggest that most resorption cavities are quite broad and shallow and may therefore act as only minor stress concentrations [22]. Furthermore, load sharing within cancellous bone is complex and a trabecula weakened by a cavity may subsequently carry less load, reducing the tissue stress around the cavity. Additionally, it has been proposed that resorption cavities in cancellous bone occur preferentially in unloaded regions of the cancellous bone microstructure, suggesting that such cavities may not have high stresses in surrounding tissue.
We have previously demonstrated an image acquisition and processing technique that enables visualization of cancellous bone at a scale sufficient to detect individual resorption cavities [23, 24]. Additionally, the same approach has been used to detect and measure microscopic tissue damage labeled with fluorescent markers [25]. In the current study, we combined these two approaches to determine if microscopic tissue damage caused by in vitro loading occurs preferentially near resorption cavities.
The long-term goal of this research is to understand the association between bone remodeling and bone fragility. Specifically, in the current study we determine (1) if microdamage generated by controlled loading in vitro is more likely to be associated with resorption cavities, and (2) whether microdamage assessed in three-dimensional images is correlated with apparent mechanical properties or trabecular microarchitecture.
2. METHODS
2.1 Specimen Preparation and Mechanical Testing
The fourth lumbar vertebral bodies of 9 donors (7 male, 2 female, aged 47–80 years, 70 ± 10, mean ± SD, tissue source NDRI) were dissected and cleaned of soft tissue. Cylindrical cores of cancellous bone (8 mm in diameter and 15 mm length, one per donor) oriented in the cranial-caudal direction were collected from each vertebral body. Bone marrow was removed with a low-pressure water jet. Each specimen was bulk stained in xylenol orange solution (0.5 mM) for 2 hours to label pre-existing microdamage (generated in vivo or during specimen preparation) [26]. The specimens were rinsed in three washes of deionized water, embedded in brass caps using polymethyl methacrylate bone cement [27] and loaded in compression to apparent yield (0.80%) at a rate of 0.5% /sec, after which they were completely unloaded at a rate of 50 N/sec. The gage length for specimens embedded in this manner was taken to be the exposed length of the cylindrical bone core. Elastic modulus, yield strength, yield strain, and residual strain were determined [28]. After unloading, specimens were carefully removed from the testing apparatus and secured in a custom fixture used to prevent subsequent loading on the specimen. The exposed gage length of each specimen was removed using a low speed diamond saw and bulk stained in calcein solution (0.5 mM) for 2 hours to label both pre-existing microdamage and microdamage generated by controlled mechanical loading. The central 5 mm of each specimen was then cut away and embedded undecalcified in polymethyl-methacrylate made opaque by the addition of sudan black dye in preparation for image acquisition using serial milling [25].
2.2 Image Acquisition and Processing
Three-dimensional images of bone and fluorescent labels of microdamage were collected using fully automated serial milling [23, 25]. Serial milling involves sequentially milling away the top of a specimen and collecting a mosaic of images of the newly exposed specimen block face. Three images of each surface cross-section were obtained: one to visualize bone tissue (using a UV filterset to detect bone by autofluorescence, 350/420 nm, Excitation/Emission), one to visualize xylenol orange microdamage stain (TRITC filterset, 545/620 nm), and one to visualize calcein microdamage stain (FITC filterset, 470/525 nm). In our implementation, serial milling provided three-dimensional images of bone and fluorescent labels of microdamage at a resolution of 0.7 × 0.7 × 5.0 micrometers per voxel. This image resolution (< 1.4 µm in plane) has been shown sufficient to detect individual resorption cavities by bone surface texture (identified as eroded surfaces, see [24]). Raw images of each specimen consisted of 1000 cross-sections, each with a 6 × 6 mosaic. Raw images occupied ~315 GB in memory per fluorescent channel (945 GB total per specimen). Images were transferred to a workstation (Dell Precision T7500, 48GB RAM, 3.47 GHz 64-bit processor) for image processing. Image processing involved the following steps: automatic tiling to assemble a mosaic of each cross-section; vertical registration of each cross-section; removal of fluorescent signal originating from below the specimen block face; and segmentation to identify bone (please see [23, 24, 29] for a thorough description of the image processing steps and validation). Images of bone (collected using the UV filterset) were submitted to a manually determined global threshold.
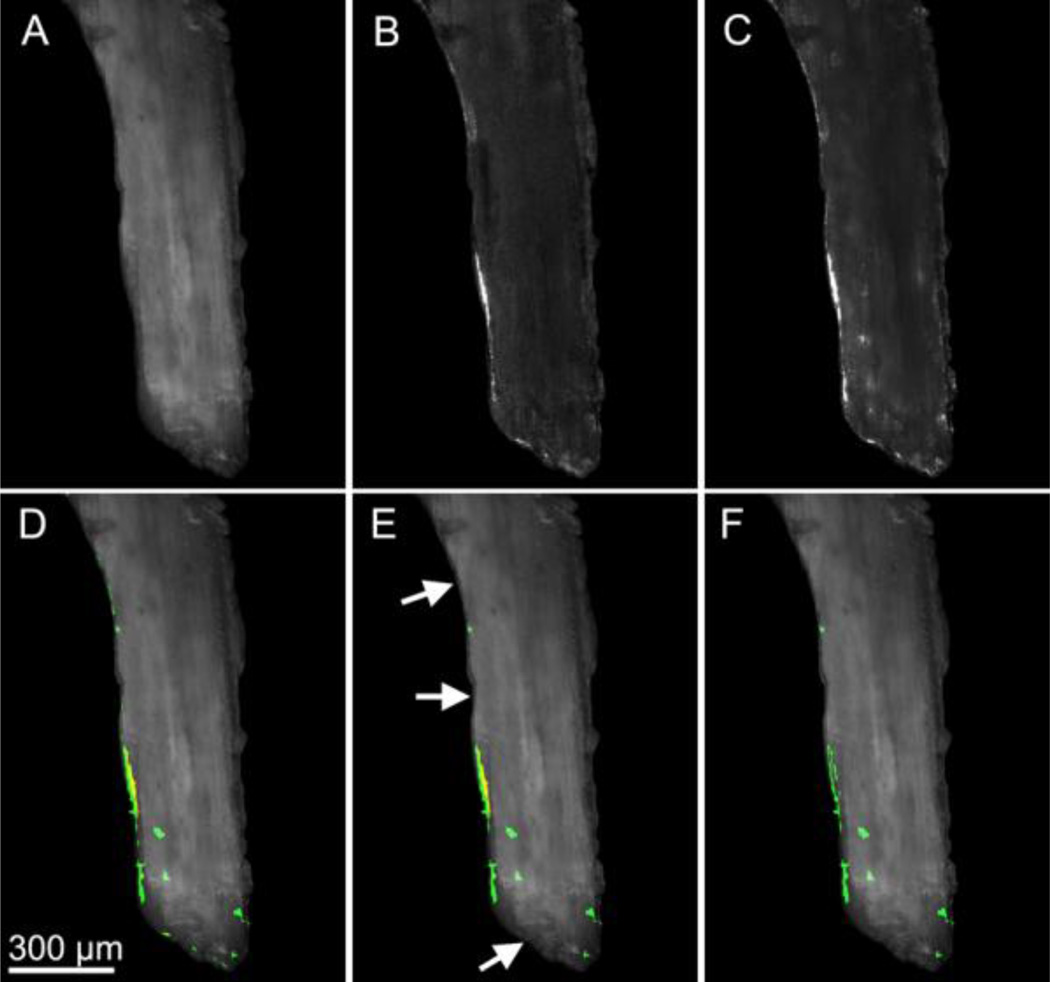
Images of the microdamage stains were stitched together using positional information determined from the images of bone (method described above) and were resampled using the Lanczos algorithm to produce cubic voxels of 2.8 microns to reduce computational expense. The outer 0.5 mm of each cylindrical core was removed from each image to avoid including microdamage generated during specimen preparation. Segmentation of each microdamage stain was achieved using global thresholds identified manually by a user (Fig. 1a). After image segmentation, each three-dimensional image was converted to binary format (6 GB of memory per specimen). Subsequently, three-dimensional binary morphological closing [30] with a spherical structuring element (5.6 µm in radius) was used to correct for distortions in signal intensity resulting from cutting marks left by the serial milling process. Fluorescent signal within the marrow space was discarded using a masking operation. The resulting images included microdamage as well as small amounts of random noise and non-specific surface staining. Patches of stain less than 10,000 µm3 (approximately the size of three osteocyte lacuna) were characterized as random noise and removed from the image. Patches smaller than 10,000 µm3 accounted for less than 1% of the total damage volume. To remove non-specific surface staining from the image, patches of stain that did not extend more than 5 micrometers from the surface were removed. Lastly, microdamage caused by controlled loading was differentiated from that naturally occurring or caused by specimen preparation by taking advantage of the pre- and post-mechanical testing stains. The xylenol orange stain identified microdamage that was present before applied mechanical testing while the calcein stain identified pre-existing microdamage as well as microdamage caused by mechanical testing. Sites stained by both xylenol orange and calcein therefore represented microdamage present before mechanical loading and were removed from the calcein image, leaving only microdamage generated by controlled mechanical loading (Fig. 1b–c). When counting the number of microdamage sites, patches of microdamage within 25 µm of one another were considered to be related to one another and were classified as a single microdamage site. Measures of microdamage size and surface to volume ratio were determined for each site. Image processing and visualization were performed using scripts for Matlab (R2008a with Image Processing Toolbox, Natick, MA, USA) and Amira (5.3 Visage Imaging, San Diego, CA, USA).
Figure 1.
Image processing associated with fluorescent microdamage stains is shown. Gray-scale images of (A) bone, (B) xylenol orange microdamage stain, and (C) calcein microdamage stain are shown. (D) Overlay images of xylenol orange and calcein show non-specific staining of the bone surface (thin lines). (E) Stain that did not extend more than 5 µm into the bone surface was classified as non-specific surface staining and was removed (arrows). (F) The true microdamage caused by loading is determined by removing regions stained with both xylenol orange and calcein.
Three-dimensional measures of individual microdamage site volume and surface to volume ratio as well as the overall damaged volume per bone volume (DV/BV) were determined in each specimen. Following standard sampling rules, only microdamage sites not in contact with the boundaries of the region of interest were included in measures of microdamage site volume, area, and aspect ratio [30, 31]. Three-dimensional trabecular microarchitecture measures of bone were determined by coarsening the voxel size to 10.6 × 10.6 × 10.0 µm and importing into BoneJ [32]. Microarchitecture measures included bone volume fraction, bone specific surface, trabecular thickness, trabecular separation, structure model index, degree of anisotropy, and connectivity density. Percent eroded surface (ES/BS) was determined in the same region of the specimen examined for microdamage using gray scale images (pixel size 0.7 × 0.7 µm) and point counting (three cross-sections per specimen).
2.3 Spatial Association of Microdamage and Resorption Cavities
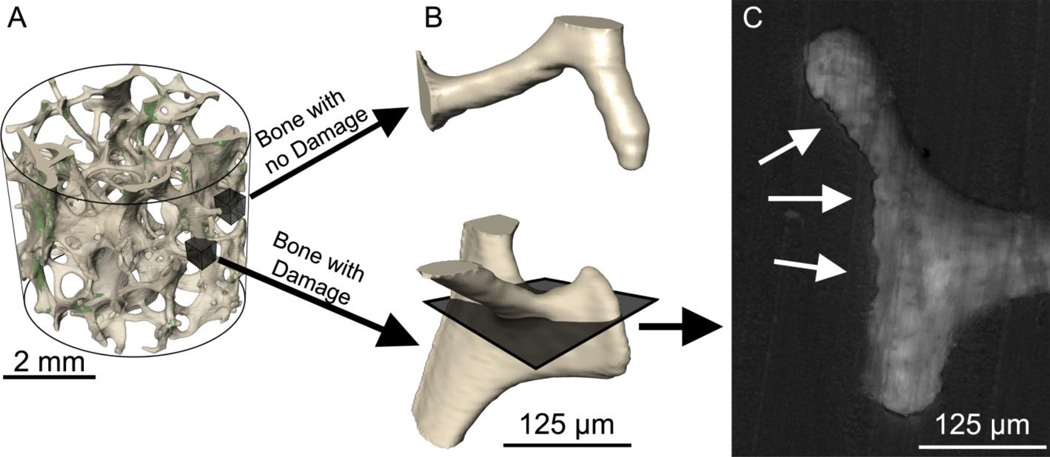
To determine if microdamage sites were more likely to be near resorption cavities, the largest microdamage sites (by volume) were identified (32 sites per specimen). An additional 32 sites on the bone surface without neighboring microdamage were selected at random (for a total of 64 sites per specimen) (Fig. 2a). Custom scripts for use with Amira were created to display a three-dimensional image of the 125 µm of bone surround each of the 64 sites in random order (Fig. 2b). Resorption cavities in the region were detected as indentations on the bone surface in the three-dimensional image and confirmed by viewing eroded surface in grayscale cross-sections of the bone (0.7 µm pixel size). Eroded surface was identified as distinct scalloped bone surfaces or “crenated” surface (Fig. 2c). The observer then recorded whether a cavity was present at the site or not (yes or no at each of the 576 sites examined). It is important to note that when displayed in this manner, microdamage was not visible so that the user was completely blinded to the presence of microdamage (Fig. 2b-c).
Figure 2.
(A) The regions of bone with the largest microdamage sites were identified (32 per specimen). Subsequently, regions of bone without microdamage were selected at random (32 per specimen). (B) The bone surface around each region was displayed without showing microdamage so that the observer was blinded to the presence of microdamage. A cavity was identified as an indentation on the bone surface in the three-dimensional image. (C) The presence of a resorption cavity was confirmed by observing the eroded surface (arrows) in multiple cross-sections.
2.4 Statistical Analyses
Correlation analysis was used to identify relationships between mechanical properties (Young’s modulus, yield stress, yield strain and residual strain) and measures of microdamage (DV/BV, median volume per microdamage site, average microdamage site surface to volume ratio, and number of microdamage sites per bone volume). Correlation analysis was also used to identify relationships between measures of trabecular microarchitecture, percent eroded surface, and measures of microdamage. Additionally, correlation analysis was used to identify relationships between measures of trabecular microarchitecture and mechanical properties. The spatial association of resorption cavities and microdamage sites was determined using the proportion of bone microdamage sites with cavities (pmicrodamage) and the proportion of non-damaged sites with resorption cavities present (pnon-damaged). The relative risk of observing a cavity near a microdamage site was then determined as the ratio of the ratio of the two proportions (pmicrodamage/ pnon-damaged).
3. RESULTS
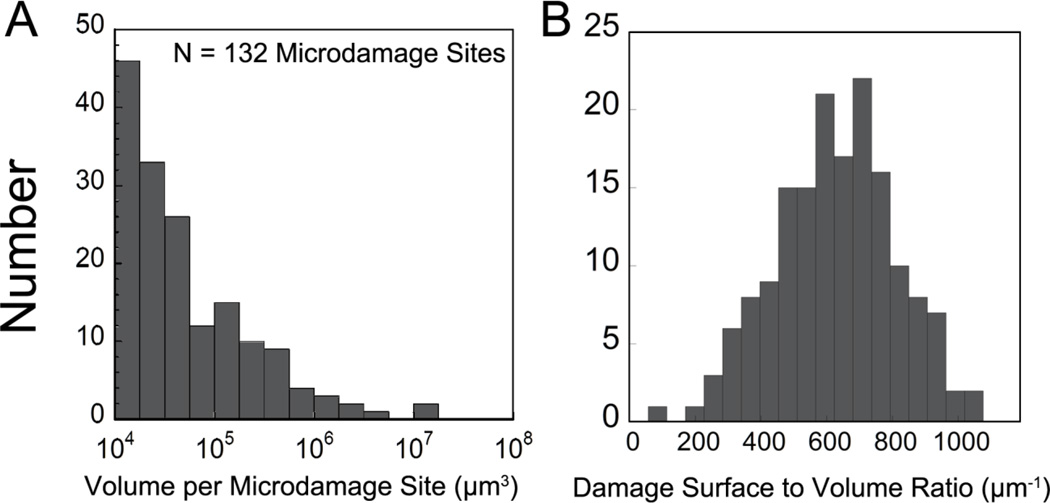
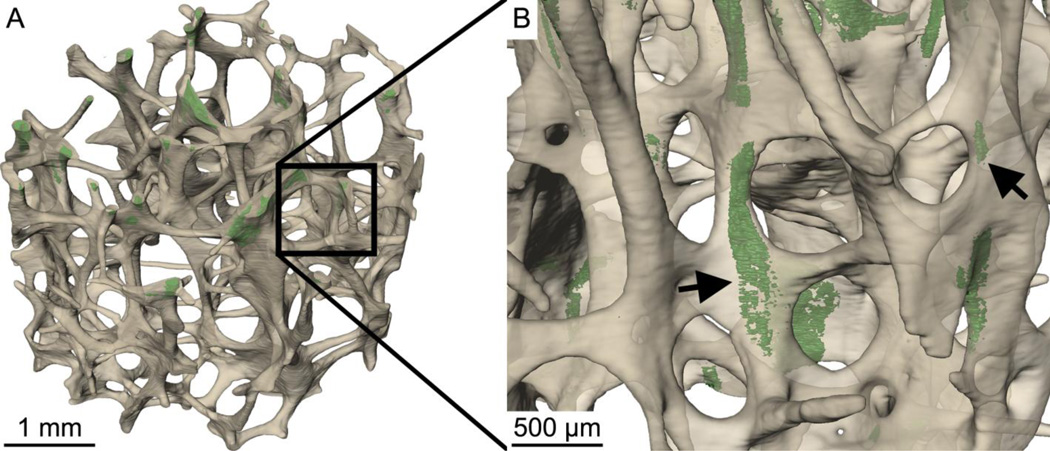
Measures of percent eroded surface, damage volume per bone volume, and microdamage site morphology are shown in Table 1. The volumes of individual microdamage sites were positively skewed (Fig. 3). Microdamage sites generally appeared crack-like by visual inspection in that they were much thinner than they were broad (Fig. 4a–b). Microdamage site surface to volume ratio was 601 ± 44.5 mm−1 (mean ± SD, Fig. 3b).
Table 1.
Static histomorphometric parameters and microdamage measured in three-dimensional images as well as apparent biomechanical properties are shown (n=9 specimens).
| Mean ± SD | Median (25th,75th Percentiles) |
|
|---|---|---|
| Bone Volume Fraction (BV / TV) | 6.75 ± 2.45 % | 6.08 (5.71, 7.67) % |
| Percent Eroded Surface (ES / BS) | 5.10 ± 1.75 % | 5.27 (4.61, 6.33) % |
| Bone Specific Surface (BS/TV, µm−1) | 1.77 ± 0.50 | 1.75 (1.42, 2.00) |
| Trabecular Thickness (Tb.Th, µm) | 132 ± 22.2 | 135 (121, 140) |
| Trabecular Separation (Tb.Sp, µm) | 1,020 ± 217 | 960 (884, 1,050) |
| Degree of Anisotropy (DA) | 1.48 ± 0.12 | 1.49 (1.42, 1.61) |
| Structure Model Index (SMI) | 1.70 ± 0.60 | 1.52 (1.37, 2.19) |
| Connectivity Density (Conn.D, mm−1) | 4.84 ± 2.26 | 5.55 (1.37, 2.19) |
| Number of Microdamage Sites | 130 ± 51.4 | 111 (81, 172) |
| Number of Microdamage Sites per Bone Volume (mm−3) | 22.6 ± 10.1 | 21.2 (15.2, 24.0) |
| Median Microdamage Site Volume (µm3) | 57,600 ± 31,300 | 48,700 (41,100, 57,200) |
| Average Microdamage Site Surface to Volume Ratio (DS/DV, µm−1) | 601 ± 44.5 | 592 (569, 605) |
| Damage Volume per Bone Volume (DV / BV) | 0.77 ± 0.33% | 0.70 (0.65, 1.01) % |
| Elastic Modulus (MPa) | 232 ± 36.7 | 220 (211, 235) |
| Yield Stress (MPa) | 1.19 ± 0.26 | 1.11 (1.06, 1.25) |
| Yield Strain | 0.75 ± 0.04 % | 0.74 (0.71, 0.79) % |
| Residual Strain | 0.14 ± 0.03 % | 0.14 (0.12, 0.14) % |
Figure 3.
(A) The histogram of volume per microdamage site; and (B) Microdamage surface to volume ratio are shown for a single specimen. Each specimen typically had 132 microdamage sites.
Figure 4.
(A) The distribution of microdamage generated by controlled mechanical testing (green) within cancellous bone (off-white) is shown in one specimen. (B) Microdamage (arrows) was often diffuse, but tended to be crack-like in that it was thin and broad.
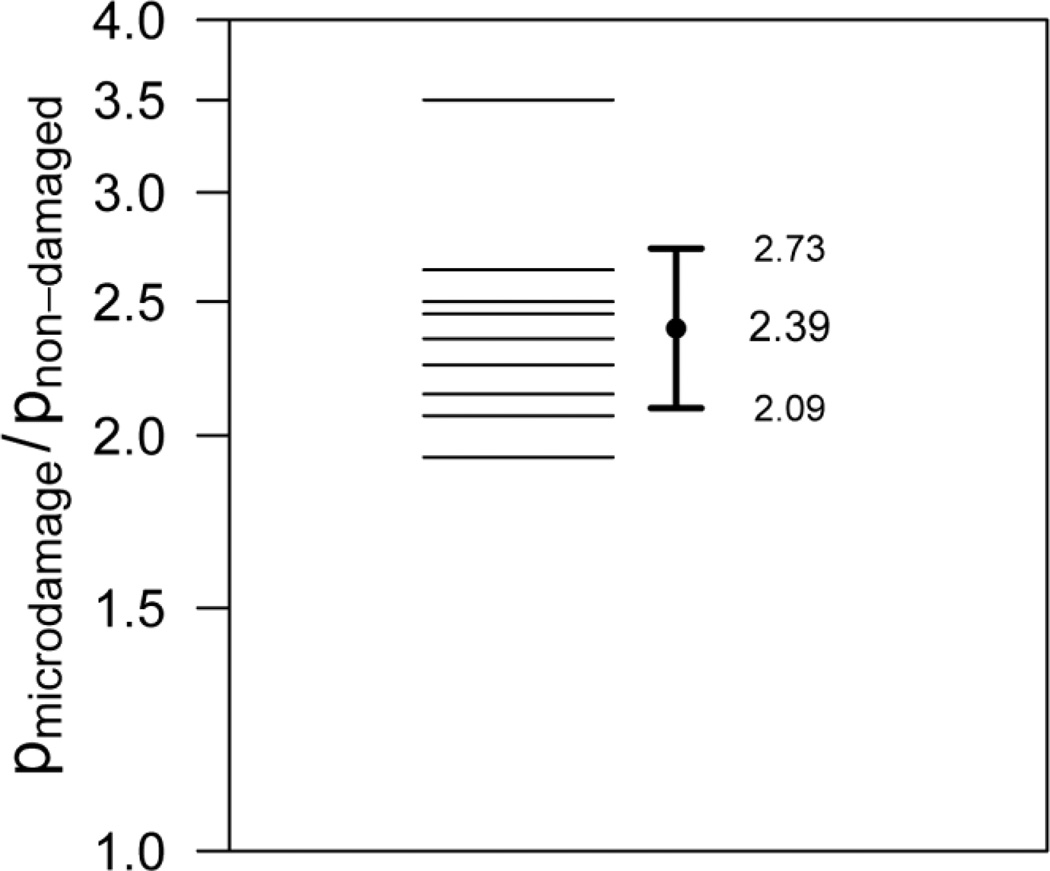
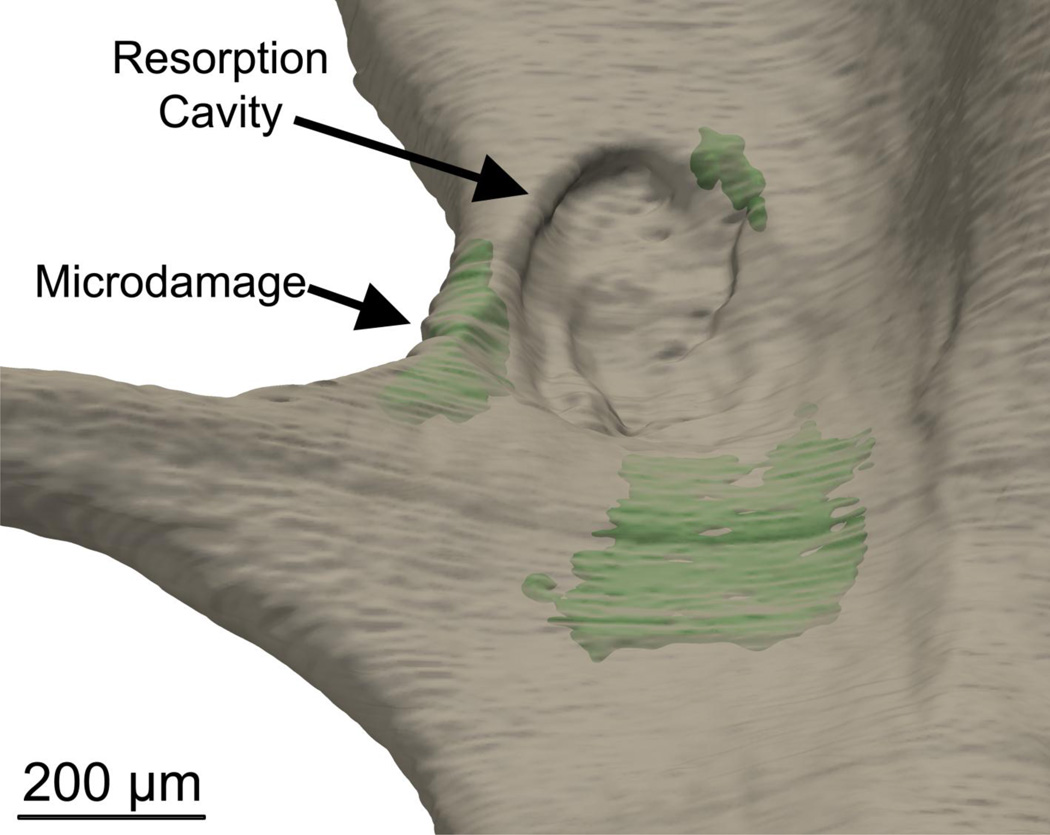
The proportion of microdamage sites with a neighboring resorption cavity was 85.3 ± 7.68%, while the proportion of non-damaged sites with resorption cavities was 36.1 ± 7.67% (Fig. 5, 6). The relative risk of a microdamage site having a neighboring resorption cavity was 2.39 (95% CI of relative risk 2.09 – 2.73, p < 0.001), demonstrating that microdamage caused by in vitro loading was greater than 2 times more likely to be near a resorption cavity.
Figure 5.
Sites of microdamage were more likely to be near cavities than non-damaged bone surfaces (p < 0.01). The ratio of the proportion of sites with cavities at sites of microdamage (pmicrodamage) to the proportion of sites with cavities without microdamage (pnon-damaged) is shown for all nine specimens. The geometric mean and 95% confidence is shown indicating that microdamage sites are 2.39 times more likely to be near a resorption cavity than non-damaged sites.
Figure 6.
Microscopic tissue damage generated by controlled mechanical loading (green) was more likely to be near resorption cavities.
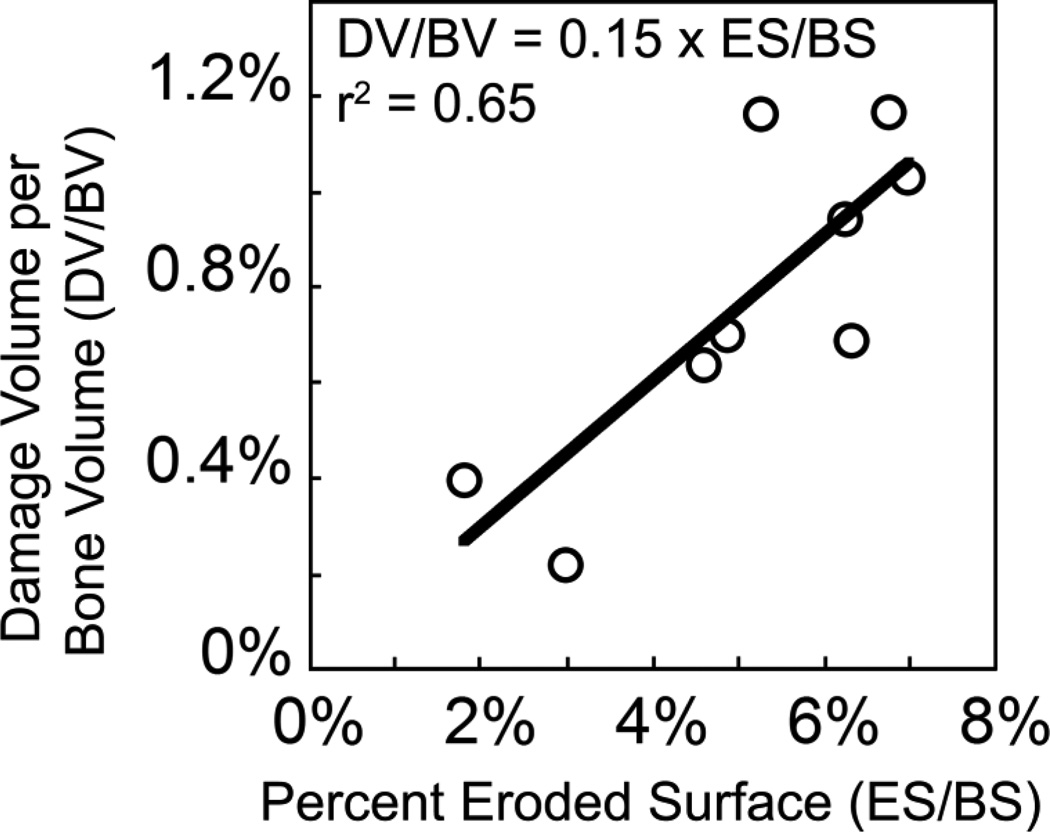
Damage volume per bone volume was positively correlated with percent eroded surface before and after controlling for the effects of bone volume fraction, indicating a relationship between microdamage and the amount of bone resorption in the entire specimen (Fig. 7, Table 2). No correlations between microdamage and mechanical properties were observed. No correlations between percent eroded surface and trabecular microarchitecture were observed (Table S1, Fig. S1). Young’s modulus and residual strain were correlated with bone volume fraction, bone specific surface (BS/TV), trabecular separation, and structure model index (Table S1). No correlations between yield strain and trabecular microarchitecture were observed. Yield stress was positively correlated with bone volume fraction and bone specific surface (Table S1, Fig. S1).
Figure 7.
Damage volume per bone volume (DV/BV) was positively correlated with percent eroded surface (ES/BS).
Table 2.
Correlation coefficients between static histomorphometry and mechanical properties and microdamage measures are shown (n=9 specimens, 95% confidence intervals in parentheses).
| DV/BV | Median Volume per Microdamage Site |
Average Damage Surface to Volume Ratio |
Number of Damage Sites per Bone Volume |
|
|---|---|---|---|---|
| ES / BS | 0.81 (0.31, 0.96)* | 0.13 (−0.58, 0.73) | 0.01 (−0.66, 0.67) | −0.30 (−0.81, 0.45) |
| BV / TV | 0.18 (−0.55, 0.75) | 0.41 (−0.35, 0.85) | −0.18 (−0.75, 0.55) | −0.48 (−0.87, 0.27) |
| BS/TV | 0.30 (−0.45, 0.81) | 0.15 (−0.57, 0.74) | −0.11 (−0.72, 0.60) | −0.18 (−0.75, 0.55) |
| Tb.Th | −0.14 (−0.73, 0.58) | 0.70 (0.08, 0.93)* | −0.23 (−0.77, 0.52) | −0.34 (−0.82, 0.42) |
| Tb.Sp | −0.07 (−0.70, 0.62) | −0.08 (−0.71, 0.62) | 0.01 (−0.66, 0.67) | 0.07 (−0.62, 0.70) |
| SMI | −0.33 (−0.82, 0.42) | 0.00 (−0.66, 0.66) | 0.12 (−0.59, 0.72) | 0.11 (−0.59, 0.72) |
| Conn.D | −0.05 (−0.69, 0.63) | −0.27 (−0.79, 0.48) | 0.10 (−0.61, 0.72) | 0.41 (−0.35, 0.84) |
| DA | −0.02 (−0.67, 0.65) | −0.24 (−0.78, 0.50) | −0.12 (−0.73, 0.59) | 0.72 (0.10, 0.94)* |
| Young’s Modulus | 0.11 (−0.58, 0.72) | −0.08 (−0.70, 0.62) | −0.18 (−0.76, 0.55) | −0.19 (−0.76, 0.55) |
| Yield Stress | −0.03 (−0.68, 0.65) | 0.04 (−0.64, 0.69) | −0.05 (−0.69, 0.63) | −0.31 (−0.81, 0.44) |
| Residual Strain | −0.24 (−0.78, 0.50) | −0.28 (−0.80, 0.48) | 0.14 (−0.58, 0.74) | 0.17 (−0.55, 0.75) |
| Yield Strain | −0.28 (−0.80, 0.47) | 0.27 (−0.48, 0.79) | 0.22 (−0.52, 0.77) | −0.42 (−0.85, 0.34) |
p < 0.05, full correlation scatterplots are provided in Fig. S1.
4. DISCUSSION
The current study demonstrates an association between microdamage generated in human vertebral cancellous bone and the amount of bone remodeling, measured as eroded surface. That the association between microdamage and resorption cavities was present when averaged over entire specimens (DV/BV v. ES/BS) as well as when using local measures of spatial correlation (relative risk of a cavity being near a microdamage site) provides strong evidence that failure processes in cancellous bone tissue are influenced by the presence of resorption cavities.
There are a number of strengths to the current study that lend confidence to the results. First, our method of imaging microdamage in three-dimensions has previously been validated against conventional two-dimensional approaches [25]. Second, the spatial correlation between resorption cavities and microdamage was performed in such a manner that the observer could not simultaneously view both the bone surface and neighboring microdamage. In conventional histology sections, it is not possible for an observer to be completely blinded to neighboring morphology (it is not possible to view resorption cavities in a stained histology section without also seeing neighboring microdamage and vice versa). Additionally, resorption cavities were identified not only as indentations on the cancellous bone surface in three-dimensions, but also through observation of the eroded surface (the standard method of observing resorption surfaces in traditional histomorphometry).
There were a few limitations that must be considered when interpreting our results. First, it is important to note that we have shown that microdamage sites in cancellous bone are more likely to be near resorption cavities. We have not demonstrated that resorption cavities can predict where microdamage is likely to form. Determining if resorption cavities can predict where microdamage will form is more challenging because it would be influenced by the load distribution within the cancellous bone microstructure. A cavity present on a trabecula that carries little load under apparent compression would be unlikely be associated with microdamage, yet the same cavity might be associated with microdamage if the specimen were loaded in bending or shear. Finite element modeling is required to account for load distributions and to determine if microdamage is forming at locations where mechanical stress or strain are greatest. Second, the current study did not identify a correlation between resorption cavities and apparent mechanical properties. One explanation may be that the current study only examined elastic and yield properties (Young’s modulus, yield strain, yield strength, residual strain from loading to apparent yield) under a single, uniaxial load. The current study was not designed to examine post-yield properties, which are presumably influenced by the accumulation of microdamage. Additionally, it is possible that microdamage associated with resorption cavities has a greater effect on cancellous bone submitted to more than one loading cycle (cyclic fatigue or reloading after an isolated overloading event). It has been shown that cancellous bone submitted to a compressive overload experiences large reductions in Young’s modulus upon reloading, presumably as a result of microdamage caused during the overload [19, 21]. The exact relationship between microdamage (measured with histology) and reductions in mechanical properties upon reloading remains to be determined. Lastly, the current study identified resorption cavities based on bone surface morphology and did not determine the presence of active osteoclasts on bone surfaces. Hence, the current assay of resorption cavities is morphological and does not provide information regarding active bone resorption. However, from a biomechanical perspective, cavity morphology is likely to influence local tissue stresses/strains whether active osteoclasts are present or not.
The current study adds to our understanding of failure processes and microdamage in cancellous bone. While the standard method of measuring microdamage is examination of histology sections [33–35], three-dimensional images of microdamage in cancellous bone have been achieved using serial milling [25] as well as micro-computed tomography with radiopaque stains (lead uranyl acetate [36] and barium sulfate [37]). The serial milling/fluorochrome staining technique used in the current study has a few advantages over micro-computed tomography/radiopaque staining methods. First, serial milling can be performed with a sub-micron in-plane resolution (0.7 × 0.7 × 5.0 µm) on an entire cancellous bone specimen (8 mm in diameter). We have previously shown that a voxel size of 1.4 µm in-plane or less is required to detect individual resorption cavities [24]. Most micro-computed tomography devices can only achieve voxel sizes below 2 µm in small specimens (typical maximum overall specimen size is ~1 mm) and therefore cannot examine resorption cavities in entire cancellous bone structures (4–5 mm or larger in size). Additionally, because our technique uses water soluble fluorochromes, we are able to perform sequential staining [26, 34, 38], potentially allowing future studies of crack propagation. Lastly, serial milling/fluorochrome staining so far appears to be a more precise measurement approach than radiopaque stains. The coefficient of variation (SD/mean) of measures of damage volume per bone volume in the current study (42.8%) was comparable to that reported previously using serial milling (44.7%) [25] but much lower than that reported for two-dimensional techniques or radiopaque staining, which ranged from 53% – 146% (the one exception is a study by Tang et al. 2007 in which variance among specimens was controlled by using tissue from only one donor) [36, 37, 39, 40]. High variance can make it challenging to detect differences among study groups [41]. The amount of signal noise and non-specific staining may also differ between serial milling/flourochrome staining and micro-computed tomography/radiopaque stains. Very little microdamage is detected using pre-stains with fluorochromes or unloaded specimens subjected to lead uranyl acetate [25, 36, 42], while unloaded specimens submitted to barium sulfate staining have reported amounts of microdamage (1.23 ± 0.81%) that are greater than what we observed in loaded specimens in the current study (0.77 ± 0.33%) [37]. As there has never been a direct comparison of serial milling/fluorochrome staining, lead uranyl acetate and barium sulfate staining, it is unclear if the differences are due to image resolution and partial volume effects, signal-to-noise ratio, or the chemistry of the damage stains themselves (how they adhere to bone surfaces or precipitate within bone voids). A disadvantage of the serial milling/fluorochrome staining approach as compared to micro-computed tomography/radiopaque staining is the image acquisition time (approximately 1.5 weeks per specimen when using serial milling and only a few hours with micro-computed tomography).
In the current study, microdamage sites tended to be crack-like, as indicated by high surface to volume ratios. Others have used the surface to volume ratio of individual microdamage sites to quantify the aspect ratio of individual microdamage sites and classify microdamage sites as crack-like or diffuse [43]. Our measures of microdamage site surface to volume ratio (601 ± 44.5 mm−1) were substantially larger than those reported by others using lead uranyl acetate staining and micro-computed tomography (80 ± 15 mm−1) [40, 43]. There are a number of reasons we believe the surface to volume ratio differed between the two studies. First, our study used a much smaller voxel size (2.8 µm voxels for microdamage analysis as compared to 10.5 µm used with lead uranyl acetate). It is well known that the resolution of an image greatly influences measures of perimeter and surface area. Second, the signal-to-noise ratio of lead-uranyl acetate, used previously, is substantially higher than that of fluorescently labeled microdamage used in the current study. The increase in signal-to-noise ratio combined with a 10 fold larger voxel size could greatly influence the surface morphology of microdamage sites through partial volume effects.
There remain many unanswered questions regarding the ability of resorption cavities to influence cancellous bone biomechanics at the apparent level (5mm in smallest dimension) or clinical fracture risk. First, the magnitude of the stress concentration caused by a resorption cavity will be influenced by the depth and breadth of the cavity, the thickness of the trabecula upon which the cavity is located and the type of loads applied (tension, bending, etc.). Very little is known regarding the distribution of resorption cavity size and location in cancellous bone or how aging, disease state and drug treatments might influence cavity size and location. Second, the current study has concentrated on the appearance of microdamage in cancellous bone in vitro, but has not addressed the biological repercussions of microdamage. In cortical bone, microdamage generated in vivo has been spatially and temporally associated with new bone resorption [44]. If microdamage is also a stimulus for bone resorption in cancellous bone, microdamage formed near a resorption cavity might promote additional bone resorption (either larger or more numerous resorption cavities), leading to rapid local bone loss in a vicious cycle. It remains to be determined if microdamage stimulates new bone resorption in cancellous bone in a way that leads to impaired biomechanical performance.
5. Conclusions
Our findings demonstrate that the very presence of resorption cavities in cancellous bone can influence mechanical failure processes in cancellous bone such as microdamage formation. While bone remodeling is commonly believed to be a process for repairing old or damaged bone tissue, the current study suggests that bone remodeling can also have a detrimental effect on the mechanical behavior of cancellous bone.
Highlights.
>We examine microdamage caused by compressive loading of cancellous bone. > We found that microdamage is much more likely to form around resorption cavities. > Damage volume fraction (DV/BV) was strongly correlated with eroded surface. > Resorption cavities promote local mechanical failure and may impair bone strength
Supplementary Material
Correlations between measures of trabecular microarchitecture, microdamage, and mechanical properties are shown.
ACKNOWLEDGEMENTS
Supported by NIH/NIAMS R01 AR057362 (CJH).
Authors’ roles: Study design: CRS, RGO, and CJH. Mechanical testing and associated data analysis: IHY, MGJ, and TMK. Image collection and analysis: CRS, EVT, SEF, KME and CJH. Statistical Analysis: RGO, CRS, and CJH. Drafting manuscript: CRS and CJH. Revising manuscript content: CRS and CJH. Approving final version of manuscript: CRS, EVT, SEF, KME, IHY, MGJ, RGO, TMK, and CJH. CJH takes responsibility for the integrity of the data analysis.
Disclosure Statement: Dr. Keaveny has served as a consultant for or has had research support from Amgen, GSK, Lilly, Merck, Novartis, Proctor & Gamble, and Pfizer. He has a financial interest in O.N. Diagnostics and both he and the company may benefit from the results of this research. Dr. Hernandez has received speaker honoraria and research funding from the Musculoskeletal Transplant Foundation.
Footnotes
Publisher's Disclaimer: This is a PDF file of an unedited manuscript that has been accepted for publication. As a service to our customers we are providing this early version of the manuscript. The manuscript will undergo copyediting, typesetting, and review of the resulting proof before it is published in its final citable form. Please note that during the production process errors may be discovered which could affect the content, and all legal disclaimers that apply to the journal pertain.
All other authors have no conflicts of interest.
References
- 1.Garnero P. Markers of bone turnover for the prediction of fracture risk. Osteoporos Int. 2000;11(Suppl 6):S55–S65. doi: 10.1007/s001980070006. [DOI] [PubMed] [Google Scholar]
- 2.Szulc P, Delmas P. Biochemical markers of bone turnover in osteoporosis. In: Marcus R, Feldman D, Nelson DA, Rosen CJ, editors. Osteoporosis. San Diego, CA, USA: Academic Press; 2008. pp. 1519–1545. [Google Scholar]
- 3.Heaney RP. Is the paradigm shifting? Bone. 2003;33:457–465. doi: 10.1016/s8756-3282(03)00236-9. [DOI] [PubMed] [Google Scholar]
- 4.Seeman E, Delmas PD. Bone quality--the material and structural basis of bone strength and fragility. N Engl J Med. 2006;354:2250–2261. doi: 10.1056/NEJMra053077. [DOI] [PubMed] [Google Scholar]
- 5.Dempster DW. The contribution of trabecular architecture to cancellous bone quality. J Bone Miner Res. 2000;15:20–23. doi: 10.1359/jbmr.2000.15.1.20. [DOI] [PubMed] [Google Scholar]
- 6.Parfitt AM. High bone turnover is intrinsically harmful: two paths to a similar conclusion. The Parfitt view. J Bone Miner Res. 2002;17:1558–1559. doi: 10.1359/jbmr.2002.17.8.1558. [DOI] [PubMed] [Google Scholar]
- 7.Hernandez CJ. How can bone turnover modify bone strength independent of bone mass? Bone. 2008;42:1014–1020. doi: 10.1016/j.bone.2008.02.001. [DOI] [PMC free article] [PubMed] [Google Scholar]
- 8.Smit TH, Burger EH. Is BMU-coupling a strain-regulated phenomenon? A finite element analysis. J Bone Miner Res. 2000;15:301–307. doi: 10.1359/jbmr.2000.15.2.301. [DOI] [PubMed] [Google Scholar]
- 9.McNamara LM, van der Linden JC, Weinans H, Prendergast PJ. Stress-concentrating effect of resorption lacunae in trabecular bone. J Biomech. 2006;39:734–741. doi: 10.1016/j.jbiomech.2004.12.027. [DOI] [PubMed] [Google Scholar]
- 10.Eswaran SK, Allen MR, Burr DB, Keaveny TM. A computational assessment of the independent contribution of changes in canine trabecular bone volume fraction and microarchitecture to increased bone strength with suppression of bone turnover. J Biomech. 2007;40:3424–3431. doi: 10.1016/j.jbiomech.2007.05.013. [DOI] [PMC free article] [PubMed] [Google Scholar]
- 11.van der Linden JC, Homminga J, Verhaar JA, Weinans H. Mechanical consequences of bone loss in cancellous bone. J Bone Miner Res. 2001;16:457–465. doi: 10.1359/jbmr.2001.16.3.457. [DOI] [PubMed] [Google Scholar]
- 12.Hernandez CJ, Gupta A, Keaveny TM. A biomechanical analysis of the effects of resorption cavities on cancellous bone strength. J Bone Miner Res. 2006;21:1248–1255. doi: 10.1359/jbmr.060514. [DOI] [PMC free article] [PubMed] [Google Scholar]
- 13.Vashishth D, Koontz J, Qiu SJ, Lundin-Cannon D, Yeni YN, Schaffler MB, Fyhrie DP. In vivo diffuse damage in human vertebral trabecular bone. Bone. 2000;26:147–152. doi: 10.1016/s8756-3282(99)00253-7. [DOI] [PubMed] [Google Scholar]
- 14.Fazzalari NL, Vernon RB, Darracott J. Osteoarthritis of the hip. Possible protective and causative roles of trabecular microfractures in the head of the femur. Clin Orthop. 1987 [PubMed] [Google Scholar]
- 15.Nagaraja S, Couse TL, Guldberg RE. Trabecular bone microdamage and microstructural stresses under uniaxial compression. J Biomech. 2005;38:707–716. doi: 10.1016/j.jbiomech.2004.05.013. [DOI] [PubMed] [Google Scholar]
- 16.O'Neal JM, Diab T, Allen MR, Vidakovic B, Burr DB, Guldberg RE. One year of alendronate treatment lowers microstructural stresses associated with trabecular microdamage initiation. Bone. 2010;47:241–247. doi: 10.1016/j.bone.2010.05.016. [DOI] [PMC free article] [PubMed] [Google Scholar]
- 17.Morgan EF, Bayraktar HH, Yeh OC, Majumdar S, Burghardt A, Keaveny TM. Contribution of inter-site variations in architecture to trabecular bone apparent yield strains. J Biomech. 2004;37:1413–1420. doi: 10.1016/j.jbiomech.2003.12.037. [DOI] [PubMed] [Google Scholar]
- 18.Morgan EF, Yeh OC, Keaveny TM. Damage in trabecular bone at small strains. Eur J Morphol. 2005;42:13–21. doi: 10.1080/09243860500095273. [DOI] [PubMed] [Google Scholar]
- 19.Keaveny TM, Wachtel EF, Kopperdahl DL. Mechanical behavior of human trabecular bone after overloading. J Orthop Res. 1999;17:346–353. doi: 10.1002/jor.1100170308. [DOI] [PubMed] [Google Scholar]
- 20.Moore TL, Gibson LJ. Fatigue microdamage in bovine trabecular bone. J Biomech Eng. 2003;125:769–776. doi: 10.1115/1.1631584. [DOI] [PubMed] [Google Scholar]
- 21.Garrison JG, Slaboch CL, Niebur GL. Density and architecture have greater effects on the toughness of trabecular bone than damage. Bone. 2009;44:924–929. doi: 10.1016/j.bone.2008.12.030. [DOI] [PMC free article] [PubMed] [Google Scholar]
- 22.Mosekilde L. Consequences of the remodelling process for vertebral trabecular bone structure: a scanning electron microscopy study (uncoupling of unloaded structures) Bone Miner. 1990;10:13–35. doi: 10.1016/0169-6009(90)90046-i. [DOI] [PubMed] [Google Scholar]
- 23.Slyfield CR, Jr, Niemeyer KE, Tkachenko EV, Tomlinson RE, Steyer GG, Patthanacharoenphon CG, Kazakia GJ, Wilson DL, Hernandez CJ. Three-dimensional surface texture visualization of bone tissue through epifluorescence-based serial block face imaging. J Microsc. 2009;236:52–59. doi: 10.1111/j.1365-2818.2009.03204.x. [DOI] [PMC free article] [PubMed] [Google Scholar]
- 24.Tkachenko EV, Slyfield CR, Tomlinson RE, Daggett JR, Wilson DL, Hernandez CJ. Voxel size and measures of individual resorption cavities in three-dimensional images of cancellous bone. Bone. 2009;45:487–492. doi: 10.1016/j.bone.2009.05.019. [DOI] [PMC free article] [PubMed] [Google Scholar]
- 25.Bigley RF, Singh M, Hernandez CJ, Kazakia GJ, Martin RB, Keaveny TM. Validity of serial milling-based imaging system for microdamage quantification. Bone. 2008;42:212–215. doi: 10.1016/j.bone.2007.09.043. [DOI] [PubMed] [Google Scholar]
- 26.O'Brien FJ, Taylor D, Lee TC. An improved labelling technique for monitoring microcrack growth in compact bone. J Biomech. 2002;35:523–526. doi: 10.1016/s0021-9290(01)00200-7. [DOI] [PubMed] [Google Scholar]
- 27.Bevill G, Eswaran SK, Farahmand F, Keaveny TM. The influence of boundary conditions and loading mode on high-resolution finite element-computed trabecular tissue properties. Bone. 2009;44:573–578. doi: 10.1016/j.bone.2008.11.015. [DOI] [PubMed] [Google Scholar]
- 28.Morgan EF, Yeh OC, Chang WC, Keaveny TM. Nonlinear behavior of trabecular bone at small strains. J Biomech Eng. 2001;123:1–9. doi: 10.1115/1.1338122. [DOI] [PubMed] [Google Scholar]
- 29.Slyfield CR, Tkachenko EV, Wilson DL, Hernandez CJ. Three-dimensional dynamic bone histomorphometry. Journal of bone and mineral research : the official journal of the American Society for Bone and Mineral Research. 2011;27:486–495. doi: 10.1002/jbmr.553. [DOI] [PMC free article] [PubMed] [Google Scholar]
- 30.Russ JC. The Image Processing Handbook. 5th. Boca Raton, FL, USA: CRC Press; 2007. [Google Scholar]
- 31.Howard CV, Reed MG. Unbiased Stereology: Three Dimensional Measurement in Microscopy. New York, NY: Springer-Verlag; 1998. [Google Scholar]
- 32.Doube M, Klosowski MM, Arganda-Carreras I, Cordelieres FP, Dougherty RP, Jackson JS, Schmid B, Hutchinson JR, Shefelbine SJ. BoneJ: Free and extensible bone image analysis in ImageJ. Bone. 2010;47:1076–1079. doi: 10.1016/j.bone.2010.08.023. [DOI] [PMC free article] [PubMed] [Google Scholar]
- 33.Moore TLA, Gibson LJ. Microdamage accumulation in bovine trabecular bone in uniaxial compression. J Biomech Eng. 2002;124:63–71. doi: 10.1115/1.1428745. [DOI] [PubMed] [Google Scholar]
- 34.Wang X, Niebur GL. Microdamage propagation in trabecular bone due to changes in loading mode. J Biomech. 2006;39:781–790. doi: 10.1016/j.jbiomech.2005.02.007. [DOI] [PubMed] [Google Scholar]
- 35.Dux SJ, Ramsey D, Chu EH, Rimnac CM, Hernandez CJ. Alterations in damage processes in dense cancellous bone following gamma-radiation sterilization. J Biomech. 2010;43:1509–1513. doi: 10.1016/j.jbiomech.2010.01.042. [DOI] [PubMed] [Google Scholar]
- 36.Tang SY, Vashishth D. A non-invasive in vitro technique for the three-dimensional quantification of microdamage in trabecular bone. Bone. 2007;40:1259–1264. doi: 10.1016/j.bone.2006.10.031. [DOI] [PMC free article] [PubMed] [Google Scholar]
- 37.Wang X, Masse DB, Leng H, Hess KP, Ross RD, Roeder RK, Niebur GL. Detection of trabecular bone microdamage by micro-computed tomography. J Biomech. 2007 doi: 10.1016/j.jbiomech.2007.05.009. [DOI] [PMC free article] [PubMed] [Google Scholar]
- 38.Lee TC, Arthur TL, Gibson LJ, Hayes WC. Sequential labelling of microdamage in bone using chelating agents. J. Orthop Res. 2000;18:322–325. doi: 10.1002/jor.1100180222. [DOI] [PubMed] [Google Scholar]
- 39.Nagaraja S, Lin AS, Guldberg RE. Age-related changes in trabecular bone microdamage initiation. Bone. 2007;40:973–980. doi: 10.1016/j.bone.2006.10.028. [DOI] [PubMed] [Google Scholar]
- 40.Karim L, Vashishth D. Role of trabecular microarchitecture in the formation, accumulation, and morphology of microdamage in human cancellous bone. J Orthop Res. 2011;29:1739–1744. doi: 10.1002/jor.21448. [DOI] [PMC free article] [PubMed] [Google Scholar]
- 41.Ehlert KM, O'Brien RG, Hernandez CJ. Statistical power in measures of microscopic tissue damage in cancellous bone. Annual Meeting of the American Society for Bone and Mineral Research. 2011:M0052. [Google Scholar]
- 42.Wang X, Guyette J, Liu X, Roeder RK, Niebur GL. Axial-shear interaction effects on microdamage in bovine tibial trabecular bone. Eur J Morphol. 2005;42:61–70. doi: 10.1080/09243860500095570. [DOI] [PubMed] [Google Scholar]
- 43.Tang SY, Vashishth D. Non-enzymatic glycation alters microdamage formation in human cancellous bone. Bone. 2010;46:148–154. doi: 10.1016/j.bone.2009.09.003. [DOI] [PMC free article] [PubMed] [Google Scholar]
- 44.Bentolila V, Boyce TM, Fyhrie DP, Drumb R, Skerry TM, Schaffler MB. Intracortical remodeling in adult rat long bones after fatigue loading. Bone. 1998;23:275–281. doi: 10.1016/s8756-3282(98)00104-5. [DOI] [PubMed] [Google Scholar]
Associated Data
This section collects any data citations, data availability statements, or supplementary materials included in this article.
Supplementary Materials
Correlations between measures of trabecular microarchitecture, microdamage, and mechanical properties are shown.


