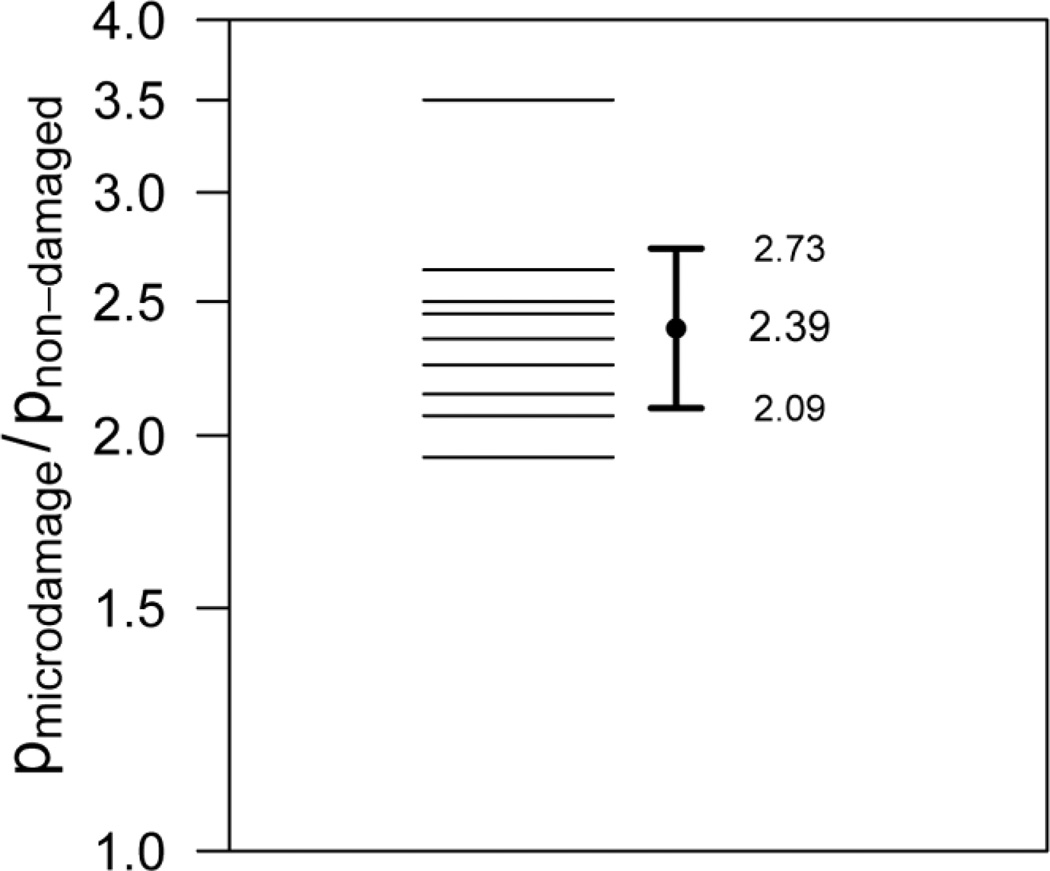
Figure 5.
Sites of microdamage were more likely to be near cavities than non-damaged bone surfaces (p < 0.01). The ratio of the proportion of sites with cavities at sites of microdamage (pmicrodamage) to the proportion of sites with cavities without microdamage (pnon-damaged) is shown for all nine specimens. The geometric mean and 95% confidence is shown indicating that microdamage sites are 2.39 times more likely to be near a resorption cavity than non-damaged sites.

