

Abstract
Age related memory decline is the consequence of multiple biological factors that lead to brain structural and functional change, including gray matter atrophy, white matter injury, and loss of functional coordination between regions. However, the independent roles that each of these brain changes play in mediating memory decline is not clear. Therefore, we used magnetic resonance imaging (MRI) to measure gray matter volume (GM), white matter hyperintensities (WMH) volumes, and BOLD fMRI based functional connectivity among default mode network nodes in 76 cognitive normal older adults. We found that GM, WMH and connectivity between left inferior parietal and medial prefrontal cortex (MPF_LIP) were independently associated with episodic memory performance. Within the group with GM volumes below the median, greater MPF_LIP connectivity was associated with better memory performance, whereas this association was not present for individuals with GM volume above the median. These findings confirm the heterogeneous nature of brain-behavior relationships in cognitive aging. In addition, the relationship between resting state functional connectivity and memory performance, particularly amongst those individuals with more brain atrophy, strongly suggests compensation against the effects of neuronal injury.
Keywords: MRI measures, Gray matter, white matter hyperintensity, resting-state MRI, Functional connectivity, Episodic memory performance
Introduction
Decline in memory performance is a hallmark of the aging process.[11,12] Successful performance on memory tasks, including encoding, consolidation, and retrieval, requires recruitment of several brain regions within medial temporal[31,38,39], prefrontal, and parietal cortical areas.[10,18,40] While activity in these regions tends to increase during memory task performance, activity in an additional set of brain regions in the prefrontal, parietal, precuneus, posterior cingulate, and medial temporal cortices, termed the default network (DMN), correspondingly decreases [28]. Because BOLD fMRI based measures of connectivity among nodes in the DMN are known to be associated with memory performance in cognitively-healthy elderly individuals[4] [9], DMN connectivity has emerged as a potentially novel and sensitive measure of subtle brain injury associated with diminished cognition among otherwise healthy elders.
However, the independent value of DMN connectivity as a marker of age-related memory decline is unclear because its reductions occur against a backdrop of aging-associated neuronal injury [32][14]. Advancing age is associated with reduced integrity of white matter (WM) in frontal regions that participate in memory function [25,27] as well as posterior regions [20,21]; white matter hyperintensities (WMH) are common [47] and can reflect damage to WM pathways required for memory performance [26]. Gray matter (GM) volume loss across the brain in older adults is also prominent, especially in frontal regions required for memory function [29]. Growing evidence suggests that both GM and WM injury may independently contribute to age-related memory declines [2][15].
Thus, in the context of brain aging, it is unclear whether DMN connectivity reduction is simply a downstream result of injury to the underlying neuronal architecture, a functional consequence of neuropathology on cognition independent of structural injury to neurons (e.g. functional toxicity[34]), a background factor that helps to buffer the brain against the effects of neuronal injury, or some combination of all these factors. Addressing the independent role that DMN integrity has on cognitive aging in the absence of clinical impairment, therefore, may prove important to understanding some of the most basic mechanisms by which older individuals either maintain memory ability or develop impairment in memory.
In this study, we examined the independent effects of GM volume, WMH, and DMN integrity on memory performance in a group of cognitively normal older adults. We hypothesized that because aging-associated brain changes exacerbate neuronal dysfunction, even among neurons that are not yet structurally injured, retained coordination among DMN nodes would be associated with better memory performance even after accounting for the effects of GM and WM injury on memory performance.
Materials and Methods
Participants
This study included individuals over the age of 60 who were clinically categorized as cognitively normal using standardized criteria based on a multi-disciplinary clinical evaluation (see Clinical Evaluation section). Participants who had unstable major medical illness (i.e., any severe condition requiring emergency medical care at recurrent and unforeseen times), major primary psychiatric disorder (history of schizophrenia, bipolar disorder, or recurrent major depression), or substance abuse or dependence in the last five years were excluded from the study. Chronic cardiovascular conditions that allow independent daily functioning, such as hypertension and diabetes, were not excluded. Each of the participants signed an informed consent approved by the University of California (UC) Davis Institution Review Board. A total of 76 participants were included in our study; 67(88%) were from community recruitment and 9 (12%) from memory clinic referral.
Clinical Evaluation
Each participant received a multidisciplinary clinical evaluation through the UC Davis, Alzheimer’s Disease Center, which included a detailed medical history and physical and neurological examination. All participants received a standardized neuropsychological test battery (these diagnostic tests are distinct from the outcome measure used in analyses). Participants who had no clinically significant cognitive impairment (defined as performing better than −1.5 standard deviations below age and education adjusted means) were considered to have normal cognition. The UC Davis institutional review board approved this study, and all subjects provided written informed consent.
Structural MRI
Brain imaging was obtained at the UC Davis Imaging Research Center on a 1.5 T GE Signa Horizon LX Echospeed system and at the Veterans Affairs Medical Center, Martinez, CA on a 1.5 T Marconi system.
Segmentation of GM, white matter (WM) and cerebrospinal fluid (CSF) was performed on native T1-weighted SPGR images by an in-house implementation of a Bayesian maximum-likelihood EM method.[8] Non-brain elements were manually removed from FLAIR images by operator guided tracing of the dura matter in the cranial vault. The resulting corrected image was modeled as a mixture of 2 gaussian probability functions with the segmentation threshold determined at the minimum probability between these 2 distributions, followed by a single gaussian distribution fitted to the image data using an a priori threshold of 3.5 SD in pixel intensity above the mean to identify WMH. Intrarater and interrater reliability of these methods are high and have been published previously.[6]
The boundaries of the hippocampus were manually traced according to previously described methods[7]. Intrarater reliability for both the right and left hippocampus using this method is good, with intraclass correlation coefficients of 0.98 for the right hippocampus and 0.96 for the left hippocampus.
Functional MRI
Image acquisition
Participants received resting echo-planar imaging (EPI) BOLD fMRI scans with no specific instructions for 8 minutes using the following parameters: time repetition (TR) = 2.0s; time echo (TE) = 40ms; flip angle = 90°; skip = 0 mm; slice thickness = 5mm; 24 slices. This sequence provided 240 time points of time series data.
fMRI preprocessing
Temporal and spatial processing of the fMRI data were performed in Statistical Parametric Mapping (SPM5, http://www.fil.ion.ucl.ac.uk/spm). The first four time points were discarded to eliminate the non-equilibrium effects of magnetization.[35] Images for the remaining time points were corrected for slice timing, aligned to the first time point image to correct for head motion, then normalized to the MNI template and smoothed with a Gaussian kernel (6 mm FWHM). Time points with large head motion, defined as translation greater than 1.5mm and/or rotation greater than 1.5° were then discarded, and participants with fewer than 178 total time points were excluded. Data were then de-trended and filtered using Resting-State fMRI Data Analysis Toolkit V1.3 (REST1.3, http://restfmri.net/forum/?q=rest). Specifically, time series at each voxel were band-pass filtered to preserve frequency components between 0.01 and 0.08 Hz. Time courses of estimated head motion parameters were regressed out of the resulting time series. In addition, three mean time series were estimated by taking the average time series for all voxels labeled as WM, CSF, and the entire brain respectively. These three mean time series were regressed out of each voxel’s time series [22,37].
ROI selection
In order to isolate the DMN from the rest of the brain, we followed the steps below.
Since the posterior cingulate cortex (PCC) plays an important role in the DMN, a functional connectivity (FC) map was initially computed for each subject using a seed voxel (MNI coordinate: 1, −53, 26) in PCC. After the average time series of all voxels within an 8mm sphere of that PCC seed was calculated, Pearson correlation was performed between that time series and the time series of each other voxel in the brain. A map of resulting Pearson correlation coefficients, referred to as the PCC functional connectivity (FC) map, was then created.
A one-sample T test was applied to Fisher-Z transformed PCC FC maps of all subjects and the resulting T statistics map was thresholded (T > 6.0) to identify brain regions that were highly functionally connected to PCC. Significant clusters were found in the remainder of the PCC, medial prefrontal cortex (MPF), and left and right inferior parietal cortices (LIP, RIP). The voxel with the highest T value in the each cluster (MPF, LIP and RIP) was then selected as seed voxels for calculating FC maps.
The FC maps of MPF, LIP and RIP were calculated respectively for each individual using the seed voxels created above, using the same method that was used to obtain the PCC FC map.
One sample T tests were performed for MPF, LIP and RIP Fisher-Z transformed FC maps respectively and the resulting T maps were all thresholded (T > 6.0).
An average T map was created by averaging the PCC, LIP, RIP, and MPF T maps. The voxels with the maximum average T value within the PCC (MNI coordinate: −3, −54, 30), MPF (−3, 63, 24) LIP (−45, −69, 39), and RIP (54, −66, 33) were then identified and a 4 mm sphere around each of those voxels was defined as our default mode network ROI.
Average time series for all voxels within each ROI were calculated. Pearson correlation analyses between all possible pairs of ROIs were then applied. The resulting correlation coefficients were Fisher Z transformed, and the absolute values were then used in statistical analyses.
Outcome measure
Neuropsychological measures
Spanish and English Neuropsychological Assessment Scales (SENAS) were used to measure specific domains of cognitive functioning. Psychometric properties of the resulting scales have been published.[24] This study used the SENAS episodic memory (EM) composite score, which included the average of two word list tasks. This composite measured both learning (item acquisition) and delayed recall of verbal memory. The scores consisted solely of number of correct hits with no adjustment for false alarms.
Statistical analyses
The WMH, GM and hippocampal volumes were normalized by intracranial volume (percentage of intracranial volume) to avoid confounding effects of head size. The WMH volumes were also log transformed to better approximate a normal distribution for analysis. Since GM and WMH are significantly correlated, a new WMH variable was created by regressing GM against WMH; this adjusted WMH value was used in place of WMH in multivariate regressions with both variables as predictors1. In addition, since age is strongly associated with some pathological processes which could exist in cognitively normal adults[5], such as AD associated GM atrophy and cerebral vascular disease associated WMH burden, we created a measurement of age that was independent of GM and WMH by calculating the residual resulting from the linear regression of age against WMH and GM volumes. This adjusted age variable represents brain injury burden that accumulates with age but is not directly reflected in GM or WMH. Gender, education and adjusted age were controlled for all multiple regression models, and the outcome measure was episodic memory in every regression model. Initially, one regression model per MRI measure (including connectivity measures, GM, and WMH) was performed to assess their associations with episodic memory. Significant predictors in these single-MRI-predictor models were all entered simultaneously into one multiple-MRI-predictor model to explore their independent effects on memory. In addition, while hippocampal volume was not significantly associated with episodic memory in the single-MRI-predictor model, we estimated an additional multiple-MRI-predictor model including it due to the central role it plays in the literature on healthy and pathological brain aging. For both multiple-MRI-predictor models, we calculated the variance inflation factor (VIF) to assess the effects of collinearities among predictors on model estimates. VIF values lower than 5 suggest minimal effects of collinearity. Finally, correlations amongst the various brain measures were also calculated.
Since initial analyses (shown below) suggested that both GM and MPF-LIP connectivity were positively associated with cognitive performance, we tested the hypothesis that the association between connectivity and memory performance may differ according to GM, with connectivity helping to compensate against the damaging effects of low GM on memory performance. First, we estimated a similar multiple-MRI-predictor model as above with an interaction term for MPF_LIP and GM to assess whether the relation between MPF_LIP and episodic memory varies linearly over the range of GM. Further, to assess the possibility that the relation between MPF_LIP and episodic memory varies non-linearly across the range of GM values, we split the sample into two groups according to median GM volume and repeated multiple-MRI-predictor modeling separately in each group. Two sample t-tests (for continuous variables) and chi-square tests (for categorical ones) were used to detect differences in demographics, cognitive performance, and MRI measures between the two groups.
Given that a subgroup of individuals had excessive movement resulting in removal of individual images from their time series, reliability tests were performed for 66 participants for whom time points had not been removed, using the same multiple-MRI-predictor models as above.
All statistical analyses were performed in JMP8 (SAS institute, Cary, NC), and p values smaller than 0.05 were considered statistically significant.
Results
Participant characteristics
A total of 76 cognitively normal individuals ranging in age from 62 to 91 years were included in our study. The characteristics of the participants are shown in Table 1 for the entire group and individual groups created by median split along GM volume as described above. Individuals with GM volume below the median were significantly older, were more likely to be male, had significantly smaller hippocampi and performed significantly worse on the EM task. Age was significantly associated with GM (r = −0.32, p = 0.005), WMH burden (r = 0.35, p = 0.002) and episodic memory (r = −0.36, p =0.002) but not with any DMN connectivity measure (all |r| < 0.1, p > 0.05).
Table 1.
Characteristics of participants
| All participants N=76 | High GM participants N=39 | Low GM participants N=37 | Group Difference (P value) | |
|---|---|---|---|---|
| Age (years) | 74.3(7.0) | 72.6(6.4) | 76.1(6.8) | 0.02 |
| Gender (Male/Female) | 24/52 | 7/32 | 17/20 | 0.01 |
| Education Years | 12.5 (4.9) | 11.9(5.7) | 13.2(4.0) | 0.28 |
| MPF_LIP | 0.30 (0.17) | 0.31(0.18) | 0.29(0.16) | 0.56 |
| Total GM (%TCV) | 0.36(0.02) | 0.38(0.01) | 0.35(0.01) | <0.001 |
| Total WMH (%TCV) | 0.005(0.006) | 0.004(0.006) | 0.006(0.007) | 0.12 |
| HV(%TCV) | 0.004(0.0006) | 0.004(0.001) | 0.003(0.0005) | 0.004 |
| Word list learning I | −0.23(0.85) | 0.06(0.77) | −0.56(0.81) | 0.002 |
| Word list learning II | 0.07(0.74) | 0.26(0.70) | −0.14(0.73) | 0.02 |
| Episodic Memory* | −0.06 (0.76) | 0.17(0.69) | −0.31(0.76) | 0.005 |
| Vascular Risk** | 0.19(0.12) | 0.20(0.12) | 0.19(0.13) | 0.73 |
Abreviations: Abbreviations: GM = Gray matter volume; WMH = White matter hyperintensities volume; MPF_LIP = Connectivity between medial prefrontal and left inferior parietal region; TCV = Total brain volume. HV = Hippocampal volume.
Composite score of correct hits on Word List Learning I and Word List Learning II;
Vascular Risk: The percentage of 6 vascular risk factors or diseases reported clinically (diabetes, hypertension, hyperlipidemia, stroke, transient ischemic attack and coronary artery disease).
Analyses in all participants
Relationship between individual MRI measures and episodic memory performance
Single-MRI-predictor analyses controlling for gender, education, and adjusted age were used to detect associations between EM and each brain structural measure including GM, WMH, and hippocampal volume, as well as functional connectivity of each ROI pair (MPF_RIP, MPF_LIP, PCC_MPF, PCC_PIP, PCC_LIP and RIP_LIP). Lesser GM (p = 0.04) and higher WMH (p = 0.001) were each significantly associated with poorer EM, whereas hippocampal volume was not (p = 0.51). However, MPF_LIP connectivity was positively associated with EM (p = 0.009) (Table 2). Since MPF_LIP connectivity was preferentially associated with memory function, further analyses relating default network connectivity to cognition focused on this measure.
Table 2.
Associations between MRI measures and memory performance in regression models with a single MRI predictora
| MRI Measure | Estimate b (SE) | R2 | p-value |
|---|---|---|---|
| MPF_LIP | 1.19 (0.43) | 0.39 | 0.009 |
| MPF_RIP | 0.03 (0.48) | 0.32 | 0.95 |
| PCC_MPF | −0.09 (0.35) | 0.32 | 0.79 |
| PCC_LIP | 0.29 (0.35) | 0.33 | 0.40 |
| PCC_RIP | −0.18 (0.32) | 0.32 | 0.58 |
| RIP_LIP | 0.60 (0.37) | 0.35 | 0.11 |
| GM (%TCV) | 8.59 (4.11) | 0.36 | 0.04 |
| WMH (%TCV)c | −0.22 (0.06) | 0.42 | 0.001 |
| Hippo (%TCV) | 91.2 (138.7) | 0.34 | 0.51. |
Abbreviations: GM = Gray matter volume; WMH = White matter hyperintensity volume; Hippo = Hippocampal volume; TCV = Total brain volume; MPF = Medial prefrontal; LIP = Left inferior parietal; RIP = Right inferior parietal; PCC = Posterior cingulate.
Episodic memory: composite measure of Word list learning I and Word list learning II; Each row corresponds to a regression model that predicted episodic memory from the MRI measure in the first column while controlling for education, gender and adjusted age (residual age against GM and WMH); connectivity of each ROI pair are shown in absolute values after fisher Z transform of correlation coefficients
Unstandardized Beta coefficients from regression models carried out on original (unstandardized) variables.
Log transformed WMH percentage of TCV.
Correlations among MRI measures
No structural MRI measure was significantly associated with MPF_LIP connectivity, including hippocampal volume (r = 0.07, p = 0.73), WMH (r = 0.06, p = 0.55), and GM (r = -0.05, p = 0.75). However, there were significant associations between hippocampal and GM volumes (r = 0.33, p = 0.005) and between GM and WMH volumes (r = −0.34, p = 0.003).
Relationship between multiple MRI measures and episodic memory performance
In multiple regression models including MPF_LIP connectivity, total GM and adjusted WMH, controlling for education, gender and adjusted age, greater MPF_LIP connectivity (p = 0.002), greater GM (p = 0.01), and lesser adjusted WMH (p = 0.002) were still associated with greater memory performance (Table 3). Adding hippocampal volume as a covariate to this model did not substantially change the results (data not shown).
Table 3.
The association between three MRI measures and memory performance in a regression model simultaneously including all 3 measuresa
| MRI measure | All participants R2 = 0.51 | High R2 = 0.56 | Low R2 = 0.52 | |||
|---|---|---|---|---|---|---|
| Estimateb (SE) | p-value | Estimate (SE) | p-value | Estimate(SE) | p-value | |
| GM (%TCV) | 9.42 (3.67) | 0.01 | 0.14 (8.64) | 0.99 | −0.19 (8.39) | 0.98 |
| WMHc | −0.20 (0.06) | 0.002 | −0.33(0.08) | < 0.001 | −0.11 (0.10) | 0.32 |
| MPF_LIPd | 1.32 (0.40) | 0.002 | 0.45 (0.53) | 0.40 | 2.11 (0.63) | 0.002 |
Abbreviations: Whole = whole group of participants; High = high gray matter group (above median gray matter volume); Low = low gray matter group(below median gray matter volume); GM = gray matter; WMH = white matter hyperintensity; TCV = total brain volume; MPF_LIP = connectivity between medial prefrontal and left inferior parietal regions.
Episodic memory: composite measure of Word list learning I and Word list learning II; Gender, education and adjusted age (residual age against GM and WMH) were controlled in the regression model.
Unstandardizied coefficients from regression models carried out on original (unstandardized) variables.
Residuals of log transformed WMH percentage of total brain volume on GM.
Absolute values of fisher Z transformed correlation coefficients
In order to test the reliability of our analyses, we also performed the same multiple regression analyses in the group of 66 subjects who had no time points removed due to excessive head motion. This analysis confirmed the significant positive association between EM performance and MPF_LIP connectivity (p = 0.003) and between GM volume and EM performance (p = 0.02), as well as the negative association between adjusted WMH and EM performance (p = 0.01). In addition, hippocampal volume and GM were still significantly associated (r = 0.32, p = 0.01) in this smaller sample.
The variance inflation factors for the predictors in both multiple-MRI-predictor models were all below 2, suggesting that collinearity among predictors had a minimal effect on model estimates.
Analyses by stratified Gray Matter Volumes
In a multiple regression model with the same predictors as above (MPF_LIP, GM, adjusted WMH, education, gender, and adjusted age), and an interaction term between GM and MPF_LIP connectivity, the associations between the previous predictors and EM did not substantially change, and the interaction term was not significantly associated with EM (p=0.25).
In the group of individuals with GM above the median value, greater adjusted WMH was associated with poorer memory performance (p < 0.001); whereas no significant association was found between memory performance and MPF_LIP (p = 0.40). Conversely, in the group of individuals with GM below the median value, greater MPF_LIP connectivity (p = 0.002) was associated with greater memory function, but the association between memory performance and adjusted WMH was not significant (p = 0.32) (Table 3, Figure 2).
Figure 2. Association between MRI measures and episodic memory performance among two grey matter groups.

Abrieviation: MPF_LIP = Connectivity between medial prefrontal and left inferior parietal ROI region; WMH = White matter hyperintensities; GM = Gray matter.
Analogous results were observed in the reliability analysis of 66 subjects without substantial head movement. In the high GM individuals in this sub-sample (R2 = 0.60, p < 0.001), greater adjusted WMH was significantly associated with poorer EM performance (p = 0.001), while in the low GM individuals in this sub-sample (R2 = 0.63, p < 0.001), greater MPF_LIP connectivity was significantly associated with greater EM (p = 0.002).
Discussion
Although EM performance declines on average with advancing age, there is considerable inter-individual variability [46]. Increased amounts of WM abnormalities and GM atrophy commonly seen in cognitively impaired patients are also common to lesser degree in cognitively normal elders, and recent studies have suggested that both of these are associated with impaired memory performance among older individuals.[1] Our results support and extend this notion to include evidence of a positive effect of retained inter-regional connectivity on memory, especially in the presence of low GM volume. Specifically, GM, WMH, and DMN connectivity were independently and additively associated with diminished memory function. Among individuals with low GM volumes, however, only greater connectivity was associated with greater memory performance, possibly indicating compensation against the effects of neuronal injury.
The association between memory function and MPF_LIP connectivity supports multiple lines of research involving fMRI at rest and during memory tasks. Task related fMRI studies in humans and nonhuman primates suggest that frontal, temporal and parietal regions are activated during memory performance.[13,44] These studies indicate that there is a well-established network between posterior and frontal brain regions that subsumes major aspects of memory function. Other resting state fMRI studies further support our findings by suggesting that DMN connectivity is associated with memory function, and more specifically, that the parietal node of the network is important for memory retrieval.[33] In fact, reciprocal deactivation of the default mode network appears critical to memory performance during activation memory studies of older individuals.[42]
The MPF and LIP nodes appear to be part of a memory-specific network, and additional posterior nodes are likely also involved such as PCC and hippocampus.[45] However, we only found moderately strong correlations between PCC and hippocampal regions that did not extend to correlations between hippocampus and other DMN nodes, thus excluding the hippocampus from the broader network (data not shown). There are several possible reasons for this finding. First, hippocampal connectivity with the DMN and the PCC in particular, may be strongly affected by cognitive state while at rest; for example, connectivity between these nodes is significantly greater among individuals engaging in autobiographical memory recall compared to those engaged in unguided introspection.[36] Since our participants were given no instruction in this regard, our data likely represented a diversity of resting cognitive states, reflected in diversity in hippocampus-PCC connectivity. Second, recent PET studies suggest that a substantial minority of our older normal individuals may have possessed significant brain amyloid that would also reduce this connectivity[16]. Moreover, we expect that the prevalence of amyloid is likely to be higher among individuals with low GM volumes. Finally, different memory tasks may be associated with different default network regions. Our memory task, which required learning a list presented verbally, may instead more strongly tap the prefrontal node.
The specificity of our findings to the left hemisphere may also reflect the fact that our memory performance was aurally presented with verbal response. Recent work suggests that verbal memory retrieval performance maybe specific to left parietal cortical function.[23]
Current evidence shows that there are a number of individuals who remain cognitively normal during life but have sufficient AD pathology to meet neuropathological criteria for AD [5,30] at autopsy. The ability to retain normal cognitive function in the presence of brain injury suggests that certain individuals possess some type of protective or functional compensatory factor.[19] [41] We hypothesize that the association between DMN connectivity and memory performance may have been relatively stronger among those with greater levels of brain atrophy because DMN connectivity reflects a functional compensatory factor that provides a buffer against the effects of brain injury on cognitive function.
WMH volume, meanwhile, was not significantly correlated with DMN connectivity and had its greatest impact on memory function in subjects with relatively high GM volumes. This may be counterintuitive in light of growing evidence that WM integrity declines with advancing age[43] and is significantly associated with impaired memory performance.[3] The process by which WMH cause memory impairment, however, appears related to impairment of frontal encoding and retrieval systems, and WMHs may more specifically influence frontal systems through impaired connectivity with subcortical systems.(Lockhart S et al. submitted) WMH, therefore, likely influences memory processing through a mechanism that is distinct from DMN connectivity.
Our study, however, has limitations. First, this is a cross-sectional study and, consequently, we can only show association and not causality. Second, our decision to perform a median split based on gray matter volume—based on the notion that brain atrophy may indicate early degeneration—was guided by statistical considerations more than specific anatomic biological markers of early disease [17], although hippocampal volume was significantly lower in the low gray matter group. Finally, the sample size was not sufficiently large to examine potential interactions such as the interaction between WMH volume and atrophy on MPF_LIP connectivity and memory performance. Further studies, therefore, might examine the independent and combined effects of these processes on age-related differences in memory performance.
In conclusion, these results support the hypothesis that the effects of WMH and GM atrophy on memory performance are independent, and they additionally provide evidence that the strength of functional connectivity appears to mitigate the impact of GM atrophy on memory when individuals are cognitively normal. This suggests that the dynamics of memory decline with age may be better understood by examining the interactions of all three as separate processes. Further longitudinal study will help to elucidate the exact biological conditions and significance of these interactions.
Figure 1. ROI selection.
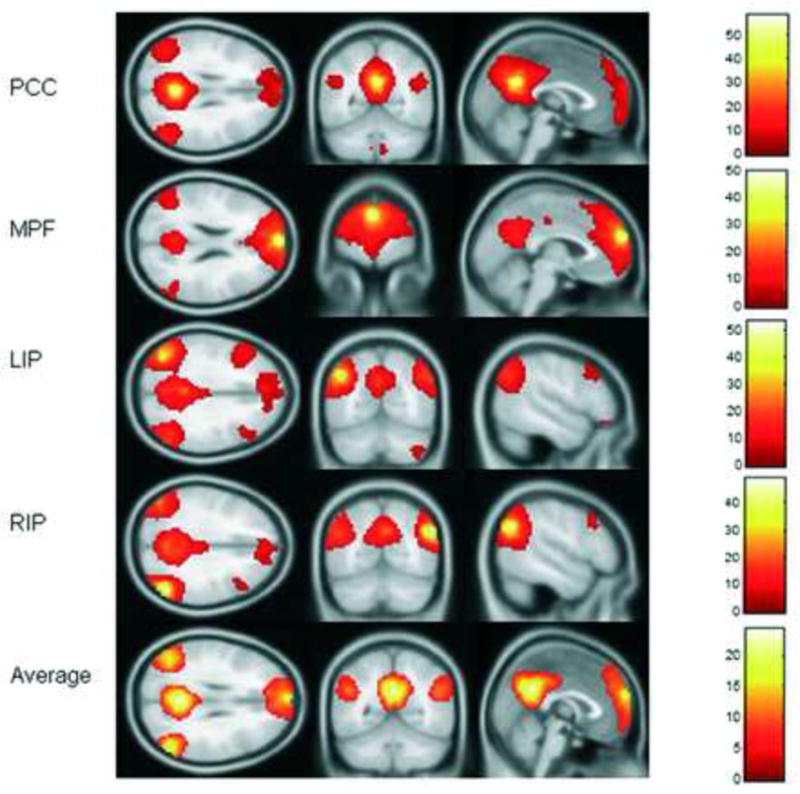
T maps of each seed functional connectivity map with T threshold at 6.0 were presented; an average T map was made according to these T maps, and the coordinates on the average T map that had highest T values within the clusters were selected as the center of each ROI. T values of each seed T map was indicated with colored bar next to it. Abreviations: PCC = posterior cigulate; MPF = medial prefrontal; LIP = left inferior parietal; RIP = right inferior parietal.
Acknowledgments
This work was supported by NIH awards P30 AG10129, R01 AG010220, R01 AG 031563, R01 AG021028, and K01 AG 030514 and Dana Foundation grant 08-003261.
Footnotes
Note that this adjusted WMH variable does not indicate the raw WMH volume per se, but rather the component of the WMH measurement that is not already reflected in GM.
Disclosure Statements
Dr. DeCarli is a consultant for Bayer and Takeda and serves as editor-in-chief for Alzheimer Disease and Associated Disorders. He also receives payment for university speaking engagements and multiple NIH grants. All other authors have no actual or potential conflicts of interest.
Publisher's Disclaimer: This is a PDF file of an unedited manuscript that has been accepted for publication. As a service to our customers we are providing this early version of the manuscript. The manuscript will undergo copyediting, typesetting, and review of the resulting proof before it is published in its final citable form. Please note that during the production process errors may be discovered which could affect the content, and all legal disclaimers that apply to the journal pertain.
References
- 1.Andrews-Hanna JR, Snyder AZ, Vincent JL, Lustig C, Head D, Raichle Marcus E, Buckner RL. Disruption of Large-Scale Brain Systems in Advanced Aging. Neuron. 2007;56(5):924–35. doi: 10.1016/j.neuron.2007.10.038. [DOI] [PMC free article] [PubMed] [Google Scholar]
- 2.Buckner RL. Memory and executive function in aging and AD: multiple factors that cause decline and reserve factors that compensate. Neuron. 2004;44(1):195–208. doi: 10.1016/j.neuron.2004.09.006. [DOI] [PubMed] [Google Scholar]
- 3.Charlton RA, Barrick TR, Markus HS, Morris RG. The relationship between episodic long-term memory and white matter integrity in normal aging. Neuropsychologia. 2010;48(1):114–22. doi: 10.1016/j.neuropsychologia.2009.08.018. [DOI] [PubMed] [Google Scholar]
- 4.Damoiseaux JS, Greicius MD. Greater than the sum of its parts: a review of studies combining structural connectivity and resting-state functional connectivity. Brain Structure & Function. 2009;213(6):525–33. doi: 10.1007/s00429-009-0208-6. [DOI] [PubMed] [Google Scholar]
- 5.Davis DG, Schmitt FA, Wekstein DR, Markesbery WR. Alzheimer neuropathologic alterations in aged cognitively normal subjects. Journal of Neuropathology and Experimental Neurology. 1999;58(4):376–88. doi: 10.1097/00005072-199904000-00008. [DOI] [PubMed] [Google Scholar]
- 6.DeCarli C, Massaro J, Harvey D, Hald J, Tullberg M, Au R, Beiser A, D’Agostino R, Wolf PA. Measures of brain morphology and infarction in the framingham heart study: establishing what is normal. Neurobiology of Aging. 2005;26(4):491–510. doi: 10.1016/j.neurobiolaging.2004.05.004. [DOI] [PubMed] [Google Scholar]
- 7.DeCarli C, Reed BR, Jagust W, Martinez O, Ortega M, Mungas D. Brain Behavior Relationships Among African Americans, Whites, and Hispanics. Alzheimer Dis Assoc Dis. 2008;22(4):382–91. doi: 10.1097/wad.0b013e318185e7fe. [DOI] [PMC free article] [PubMed] [Google Scholar]
- 8.Dempster AP, Laird NM, Rubin DB. Masimum likelihood from incomplete data via EM algorithm. Journal of the Royal Statistical Society Series B-Methodological. 1977;39(1):1–38. [Google Scholar]
- 9.Dickerson BC, Sperling RA. Large-scale functional brain network abnormalities in Alzheimer’s disease: Insights from functional neuroimaging. Behavioural Neurology. 2009;21(1–2):63–75. doi: 10.3233/BEN-2009-0227. [DOI] [PMC free article] [PubMed] [Google Scholar]
- 10.Frings L, Mader IMH. Watching TV news as memory task--brain activation and age effects. BMC Neurosci. 2010;11(106) doi: 10.1186/1471-2202-11-106. http://www.biomedcentral.com/1471-2202/11/106. [DOI] [PMC free article] [PubMed] [Google Scholar]
- 11.Grady CL. Functional brain imaging and age-related changes in cognition. Biological Psychology. 2000;54(1–3):259–81. doi: 10.1016/s0301-0511(00)00059-4. [DOI] [PubMed] [Google Scholar]
- 12.Grady CL, Craik FIM. Changes in memory processing with age. Current Opinion in Neurobiology. 2000;10(2):224–31. doi: 10.1016/s0959-4388(00)00073-8. [DOI] [PubMed] [Google Scholar]
- 13.Greicius MD, Krasnow B, Boyett-Anderson JM, Eliez S, Schatzberg AF, Reiss AL, Menon V. Regional analysis of hippocampal activation during memory encoding and retrieval: fMRI study. Hippocampus. 2003;13(1):164–74. doi: 10.1002/hipo.10064. [DOI] [PubMed] [Google Scholar]
- 14.Greicius MD, Srivastava G, Reiss AL, Menon V. Default-mode network activity distinguishes Alzheimer’s disease from healthy aging: Evidence from functional MRI. Proceedings of the National Academy of Sciences of the United States of America. 2004;101(13):4637–42. doi: 10.1073/pnas.0308627101. [DOI] [PMC free article] [PubMed] [Google Scholar]
- 15.Hedden T, Gabrieli JDE. Nature Reviews Neuroscience. Vol. 5. Nature Publishing Group; 2004. Insights into the ageing mind: a view from cognitive neuroscience; pp. 87–96. [DOI] [PubMed] [Google Scholar]
- 16.Hedden T, Van Dijk KR, Becker JA, Mehta A, Sperling RA, Johnson KA, Buckner RL. Disruption of Functional Connectivity in Clinically Normal Older Adults Harboring Amyloid Burden. The Journal of Neuroscience. 2009;29(40):12686–94. doi: 10.1523/JNEUROSCI.3189-09.2009. [DOI] [PMC free article] [PubMed] [Google Scholar]
- 17.Jack CR, Jr, Knopman DS, Jagust WJ, Shaw LM, Aisen PS, Weiner MW, Petersen RC, Trojanowski JQ. Hypothetical model of dynamic biomarkers of the Alzheimer’s pathological cascade. Lancet Neurol. 2010;9(1):119–28. doi: 10.1016/S1474-4422(09)70299-6. [DOI] [PMC free article] [PubMed] [Google Scholar]
- 18.Jenkins LJ, CR Prefrontal and medial temporal lobe activity at encoding predicts temporal context memory. Journal of Neuroscience. 2010;30(46):15558–65. doi: 10.1523/JNEUROSCI.1337-10.2010. [DOI] [PMC free article] [PubMed] [Google Scholar]
- 19.Kemppainen NM, Aalto S, Karrasch M, Nagren K, Savisto N, Konen V, Viitanen M, Parkkola F, Rinne JO. Cognitive reserve hypothesis: Pittsburgh Compound B and fluorodeoxyglucose positron emission tomography in relation to education in mild Alzheimer’s disease. Annals of Neurology. 2008;63(1):112–8. doi: 10.1002/ana.21212. [DOI] [PubMed] [Google Scholar]
- 20.Lee DY, Fletcher E, Martinez O, Ortega M, Zozulya N, Kim J, Tran J, Buonocore M, Carmichael O, Decarli C. Regional pattern of white matter microstructural changes in normal aging, MCI, and AD. Neurology. 2009;73(21):1722–8. doi: 10.1212/WNL.0b013e3181c33afb. [DOI] [PMC free article] [PubMed] [Google Scholar]
- 21.Lee DY, Fletcher E, Martinez O, Zozulya N, Kim J, Tran J, Buonocore M, Carmichael O, DeCarli C. Vascular and Degenerative Processes Differentially Affect Regional Interhemispheric Connections in Normal Aging, Mild Cognitive Impairment, and Alzheimer Disease. Stroke. 2010;41(8):1791–7. doi: 10.1161/STROKEAHA.110.582163. [DOI] [PMC free article] [PubMed] [Google Scholar]
- 22.Macey KE, Macey PM, Woo MA, Harper RK, Alger JR, Keens TG, Harper RM. fMRI signal changes in response to forced expiratory loading in congenital central hypoventilation syndrome. Journal of Applied Physiology. 2004;97(5):1897–907. doi: 10.1152/japplphysiol.00359.2004. [DOI] [PubMed] [Google Scholar]
- 23.Manenti R, Tettamanti M, Cotelli M, Miniussi CSFC. The neural bases of word encoding and retrieval: A fMRI-guided transcranial magnetic stimulation study. Brain Topogr. 2010 Jan;22(4):318–32. doi: 10.1007/s10548-009-0126-1. [DOI] [PubMed] [Google Scholar]
- 24.Mungas D, Reed BR, Crane PK, Haan MN, Gonzalez H. Spanish and English Neuropsychological Assessment Scales (SENAS): Further development and psychometric characteristics. Psychological Assessment. 2004;16(4):347–59. doi: 10.1037/1040-3590.16.4.347. [DOI] [PubMed] [Google Scholar]
- 25.O’Sullivan M, Summers PE, Jones DK, Jarosz JM, Williams SCR, Markus HS. Normal-appearing white matter in ischemic leukoaraiosis: A diffusion tensor MRI study. Neurology. 2001;57(12):2307–10. doi: 10.1212/wnl.57.12.2307. [DOI] [PubMed] [Google Scholar]
- 26.Pantoni L, Garcia JH. Cognitive impairment and cellular/vascular changes in the cerebral white matter. Ann N Y Acad Sci. 1997;826:92–102. doi: 10.1111/j.1749-6632.1997.tb48463.x. [DOI] [PubMed] [Google Scholar]
- 27.Pfefferbaum A, Sullivan EV, Hedehus M, Lim KO, Adalsteinsson E, Moseley M. Age-related decline in brain white matter anisotropy measured with spatially corrected echo-planar diffusion tensor imaging. Magnetic Resonance in Medicine. 2000;44(2):259–68. doi: 10.1002/1522-2594(200008)44:2<259::aid-mrm13>3.0.co;2-6. [DOI] [PubMed] [Google Scholar]
- 28.Raichle M, MacLeod A, Snyder A, Powers W, Gusnard D, Shulman G. A default mode of brain function. Proc Natl Acad Sci USA. 2001;98:676–82. doi: 10.1073/pnas.98.2.676. [DOI] [PMC free article] [PubMed] [Google Scholar]
- 29.Raz N, Gunning-Dixon FM, Head D, Dupuis JH, Acker JD. Neuroanatomical correlates of cognitive aging: Evidence from structural magnetic resonance imaging. Neuropsychology. 1998;12(1):95–114. doi: 10.1037//0894-4105.12.1.95. [DOI] [PubMed] [Google Scholar]
- 30.Schmitt FA, Davis DG, Wekstein DR, Smith CD, Ashford JW, Markesbery WR. “Preclinical” AD revisited - Neuropathology of cognitively normal older adults. Neurology. 2000;55(3):370–6. doi: 10.1212/wnl.55.3.370. [DOI] [PubMed] [Google Scholar]
- 31.Scoville WB, Milner B. Loss of recent memory after bilateral hippocampal lesions. Journal of Neurology Neurosurgery and Psychiatry. 1957;20(1):11–21. doi: 10.1136/jnnp.20.1.11. [DOI] [PMC free article] [PubMed] [Google Scholar]
- 32.Seshadri S, DeStefano AL, Au R, Massaro JM, Beiser AS, Kelly-Hayes M, Kase CS, D’Agostino RB, Sr, DeCarli C, Atwood LD, Wolf PA. Genetic correlates of brain aging on MRI and cognitive test measures: a genome-wide association and linkage analysis in the Framingham study. BMC Medical Genetics. 2007;8(Suppl 1):Article No.: S15. doi: 10.1186/1471-2350-8-S1-S15. [DOI] [PMC free article] [PubMed] [Google Scholar]
- 33.Sestieri C, Corbetta M, Romanni G, Shulman G. Episodic memory retrieval, parietal cortex and the default mode network: functional and topographic analyses. J Neurosci. 2011;(31):4407–20. doi: 10.1523/JNEUROSCI.3335-10.2011. [DOI] [PMC free article] [PubMed] [Google Scholar]
- 34.Shanker G, Li S, Mehta T, Garcia-Munoz A, Shepardson N, Smith I, Brett F, Farrell M, Rowan M, Lemere C, Regan C, Walsh D, Sabatini B, Selkoe DJ. Amyloid-beta protein dimers isolated directly from Alzheimer’s brain impair synaptic plasticity and memory. Nat Med. 2008;(14):837–42. doi: 10.1038/nm1782. [DOI] [PMC free article] [PubMed] [Google Scholar]
- 35.Shim G, Oh J, Jung W, Jang J, Choi C-H, Kim E, Park H-Y, Choi J-S, Jung M, Kwon J. Altered resting-state connectivity in subjects at ultra-high risk for psychosis: an fMRI study. Behavioral and Brain Functions. 2010;6(1):58. doi: 10.1186/1744-9081-6-58. [DOI] [PMC free article] [PubMed] [Google Scholar]
- 36.Shirer W, Ryali S, Rykhlevskaia E, Menon V, Greicius M. Decoding subject-driven cognitive states with whole-brain connectivity patterns. Cerebral Cortex. 2011 doi: 10.1093/cercor/bhr099. In press. [DOI] [PMC free article] [PubMed] [Google Scholar]
- 37.Sperling RA, Dickerson BC, Pihlajamaki M, Vannini P, LaViolette PS, Vitolo OV, Hedden T, Becker JA, Rentz DM, Selkoe DJ, Johnson KA. Functional Alterations in Memory Networks in Early Alzheimer’s Disease. Neuromol Med. 2010;12(1):27–43. doi: 10.1007/s12017-009-8109-7. [DOI] [PMC free article] [PubMed] [Google Scholar]
- 38.Squire LR. Memory systems of the brain: A brief history and current perspective. Neurobiology of Learning and Memory. 2004;82(3):171–7. doi: 10.1016/j.nlm.2004.06.005. [DOI] [PubMed] [Google Scholar]
- 39.Squire LR, Stark CEL, Clark RE. The medial temporal lobe. Annual Review of Neuroscience. 2004;27:279–306. doi: 10.1146/annurev.neuro.27.070203.144130. [DOI] [PubMed] [Google Scholar]
- 40.Staresina BP, LD Object Unitization and Associative Memory Formation Are Supported by Distinct Brain Regions. J Neurosci. 2010;30(29):9890–7. doi: 10.1523/JNEUROSCI.0826-10.2010. [DOI] [PMC free article] [PubMed] [Google Scholar]
- 41.Stern Y. What is cognitive reserve? Theory and research application of the reserve concept. J Int Neuropsychol Soc. 2002;8:448–60. [PubMed] [Google Scholar]
- 42.Vannini P, O’Brien J, O’Keefe K, Pihlajamaki M, LaViolette P, Sperling RA. What Goes Down Must Come Up: Role of the Posteromedial Cortices in Encoding and Retrieval. Cerebral Cortex. 2011;21(1):22–34. doi: 10.1093/cercor/bhq051. [DOI] [PMC free article] [PubMed] [Google Scholar]
- 43.Vernooij MW, de Groot M, van der Lugt A, Ikram MA, Krestin GP, Hofman A, Niessen WJ, Breteler MMB. White matter atrophy and lesion formation explain the loss of structural integrity of white matter in aging. Neuroimage. 2008;43(3):470–7. doi: 10.1016/j.neuroimage.2008.07.052. [DOI] [PubMed] [Google Scholar]
- 44.Vilberg KL, Rugg MD. Memory retrieval and the parietal cortex: A review of evidence from a dual-process perspective. Neuropsychologia. 2008;46(7):1787–99. doi: 10.1016/j.neuropsychologia.2008.01.004. [DOI] [PMC free article] [PubMed] [Google Scholar]
- 45.Wang L, LaViolette P, O’Keefe K, Putcha D, Bakkour A, Van Dijk KRA, Pihlajamäki M, Dickerson BC, Sperling RA. Intrinsic connectivity between the hippocampus and posteromedial cortex predicts memory performance in cognitively intact older individuals. Neuroimage. 2010;51(2):910–7. doi: 10.1016/j.neuroimage.2010.02.046. [DOI] [PMC free article] [PubMed] [Google Scholar]
- 46.Wilson RS, Beckett LA, Barnes LL, Schneider JA, Bach J, Evans DA, Bennett DA. Individual differences in rates of change in cognitive abilities of older persons. Psychol Aging. 2002;17(2):179–93. [PubMed] [Google Scholar]
- 47.Ylikoski A, Erkinjuntti T, Raininko R, Sarna S, Sulkava R, Tilvis R. White matter hyperintensities on MRI in the neurologically nondiseased elderly. Stroke. 1995;26:1171–7. doi: 10.1161/01.str.26.7.1171. [DOI] [PubMed] [Google Scholar]