

Abstract
Genetically encoded calcium indicators have become instrumental in imaging signaling in complex tissues and neuronal circuits in vivo. Despite their importance, structure-function relationships of these sensors often remain largely uncharacterized due to their artificial and multimodular composition. Here, we describe a combination of protein engineering and kinetic, spectroscopic, and biophysical analysis of the Förster resonance energy transfer (FRET)-based calcium biosensor TN-XXL. Using fluorescence spectroscopy of engineered tyrosines, we show that two of the four calcium binding EF-hands dominate the FRET output of TN-XXL and that local conformational changes of these hands match the kinetics of FRET change. Using small-angle x-ray scattering and NMR spectroscopy, we show that TN-XXL changes from a flexible elongated to a rigid globular shape upon binding calcium, thus resulting in FRET signal output. Furthermore, we compare calcium titrations using fluorescence lifetime spectroscopy with the ratiometric approach and investigate potential non-FRET effects that may affect the fluorophores. Thus, our data characterize the biophysics of TN-XXL in detail and may form a basis for further rational engineering of FRET-based biosensors.
Introduction
Förster resonance energy transfer (FRET) between fluorescent protein variants has become a powerful method to detect protein interactions and conformational change in living cells (1–3). Unimolecular FRET is the read-out mode in a large number of biosensors that employ a donor and acceptor fluorescent protein, predominantly cyan fluorescent protein (CFP) and yellow fluorescent protein (YFP) or improved derivatives thereof (4–6). Genetically encoded calcium indicators (GECIs) enable observation of intracellular signaling in multicellular tissues and neuronal activity in living organisms (7,8). The currently available GECIs can be subdivided into single-wavelength indicators like the GCaMPs (9) and GECOs (10) on the one hand and dual-wavelength indicators based on FRET on the other hand. There has been a strong interest in the continuous improvement of these types of sensors in terms of sensitivity, kinetics, and biocompatibility. The prototypical FRET-based Cameleons (11,12) and the subsequent derivatives YC3.6 (13) or Cameleon-Nano (14) employ calmodulin (CaM) and a CaM-binding peptide such as M13 from myosin light-chain kinase as calcium-dependent interaction domains. Sensors with redesigned interaction interfaces between CaM and its binding peptide have been generated (15). To avoid perturbation of CaM-dependent signal networks inside cells, and to simplify sensor design, Troponin C (TnC) has been used to replace CaM/M13 within biosensors (16). TnC is a calcium-binding protein specialized in regulating muscle contraction, with no other known signaling function. Ca2+ binding to chicken skeletal muscle TnC has been extensively studied by exploiting endogenous aromatic amino acid fluorescence (17–19). The protein consists of an N-terminal regulatory lobe with two sites that bind calcium specifically with lower affinity and a C-terminal structural lobe with another two sites that bind calcium with high affinity and also bind magnesium (20). Structural changes in TnC have been followed by circular dichroism spectroscopy (21), NMR (22,23), x-ray scattering (24), and crystallography (25). TnC-based calcium biosensors were subsequently further engineered to abolish magnesium binding and to enhance FRET change by incorporation of a circular permutation of the acceptor fluorescent protein Citrine (26). The latest signal-optimized variant, TN-XXL, arose from domain rearrangement, by which two copies of the C-terminal lobe of chicken skeletal TnC were linked to each other and sandwiched between CFP and cpCitrine (27). This procedure abolished the N-terminal lobe of TnC completely and served as a first step away from the use of naturally occurring calcium-binding proteins to a more synthetic, biocompatible sensor architecture. As a better understanding of sensor biophysics may serve as a basis for further rational improvements of sensor design and performance, we here set out to characterize TN-XXL function in more detail. Our results depict the biophysical parameters of TN-XXL function, give insight into how the initial calcium binding to TN-XXL results in FRET output, and pinpoint optimization potential for further rational sensor engineering.
Materials and Methods
Gene construction
TN-XXL and its “Amber” variants were cloned into pRSETB vector (Invitrogen, Carlsbad, CA) using flanking BamHI/EcoRI restriction sites. As constructs for tyrosine fluorescence experiments, only the TN-XXL calcium-binding domain, without the FPs, was cloned into pRSETB, changing the flanking restriction sites from SphI/SacI to BamHI/EcoRI. Mutant constructs of the indicator variants were generated by site-directed mutagenesis using the primer extension method (Stratagene, La Jolla, CA). For protein expression, indicator constructs were subcloned into a modified version of the pET16b vector (EMD Biosciences, San Diego, CA) containing an N-terminal tobacco etch virus (TEV) protease cleavage site.
Protein expression and purification
Indicator variants were expressed in E. coli BL21 and treated as described previously (16). Clear lysates were purified via HisTrap Ni-NTA columns (GE Healthcare, Waukesha, WI) according to the manufacturer's protocol. The eluate was incubated with TEV protease in the presence of 5 mM dithiothreitol (DTT) at 4°C overnight for His-tag removal. The cleaved protein was obtained in the flow-through during Ni-NTA affinity chromatography. Protein variants were further purified by size-exclusion chromatography on a Superdex 200 column (16/60, GE Healthcare) equilibrated with the respective measurement buffers. Fractions containing protein were pooled and concentrated using a 10 kD Centricon ultrafiltration device (Millipore, Billerica, MA). Analytical size-exclusion chromatography was performed using a Superose 12 column (10/300, GE Healthcare) equilibrated with buffer A (30 mM MOPS, 100 mM KCl, 100 μM EDTA, 100 μM EGTA, pH 7.5) with EGTA (2 mM, Ca2+-free) or CaCl2 (10 mM, high Ca2+). Before chromatographic separation, the samples were pretreated with 2 mM EGTA and 10 mM CaCl2, respectively.
For NMR experiments, expression of the uniformly 15N- and 13C-labeled histidine-tagged single-lobe domain of TN-XXL (comprising EF-hands 3 and 4) was performed at 37°C in minimal medium with 15N-ammonium chloride and 13C6-D-glucose as the sole nitrogen and carbon sources. The fusion protein was purified by immobilized metal affinity chromatography on Ni-NTA agarose (Qiagen, Venlo, The Netherlands) and subsequently cleaved with TEV protease. The released EF34 TN-XXL was further purified by reverse-phase HPLC.
Analytical ultracentrifugation
The sedimentation velocity experiments were performed using an Optima XL-I analytical ultracentrifuge (Beckman Coulter, Brea, CA) equipped with an An-60 Ti rotor and double-sector centerpieces at 20°C. The sample proteins were used at a concentration of 18–23 μM in buffer A (30 mM MOPS, 100 mM KCl, 100 μM EDTA, 100 μM EGTA, pH 7.5) with EGTA (2 mM, Ca2+ free) or CaCl2 (10 mM, high Ca2+) added. Buffer density and viscosity were measured using a DMA 5000 densitometer and an AMVn viscosimeter, respectively (both from Anton Paar, Graz, Austria). Concentration profiles were measured at 280 nm at a speed of 50,000 rpm, followed by evaluation using the SEDFIT software (version 11.71 (28)) to obtain the diffusion-corrected sedimentation coefficient distributions (c(s)-distributions).
Fluorescence spectroscopy
Ca2+ affinity of TN-XXL and variants were measured by steady-state fluorescence spectroscopy using a Cary Eclipse fluorometer (Varian, Palo Alto, CA) with temperature-controlled cuvette holder. Dissociation kinetics were measured with a stopped-flow RX2000 rapid kinetics accessory unit (Applied Photophysics, Leatherhead, UK) with a dead time of ∼8 ms, with excitation at 432 nm and detection at 475 nm and 527 nm. Free Ca2+ concentrations were calculated using the Maxchelator (http://maxchelator.stanford.edu). Ca2+ titrations were carried out in calcium titration buffer RT (30 mM MOPS, 100 mM KCl, 1 mM MgCl2, 10 mM K2EGTA, and 0–10 mM CaCl2, pH 7.2) according to the methods of Tsien and Pozzan (29) at a protein concentration of 0.5 μM. Stopped-flow measurements of these variants were conducted at a protein concentration of 0.5 μM with 2 mM Ca2+ in buffer SF (10 mM MOPS, 50 mM KCl, 1 mM MgCl2, and 1 mM DTT, pH 7.5) being rapidly mixed with an equal volume of EGTA (10 mM) in buffer SF (30).
Ca2+ titrations monitoring tyrosine fluorescence were carried out with the same stopped-flow unit as described above in a 2-mL volume of 1 μM protein in buffer YT (200 mM MOPS to prevent pH changes upon Ca2+ addition, 100 mM KCl, 2 mM EGTA, 1 mM MgCl2, and 1 mM DTT, pH 7.2). Microliter amounts of CaCl2 solution (250 mM) were added at 30°C with tyrosine fluorescence excited at 275 nm and monitored at 303 nm using the Cary Eclipse fluorometer. The rate of conformational change of the binding domain alone was followed by stopped-flow tyrosine fluorescence at a protein concentration of 5 μM in buffer SF, as described above.
The time-resolved detection of the fluorescence decay of TN-XXL was performed with a Fluotime100 fluorescence spectrophotometer (Picoquant, Berlin, Germany) based on a picoHarp300 unit and using a pulsed diode laser (LDH-440 and LDH-P-C-470; center wavelength, 440 nm and 470 nm; pulse width, 54 ps and 88 ps; repetition frequency, variable, here 10 MHz) as an excitation source. Fluorescence decay curves were measured by time-correlated single-photon counting with a resolution of ≥300 ps (31,32). Decay curves were analyzed by iterative reconvolution of the instrument response function, IRF(t), with an exponential model function, M(t), using the FluoFit software (version 4.4; Picoquant) using:
| (1) |
| (2) |
where τi are the characteristic lifetimes and αi are the respective intensities. The average lifetime, τave, was calculated as
| (3) |
Small-angle x-ray scattering
Small-angle x-ray scattering (SAXS) data collection was performed at ID14-3 European Molecular Biology Laboratory (EMBL)/European Synchrotron Radiation Facility (Grenoble, France) and X33 EMBL/Deutsches Elektronen-Synchrotron (Hamburg, Germany) beamlines. TN-XXL samples were purified by size-exclusion chromatography in buffer A (30 mM MOPS, 100 mM KCl, 100 μM EDTA, and 100 μM EGTA, pH 7.5) containing EGTA (2 mM, Ca2+ free) or 10 mM CaCl2 (10 mM high Ca2+). Protein samples and buffer controls were centrifuged for 10 min at 13,200 × g before data acquisition. Samples were measured in concentrations of 1, 2, 5, and 10 mg/mL. The running buffer of the size-exclusion chromatography (buffer A) was used for buffer correction. No particle interaction or aggregation was observed in the tested concentration range. All samples were checked for radiation damage by comparison of the successive 10-s frames of sample exposure. Raw data were analyzed and processed using the ATSAS package (version 2.4 (33)) according to the literature (34). Sets of independent ab initio models were calculated using GASBOR (35). DAMAVER (36) was used for alignment and averaging. Figures and modeling were carried out using SITUS (37) and UCSF Chimera (38).
NMR spectroscopy
NMR experiments were carried out at 303 K on Bruker DRX spectrometers equipped with z-gradient cryoprobes operating at different fields (600–800 MHz). NMR samples were prepared at a final protein concentration of 1 mM in 20 mM Bis-Tris (pH 7.0), 100 mM KCl, 10 mM DTT, and 10% 2H2O. The metal-free and calcium-loaded samples contained 20 mM EDTA/20 mM EGTA and 10 mM CaCl2, respectively. To obtain sequence-specific backbone resonance assignments, a standard set of triple-resonance NMR experiments was performed. The spectra were processed using NMRpipe (39) and analyzed using SPARKY (40) and CARA (41).
Results
Correlating calcium binding and FRET output
We first investigated calcium binding to individual EF-hands of the TN-XXL calcium-binding domain via tyrosine fluorescence. The binding domain of TN-XXL comprises two concatenated C-terminal lobes (EF-hands 3 and 4 with residues 94–162) from chicken skeletal muscle TnC, thus consisting of two identical pairs of EF-hands connected by a short linker peptide (Fig. 1 A). To monitor calcium binding to the individual EF-hands of TN-XXL directly, we mutated endogenous phenylalanine residues in the chelating loop of each EF-hand to tyrosines. Tyrosine residues present at the corresponding positions in the related wild-type human cardiac TnC are known to report Ca2+ binding to one specific EF-hand with an increase of intrinsic fluorescence (30). We generated a series of constructs in which one of the four Phe residues was selectively exchanged (EF3-1, EF4-1, EF3-2, EF4-2), with one control that contained tyrosines in all four binding sites (TN-XXL 4×Tyr). TN-XXL 4×Tyr showed a calcium affinity and off rate that was indistinguishable from that of TN-XXL when monitored via FRET (Fig. S1, A and B, in the Supporting Material). Direct calcium binding to the individual EF-hands of TN-XXL was monitored at 23°C and pH 7.2. For this purpose, we used the TN-XXL calcium-binding domain without the flanking fluorescent proteins due to the presence of one endogenous tryptophan and 8–10 tyrosines within each fluorescent protein. These four constructs, containing only a single tyrosine residue per construct, were analyzed by steady-state (Fig. 1 B) and stopped-flow fluorescence spectroscopy (Fig. 1 C). Calcium-induced tyrosine fluorescence increases were significantly different in both EF-hand types and varied between ∼75% (EF3-1 or 3-2) and only ∼6% (EF4-1 and 4-2) (Fig. S1, C and D). For EF3-1 and EF3-2, Kd values of 690 nM and 820 nM, respectively, were determined, matching the measured Kd of TN-XXL, which was 830 nM as monitored by FRET. In contrast, EF4-1 and EF4-2 showed Kd values of 180 nM and 2.05 μM, respectively. Thus, EF3-1 and EF3-2 show a calcium affinity that is in good agreement with the value of TN-XXL and therefore were identified as the major determinants of the sensor's FRET signal. Notably, EF3-1 shows a broader binding curve in comparison to EF3-2, which suggests structural instability of the first EF-hand due to the lack of an N-terminal fusion partner. The assumption of a less ordered structure is further supported by the NMR results (see Fig. 3 C) Ca2+ dissociation kinetics were determined for EF3-1 and EF3-2 (Fig. 1 C). Due to their low signal strength and the missing relation to TN-XXL affinity, EF4-1 and EF4-2 were not included in this experiment. The resulting Ca2+-dissociation time constants, tdecay, were calculated using monoexponential fits and compared with the FRET fluorescence decay of TN-XXL. For FRET, a tdecay of 311 ms was measured, whereas EF3-1 and EF3-2 show tdecay values of 317 ms and 277 ms, respectively. Thus, unbinding of bound Ca2+ locally detected at EF-hands 3-1 and 3-2 displayed off-kinetics similar to the global changes reported by FRET.
Figure 1.

Fluorescence spectroscopy of single tyrosine substitutions in the calcium binding domain of TN-XXL. (A) Schematic representation of the four calcium binding EF-hands of the TN-XXL calcium binding domain. Endogenous phenylalanine residues were mutated to tyrosines to report local calcium binding at individual EF-hands. (B) Calcium titrations of single tyrosine substitutions in comparison to TN-XXL FRET. Standard error of the mean depicted as error bars and fluorescence normalized. (C) Calcium-dissociation kinetics of EF3-1 and EF3-2. Tyrosine measurements used excitation at 275 nm with emission recorded at 303 nm. TN-XXL FRET control was performed with excitation at 432 nm and cpCitrine (YFP) emission was recorded at 527 nm. All data are averages of three independent experiments.
Figure 3.

NMR characterization of the calcium-binding domain of TN-XXL. (A and B) 1H-15N HSQC spectra of 15N13C-labeled single-lobe EF34 TN-XXL domain (residues 94–162). Data acquisition was performed at 303 K on an 800 MHz spectrometer with the Ca2+-loaded (A) and Ca2+-free form (B). (C) Upper, Secondary-structure elements (α-helices and β-strands) in dependence of the sequence in EF34 TN-XXL in the Ca2+-loaded form as derived by the chemical shift index based on Cα resonance assignments. Lower, Secondary chemical shift analysis for EF34 of TN-XXL in the Ca2+-loaded (black) and Ca2+-free forms (gray).
Hydrodynamics of TN-XXL
Hydrodynamic analysis of TN-XXL was performed using a multimethod approach to investigate the conformational switch upon Ca2+ binding underlying the FRET changes. Under both conditions—high calcium (10 mM CaCl2) or calcium-free (2 mM EGTA)—recombinant purified TN-XXL remained strictly monomeric (Fig. 2, A–C). Analytical size-exclusion chromatography of TN-XXL showed a large shift of the elution volume, Ve, indicating a significant change of the hydrodynamic volume with its monomeric status maintained. Further analysis by analytical ultracentrifugation confirmed these results shown as sedimentation-coefficient distributions (Fig. 2 C, c(S)). In sedimentation velocity experiments, the sedimentation constant S20,W shifted from 5.05 at high calcium to 4.32 at calcium-free conditions. As a measure for the change in maximal shape asymmetry, calculation of the frictional ratio f/f0 showed values of 1.2 in the calcium-saturated state, correlating with a rather compact structure, as usually observed for globular proteins, and a frictional ratio f/f0 of 1.5 in the calcium-depleted state, indicating an elongated shape (42). Molecular masses of TN-XXL in the calcium unbound and bound states determined from broadening of the sedimenting boundary in sedimentation-velocity experiments were 74.1 kDa and 67.8 kDa mol wt, respectively, and are in good agreement with the theoretical molecular mass of a monomer (74.1 kDa). Finally, SAXS allowed us to associate these results with molecular geometry parameters like radius of gyration, Rg, and maximum diameter, Dmax, of the proteins and with approximations of folding status and conformation. The obvious differences in TN-XXL shapes in the presence and absence of Ca2+ can already be seen in the scattering curves (Fig. 2 D), and they are even more pronounced in the interatomic distance distribution function, P(r) (Fig. 2 E). A radius of gyration, Rg, of 3.85 nm suggests an elongated calcium-free conformation, in comparison to an Rg of 3.32 nm for the calcium-saturated state, confirming its more compact structure. Calcium-bound and calcium-free states are clearly folded, as can be judged from the bell-shaped curves (43) in the Kratky plots (Fig. 2 F). Maximum particle size, Dmax, values of 14 nm (Ca2+-free) versus 11 nm (Ca2+-bound) fit well to possible arrangements of the enhanced CFP (ECFP)/cpCitrine pair, allowing the assumption of a strong distance contribution to the FRET change of TN-XXL. To visualize the results, low-resolution shapes were calculated ab initio from the scattering data (Fig. 2 G). The location of the two β-barrel domains is evident in the outstretched Ca2+-free form but ambiguous in the compact Ca2+-bound form. To better illustrate the possible positioning of the two FPs, the available structures for ECFP and citrine (PDB 1CV7 and 1HUY) were manually docked in the shape envelope of the Ca2+-free form (Fig. 2 H).
Figure 2.

Hydrodynamics of TN-XXL. (A) Coomassie staining of SDS- and native PAGE gels of purified TN-XXL. (B) Size-exclusion chromatography of TN-XXL in Ca2+-free and high-Ca2+ conditions on a Superose 12 column (10/300). (C) c(S) distribution calculated using SEDFIT (28) from sedimentation-velocity experiments in the analytical ultracentrifuge with TN-XXL concentrations of 18 and 23 μM in the presence and absence, respectively, of Ca2+. (D) Solution scattering data for TN-XXL in Ca2+-free and high-Ca2+ conditions. (E and F) Distance distribution functions P(r) and Kratky plot, respectively, of TN-XXL in Ca2+-free and high-Ca2+ conditions. (G) Final averaged DAMAVER (36) ab initio shapes from independent GASBOR (35) runs of TN-XXL in Ca2+-free (upper) and high-Ca2+ (lower) states. (H) Shape of TN-XXL in Ca2+-free state manually docked with cartoon representations of crystal structures of ECFP and citrine (PDB 1CV7 and 1HUY). All experiments were carried out in buffer A. Either 2 mM EGTA or 10 mM CaCl2 were added for Ca2+-free or high-Ca2+ conditions, respectively.
NMR characterization of a single C-lobe domain of TN-XXL
To further investigate the different rigidities under both conditions, we undertook a solution NMR characterization of a single C-terminal lobe of TnC containing one pair of EF-hands from TN-XXL (EF34). The 1H-15N heteronuclear single-quantum coherence (HSQC) spectrum of the calcium-loaded form (Fig. 3 A) shows that EF34—considering the good dispersion of signals in both proton and nitrogen dimensions—adopts a folded conformation. Moreover, we obtained the complete assignment of HN and Cα chemical shifts of EF34. On the basis of chemical shift index values (44), we derived a secondary structure prediction, shown in Fig. 3 C, which is essentially identical to that obtained for the wild-type C-terminal domain of chicken skeletal TnC and consistent with its high-resolution structure, PDB ID code 1TNW19. This finding suggests that the three TN-XXL mutations N108D, D110N, and I130T do not affect the tertiary fold of EF34. This result gains further support from the characteristic amide proton chemical shifts of residues Gly111 and Gly147. As in wild-type TnC, these residues show remarkable downfield chemical shifts in EF34, suggesting that they are similarly involved in a hydrogen bond that stabilizes calcium-binding sites. Finally, to address the role of metal in the domain organization, we also investigated the apo form of EF34. As displayed in Fig. 3 B, there is considerably less signal dispersion in the 1H-15N HSQC spectrum of the apo form than in the calcium-loaded form. Secondary Cα chemical shifts are also less pronounced in the metal-free form (Fig. 3 C), even though they still deviate significantly from zero. Taken together, these data indicate that in the absence of calcium, the tertiary structure of protein is partially lost and the secondary structural elements are less stable than in the metal-loaded protein. Notably, the secondary structure, in particular the first α-helix, of the EF-hand motif (EF3) appears to be more affected than EF4. However, this might also be due to the lack of a stabilizing N-terminal fusion partner.
Truncations and “Amber” substitutions in TN-XXL
Strong conformational changes such as those demonstrated here might affect fluorescence properties of fused fluorescent proteins by direct conformational coupling onto the β-barrels. To address this issue, which potentially impairs the signal output, we generated a series of four fusion constructs containing only one fluorescent protein (Fig. S2 A). Two constructs contained the calcium-binding domain of TN-XXL fused to one of the fluorescent proteins and lacking the second (TN-XXL ΔcpCit and TN-XXL ΔECFP). In two other constructs, one of the FPs was replaced with a defective FP in which an “Amber”-like 67Cys mutation (45) prevented fluorophore formation yet retained the fully folded β-barrel structure (TN-XXL cpCit° and TN-XXL ECFP°). These constructs acted as reporters for fluorescence changes caused by non-FRET mechanisms. We tested the calcium sensitivity of all constructs with steady-state (Fig. S2, B–G) and time-resolved fluorescence spectroscopy (Table S1). The fluorescence emission of ECFP, either alone or in fusion constructs, was minimally reduced by the addition of calcium (≈2%, Fig. S2, B–D). cpCitrine and all its control constructs maintained stable fluorescence properties at all calcium concentrations (Fig. S2, E–G). Thus, the Ca2+-dependent conformational change does not affect the fluorescence properties of the single FPs.
Fluorescence-lifetime calcium titrations of TN-XXL
To correlate the time-resolved fluorescence signal of TN-XXL with the sensor properties obtained for steady-state FRET spectroscopy, we performed Ca2+ titrations with both methods in parallel and followed the donor fluorescence decay. Due to initial FRET, the overall donor fluorescence lifetime in TN-XXL in zero calcium was already shorter than that of the control construct TN-XXL cpCit°, containing only ECFP (Fig. 4 A, curves 1 and 2, respectively)). Upon saturation with Ca2+, a further shortening of the fluorescence lifetime could be observed (curve 3). For ECFP fluorescence decay, both biexponential fits (46–48) and triexponential fits (49,50) have been reported in vitro and in living cells. In our experiments, the triexponential fit notably improved the quality for the fit of ECFP decay (Fig. 4 A and χ2 values in Table S2). A factorial analysis of the triexponential fit of the Ca2+ titration yielded a surprising distribution of lifetimes and amplitudes (Fig. 4 B and Table S2). Only the shortest of all three lifetimes showed a significant Ca2+ dependency, decreasing by >25% from 0.696 to 0.503 ns. The longer lifetimes, τ2 and τ3, remained unaffected. The relative amplitude α1 of the fast lifetime increased by 28% to 64% at calcium saturation, whereas the amplitudes of the longer, invariant lifetimes dropped by 6% for τ2 and 22% for τ3. It cannot be excluded that the decay represented by these lifetimes has contributions of both the shorter lifetimes of non-FRET donor molecules and less efficient FRET processes compared to those described by τ1. However, the longest lifetime, τ3, at high calcium (12%)—nearly identical in TN-XXL and TN-XXL cpCit°—is doubtless associated with donor molecules that do not undergo FRET. The value of high-calcium α3 is in very good agreement with the fraction of the cpCitrine chromophore that is protonated at pH 7.2 (∼15%; Fig. S3). Thus, in contrast to earlier studies of other FRET-based GECIs, no fraction of nonfunctional biosensors has to be postulated. Instead, at low calcium, TN-XXL molecules exhibit only low FRET efficiency, whereas at high calcium, all ECFPs undergo FRET except for those that are bound to an acceptor with a protonated chromophore. A second possible explanation for a noninteracting fraction of FRET-based indicators could be the photoconversion of the acceptor upon long and intense illumination (51,52). Under our experimental conditions, we found no indication for a substantial contribution thereof, but under fluorescence lifetime imaging (FLIM) conditions with more continuous illumination, this effect might hamper the Δτave signal further. The boundary cases for TN-XXL were obtained at calcium concentrations of 0 and 40 μM and yielded average fluorescence lifetimes of 2.11 and 1.26 ns and therefore an average fluorescence lifetime change, Δτave, of 0.85 ns without prior subtraction of subpopulations. The Ca2+ titration of Δτave showed a sigmoidal curve corresponding to the titration curve obtained by ratiometric spectroscopy (Fig. 4 C). The apparent Kd obtained with the lifetime analysis was 453 nM, in contrast to the Kd of 830 nM determined by intensity-based measurements.
Figure 4.

Fluorescence lifetime spectroscopy of TN-XXL. (A) Upper, Experimental and fitted fluorescence donor decay curves of TN-XXL cpCit° control (curve 1), TN-XXL in the Ca2+-free state (curve 2), TN-XXL in the high-Ca2+ state (curve 3), and the instrument response function (curve 4) (excitation of ECFP at 440 nm and donor emission recorded at 475 nm). Experimental data are fitted with multiexponential functions with amplitude αi and lifetimes τi. Lower, Weighted residuals of bi-and triexponential fits. All resulting parameters are listed in Table S2. (B) Ca2+ dependence of relative amplitudes from the triexponential fit (upper) and normalized fluorescence lifetimes (lower). (C) Ca2+ dependence of the normalized average fluorescence lifetime τave (black). Ratiometric steady-state titration of TN-XXL with ECFP and cpCitrine fluorescence measured with excitation at 432 nm and emission recorded at 475/527 nm (gray). The dotted line represents the half-maximal signal change.
Effects of pH and temperature on TN-XXL
To estimate the sensor performance under different environmental conditions, we tested pH and temperature effects on affinity and kinetics of TN-XXL (Fig. 5 and Table S3). Three temperatures were tested with a constant pH of 7.2. Although the affinity decreased slightly (Kd rising slightly from 830 to 1210 nM, Fig. 5 A), the off-kinetics, represented by the monoexponentially fitted Ca2+ dissociation time constant, tdecay, decreased drastically from 620 ms at 23°C to only 129 ms at 37°C (Fig. 5 C). pH values tested at a constant temperature of 23°C ranged from pH 6.5 to 8.0. TN-XXL affinity increased with pH, dropping from 1030 nM at pH 6.5 to 451 nM at pH 8.0 (Fig. 5 B). The Ca2+ dissociation time constant, tdecay, hereby changed from 620 ms to 425 ms with increasing pH (Fig. 5 D).
Figure 5.
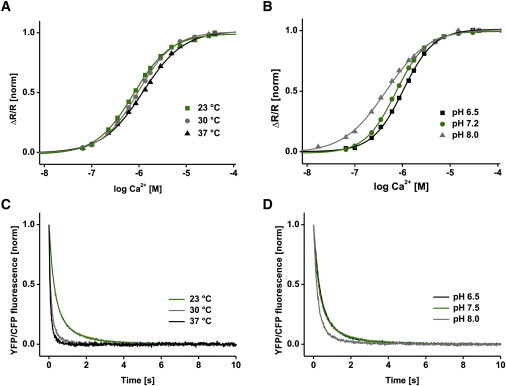
Temperature and pH dependency. (A and B) Ca2+ titration curve of TN-XXL at different temperatures (A) and pH values (B). (C and D) Ca2+-dissociation kinetics of TN-XXL at different temperatures (C) and pH values (D) (excitation at 432 nm and emission recorded at 475/527 nm). All data are normalized averages of three independent experiments in buffer A. All resulting values are summarized in Table S3.
Discussion
Here, we present a biophysical analysis of the FRET-based calcium biosensor TN-XXL (27) using a variety of approaches. The aim of these efforts was to increase our understanding of the modular build-up of a FRET-based calcium sensor to identify optimization potential for rational engineering.
We monitored calcium binding to individual EF-hands of the calcium-binding moiety of TN-XXL by engineering a number of mutants with tyrosine substitutions. This allowed us to determine the affinity and kinetics for binding events in each EF-hand separately. We could divide the four EF-hands of the binding domain of TN-XXL into two distinct classes: EF-hands 3-1 and 3-2 dominate the FRET output of the indicator, whereas calcium binding to EF-hands 4-1 and 4-2 does not contribute detectably to the FRET signal and may have more of a stabilizing function. One avenue of further improvement would be to eliminate completely calcium binding to EF-hands 4-1 and 4-2, thus reducing the buffer capacity of the sensor. As EF-hands typically function in high-affinity binding as pairs that stabilize each other (24), it will be important to maintain the supporting scaffolding function the hands exert on EF-hands 3-1 and 3-2, similar to mutational inactivation of the first of the EF-hands in the N-terminal lobe of human cardiac TnC (53). Our tyrosine fluorescence data show that fusion of fluorescent proteins to the binding domain does not affect sensor kinetics at a detectable level. The matching dissociation time constants suggest a model with concerted slow conformational change of the entire binding domain triggered by initial Ca2+ dissociation rather than with sequential transduction of the conformational change.
We also showed that the large FRET change in TN-XXL after calcium binding is associated with a distinct conformational change of the protein and cannot be related to orientational changes between the fluorophores alone. Analytical ultracentrifugation, size-exclusion chromatography, and SAXS consistently reported an outstretched calcium-free conformation and a large structural change upon calcium binding to a more compact, globular calcium-saturated conformation. The fluorescent donor and acceptor proteins, presumably localized at opposite ends of the elongated structure at zero calcium, thereby move several nanometers closer to each other and associate in close proximity. We complemented our results from SAXS analysis with NMR data on the single C-terminal lobe domain in TN-XXL, indicating that the binding domain adopts a compact folded conformation in the calcium-bound form that is partially lost in the absence of calcium. We conclude that the engineering potential to further improve the indicator's signal strength is twofold. The FRET efficiency in the flexible calcium-free form is more affected by the distance between the two FPs than by a specific orientation. Hence, reducing FRET in the unbound state can most likely be achieved by prolonging the linker sequence. Enhancing the FRET efficiency of the already compact calcium-bound state, however, requires the improvement of the alignment of the two FP β-barrels toward an optimal κ2 value according to the Förster equation. In this case, the binding domain's rigid conformation supports the concept of a confined and optimized orientation. For both strategies, the vast combinatorial possibilities of the required modifications in the amino acid sequence will necessitate high-throughput screening to ensure maximum signal optimization.
The conformational change in TN-XXL does not induce structural distortions of the fluorophores. Using defective donor or acceptor proteins that incorporate the Amber mutation (45), we could observe no additional Ca2+-dependent effect on the fluorescence of ECFP and cpCitrine (Fig. S2). Steady-state fluorescence spectroscopy revealed a strong temperature dependence of the off-kinetics, as well as a pH dependence of off-kinetics and affinity (Fig. 5).
Furthermore, the change of the average fluorescence lifetime, Δτave, of 0.85 ns (YC3.6 shows only 0.46 ns (48)) together with an apparent Kd of 453 nM (Fig. 4 C) make TN-XXL a good starting point to generate GECIs tailor-made for FLIM applications. The apparently higher calcium affinity determined for TN-XXL by titration of the donor fluorescence lifetime compared to that of the fluorescence intensity ratio of acceptor and donor can be explained by the existence of fast FRET processes with rates of 1/300 ps or larger. Indeed, processes in this order of magnitude are faster than the instrument response function of the setup; they therefore cannot be resolved and detected and will be missed in the donor fluorescence lifetime titration. Such efficient FRET processes would shift the apparent fluorescence lifetime change toward lower calcium concentrations and can explain the discrepancy in the Kd values determined by lifetime and ratio. In fact, this difference points toward an experimental problem in microscopic FLIM-FRET studies in cells and tissue. The time resolution practically achievable in measurements in cells and tissue in such studies is even lower (500 ps or longer) compared to measurements of purified GECIs in aqueous solution due to experimental limitations, e.g., lower count numbers or larger scattering amplitudes. As a consequence, fluorescence lifetime calibration of FRET-based biosensors should always be carried out in the same microscope setup and using the same conditions under which the measurements in cells will be performed. Despite the progress in GECI development and their exciting in vivo use in modern fluorescence microscopy studies (8), high impact FLIM applications do not exist yet. This can be mainly attributed corruption of the Δτave due to the low dynamic range of the lifetime change (here 40%, often only 10–20% at most) and the frequently observed complexity of the multiexponential donor fluorescence decay and noninteracting fraction in FRET constructs. Next-generation GECIs might employ improved CFPs such as the latest Cerulean (54) or mTurqouise variants (55), with higher fluorescence quantum yields and monoexponential fluorescence decays.
In conclusion, this study characterizes the genetically encoded calcium indicator TN-XXL in detail and identifies several options that might be bases for further engineering of sensors with improved signal strength, faster kinetics, and reduced buffering potential.
Acknowledgments
The authors thank S. Balfanz, Y. Laukat, B. Kunkel, and A. Moritz for technical assistance, and S. Uebel for help with analytical ultracentrifugation. We acknowledge the synchrotron beam time allocation at X33 (EMBL/DESY Hamburg, Germany) and ID14-3 (ESRF, Grenoble, France), and we thank the respective staffs for excellent support.
This work was supported by the Max-Planck-Society. Additional support came from grants from the European Union Framework 7 program (EuroV1sion) to O.G., the Deutsche Forschungsgemeinschaft (SFB 870) to O.G., the DFG Graduiertenkolleg (GRK1721) to G.W. and K.P.H., and the National Institutes of Health U19 (AI083025) to K.P.H.
Supporting Material
References
- 1.Heim R., Tsien R.Y. Engineering green fluorescent protein for improved brightness, longer wavelengths and fluorescence resonance energy transfer. Curr. Biol. 1996;6:178–182. doi: 10.1016/s0960-9822(02)00450-5. [DOI] [PubMed] [Google Scholar]
- 2.Pollok B.A., Heim R. Using GFP in FRET-based applications. Trends Cell Biol. 1999;9:57–60. doi: 10.1016/s0962-8924(98)01434-2. [DOI] [PubMed] [Google Scholar]
- 3.Miyawaki A., Tsien R.Y. Monitoring protein conformations and interactions by fluorescence resonance energy transfer between mutants of green fluorescent protein. Methods Enzymol. 2000;327:472–500. doi: 10.1016/s0076-6879(00)27297-2. [DOI] [PubMed] [Google Scholar]
- 4.Yasuda R. Imaging spatiotemporal dynamics of neuronal signaling using fluorescence resonance energy transfer and fluorescence lifetime imaging microscopy. Curr. Opin. Neurobiol. 2006;16:551–561. doi: 10.1016/j.conb.2006.08.012. [DOI] [PubMed] [Google Scholar]
- 5.Miyawaki A. Development of probes for cellular functions using fluorescent proteins and fluorescence resonance energy transfer. Annu. Rev. Biochem. 2011;80:357–373. doi: 10.1146/annurev-biochem-072909-094736. [DOI] [PubMed] [Google Scholar]
- 6.Newman R.H., Fosbrink M.D., Zhang J. Genetically encodable fluorescent biosensors for tracking signaling dynamics in living cells. Chem. Rev. 2011;111:3614–3666. doi: 10.1021/cr100002u. [DOI] [PMC free article] [PubMed] [Google Scholar]
- 7.Mank M., Griesbeck O. Genetically encoded calcium indicators. Chem. Rev. 2008;108:1550–1564. doi: 10.1021/cr078213v. [DOI] [PubMed] [Google Scholar]
- 8.Gensch T., Kaschuba D. Fluorescent genetically encoded calcium indicators and their in vivo application. In: Jung G., editor. Fluorescent Proteins II: From Fundamental Research to Bioanalytics. Springer-Verlag; Berlin, Germany: 2012. pp. 125–162. [Google Scholar]
- 9.Nakai J., Ohkura M., Imoto K. A high signal-to-noise Ca2+ probe composed of a single green fluorescent protein. Nat. Biotechnol. 2001;19:137–141. doi: 10.1038/84397. [DOI] [PubMed] [Google Scholar]
- 10.Zhao Y., Araki S., Campbell R.E. An expanded palette of genetically encoded Ca2+ indicators. Science. 2011;333:1888–1891. doi: 10.1126/science.1208592. [DOI] [PMC free article] [PubMed] [Google Scholar]
- 11.Miyawaki A., Llopis J., Tsien R.Y. Fluorescent indicators for Ca2+ based on green fluorescent proteins and calmodulin. Nature. 1997;388:882–887. doi: 10.1038/42264. [DOI] [PubMed] [Google Scholar]
- 12.Miyawaki A., Griesbeck O., Tsien R.Y. Dynamic and quantitative Ca2+ measurements using improved cameleons. Proc. Natl. Acad. Sci. USA. 1999;96:2135–2140. doi: 10.1073/pnas.96.5.2135. [DOI] [PMC free article] [PubMed] [Google Scholar]
- 13.Nagai T., Yamada S., Miyawaki A. Expanded dynamic range of fluorescent indicators for Ca2+ by circularly permuted yellow fluorescent proteins. Proc. Natl. Acad. Sci. USA. 2004;101:10554–10559. doi: 10.1073/pnas.0400417101. [DOI] [PMC free article] [PubMed] [Google Scholar]
- 14.Horikawa K., Yamada Y., Nagai T. Spontaneous network activity visualized by ultrasensitive Ca2+ indicators, yellow Cameleon-Nano. Nat. Methods. 2010;7:729–732. doi: 10.1038/nmeth.1488. [DOI] [PubMed] [Google Scholar]
- 15.Palmer A.E., Jin C., Tsien R.Y. Bcl-2-mediated alterations in endoplasmic reticulum Ca2+ analyzed with an improved genetically encoded fluorescent sensor. Proc. Natl. Acad. Sci. USA. 2004;101:17404–17409. doi: 10.1073/pnas.0408030101. [DOI] [PMC free article] [PubMed] [Google Scholar]
- 16.Heim N., Griesbeck O. Genetically encoded indicators of cellular calcium dynamics based on troponin C and green fluorescent protein. J. Biol. Chem. 2004;279:14280–14286. doi: 10.1074/jbc.M312751200. [DOI] [PubMed] [Google Scholar]
- 17.Pearlstone J.R., McCubbin W.D., Smillie L.B. Spectroscopic analysis of a methionine-48 to tyrosine mutant of chicken troponin C. Biochemistry. 1992;31:9703–9708. doi: 10.1021/bi00155a025. [DOI] [PubMed] [Google Scholar]
- 18.Sorenson M.M., da Silva A.C., Reinach F.C. Concerted action of the high affinity calcium binding sites in skeletal muscle troponin C. J. Biol. Chem. 1995;270:9770–9777. doi: 10.1074/jbc.270.17.9770. [DOI] [PubMed] [Google Scholar]
- 19.VanScyoc W.S., Sorensen B.R., Shea M.A. Calcium binding to calmodulin mutants monitored by domain-specific intrinsic phenylalanine and tyrosine fluorescence. Biophys. J. 2002;83:2767–2780. doi: 10.1016/S0006-3495(02)75286-7. [DOI] [PMC free article] [PubMed] [Google Scholar]
- 20.Filatov V.L., Katrukha A.G., Gusev N.B. Troponin: structure, properties, and mechanism of functioning. Biochemistry (Mosc.) 1999;64:969–985. [PubMed] [Google Scholar]
- 21.Li M.X., Chandra M., Smillie L.B. Properties of isolated recombinant N and C domains of chicken troponin C. Biochemistry. 1994;33:917–925. doi: 10.1021/bi00170a010. [DOI] [PubMed] [Google Scholar]
- 22.Slupsky C.M., Sykes B.D. NMR solution structure of calcium-saturated skeletal muscle troponin C. Biochemistry. 1995;34:15953–15964. doi: 10.1021/bi00049a010. [DOI] [PubMed] [Google Scholar]
- 23.Tsuda S., Miura A., Sykes B.D. Low-temperature-induced structural changes in the Apo regulatory domain of skeletal muscle troponin C. Biochemistry. 1999;38:5693–5700. doi: 10.1021/bi982936e. [DOI] [PubMed] [Google Scholar]
- 24.Gifford J.L., Walsh M.P., Vogel H.J. Structures and metal-ion-binding properties of the Ca2+-binding helix-loop-helix EF-hand motifs. Biochem. J. 2007;405:199–221. doi: 10.1042/BJ20070255. [DOI] [PubMed] [Google Scholar]
- 25.Houdusse A., Love M.L., Cohen C. Structures of four Ca2+-bound troponin C at 2.0 Å resolution: further insights into the Ca2+-switch in the calmodulin superfamily. Structure. 1997;5:1695–1711. doi: 10.1016/s0969-2126(97)00315-8. [DOI] [PubMed] [Google Scholar]
- 26.Mank M., Reiff D.F., Griesbeck O. A FRET-based calcium biosensor with fast signal kinetics and high fluorescence change. Biophys. J. 2006;90:1790–1796. doi: 10.1529/biophysj.105.073536. [DOI] [PMC free article] [PubMed] [Google Scholar]
- 27.Mank M., Santos A.F., Griesbeck O. A genetically encoded calcium indicator for chronic in vivo two-photon imaging. Nat. Methods. 2008;5:805–811. doi: 10.1038/nmeth.1243. [DOI] [PMC free article] [PubMed] [Google Scholar]
- 28.Schuck P. Size-distribution analysis of macromolecules by sedimentation velocity ultracentrifugation and lamm equation modeling. Biophys. J. 2000;78:1606–1619. doi: 10.1016/S0006-3495(00)76713-0. [DOI] [PMC free article] [PubMed] [Google Scholar]
- 29.Tsien R., Pozzan T. Measurement of cytosolic free Ca2+ with quin2. Methods Enzymol. 1989;172:230–262. doi: 10.1016/s0076-6879(89)72017-6. [DOI] [PubMed] [Google Scholar]
- 30.Swindle N., Tikunova S.B. Hypertrophic cardiomyopathy-linked mutation D145E drastically alters calcium binding by the C-domain of cardiac troponin C. Biochemistry. 2010;49:4813–4820. doi: 10.1021/bi100400h. [DOI] [PMC free article] [PubMed] [Google Scholar]
- 31.Kaneko H., Putzier I., Gensch T. Determination of intracellular chloride concentration in dorsal root ganglion neurons by fluorescence lifetime imaging. In: Fuller C.M., editor. Calcium-Activated Chloride Channels. Elsevier Academic; San Diego: 2002. pp. 167–189. [Google Scholar]
- 32.Gensch T., Komolov K.E., Koch K.W. Ca2+-dependent conformational changes in the neuronal Ca2+-sensor recoverin probed by the fluorescent dye Alexa647. Proteins. 2007;66:492–499. doi: 10.1002/prot.21231. [DOI] [PubMed] [Google Scholar]
- 33.Konarev P.V., Petoukhov M.V., Svergun D.I. ATSAS 2.1, a program package for small-angle scattering data analysis. J. Appl. Crystallogr. 2006;39:277–286. doi: 10.1107/S0021889812007662. [DOI] [PMC free article] [PubMed] [Google Scholar]
- 34.Putnam C.D., Hammel M., Tainer J.A. X-ray solution scattering (SAXS) combined with crystallography and computation: defining accurate macromolecular structures, conformations and assemblies in solution. Q. Rev. Biophys. 2007;40:191–285. doi: 10.1017/S0033583507004635. [DOI] [PubMed] [Google Scholar]
- 35.Svergun D.I., Petoukhov M.V., Koch M.H. Determination of domain structure of proteins from x-ray solution scattering. Biophys. J. 2001;80:2946–2953. doi: 10.1016/S0006-3495(01)76260-1. [DOI] [PMC free article] [PubMed] [Google Scholar]
- 36.Volkov V.V., Svergun D.I. Uniqueness of ab initio shape determination in small-angle scattering. J. Appl. Crystallogr. 2003;36:860–864. doi: 10.1107/S0021889809000338. [DOI] [PMC free article] [PubMed] [Google Scholar]
- 37.Wriggers W., Chacón P. Using Situs for the registration of protein structures with low-resolution bead models from x-ray solution scattering. J. Appl. Crystallogr. 2001;34:773–776. [Google Scholar]
- 38.Pettersen E.F., Goddard T.D., Ferrin T.E. UCSF Chimera—a visualization system for exploratory research and analysis. J. Comput. Chem. 2004;25:1605–1612. doi: 10.1002/jcc.20084. [DOI] [PubMed] [Google Scholar]
- 39.Delaglio F., Grzesiek S., Bax A. NMRPipe: a multidimensional spectral processing system based on UNIX pipes. J. Biomol. NMR. 1995;6:277–293. doi: 10.1007/BF00197809. [DOI] [PubMed] [Google Scholar]
- 40.Goddard T.D., Kneller D.G. University of California; San Francisco: 1999. Sparky 3. [Google Scholar]
- 41.Keller R. Cantina-Verlag; Goldau, Switzerland: 2004. The Computer Aided Resonance Assignment Tutorial. [Google Scholar]
- 42.Lebowitz J., Lewis M.S., Schuck P. Modern analytical ultracentrifugation in protein science: a tutorial review. Protein Sci. 2002;11:2067–2079. doi: 10.1110/ps.0207702. [DOI] [PMC free article] [PubMed] [Google Scholar]
- 43.Mertens H.D.T., Svergun D.I. Structural characterization of proteins and complexes using small-angle x-ray solution scattering. J. Struct. Biol. 2010;172:128–141. doi: 10.1016/j.jsb.2010.06.012. [DOI] [PubMed] [Google Scholar]
- 44.Wishart D.S., Case D.A. Use of chemical shifts in macromolecular structure determination. Methods Enzymol. 2001;338:3–34. doi: 10.1016/s0076-6879(02)38214-4. [DOI] [PubMed] [Google Scholar]
- 45.Koushik S.V., Chen H., Vogel S.S. Cerulean, Venus, and VenusY67C FRET reference standards. Biophys. J. 2006;91:L99–L101. doi: 10.1529/biophysj.106.096206. [DOI] [PMC free article] [PubMed] [Google Scholar]
- 46.Tramier M., Gautier I., Coppey-Moisan M. Picosecond-hetero-FRET microscopy to probe protein-protein interactions in live cells. Biophys. J. 2002;83:3570–3577. doi: 10.1016/S0006-3495(02)75357-5. [DOI] [PMC free article] [PubMed] [Google Scholar]
- 47.Millington M., Grindlay G.J., Magennis S.W. High-precision FLIM-FRET in fixed and living cells reveals heterogeneity in a simple CFP-YFP fusion protein. Biophys. Chem. 2007;127:155–164. doi: 10.1016/j.bpc.2007.01.008. [DOI] [PubMed] [Google Scholar]
- 48.Borst J.W., Laptenok S.P., Visser A.J. Structural changes of yellow Cameleon domains observed by quantitative FRET analysis and polarized fluorescence correlation spectroscopy. Biophys. J. 2008;95:5399–5411. doi: 10.1529/biophysj.107.114587. [DOI] [PMC free article] [PubMed] [Google Scholar]
- 49.Habuchi S., Cotlet M., De Schryver F.C. Resonance energy transfer in a calcium concentration-dependent cameleon protein. Biophys. J. 2002;83:3499–3506. doi: 10.1016/S0006-3495(02)75349-6. [DOI] [PMC free article] [PubMed] [Google Scholar]
- 50.Villoing A., Ridhoir M., Pasquier H. Complex fluorescence of the cyan fluorescent protein: comparisons with the H148D variant and consequences for quantitative cell imaging. Biochemistry. 2008;47:12483–12492. doi: 10.1021/bi801400d. [DOI] [PubMed] [Google Scholar]
- 51.Valentin G., Verheggen C., Bertrand E. Photoconversion of YFP into a CFP-like species during acceptor photobleaching FRET experiments. Nat. Methods. 2005;2:801. doi: 10.1038/nmeth1105-801. [DOI] [PubMed] [Google Scholar]
- 52.Kirber M.T., Chen K., Keaney J.F., Jr. YFP photoconversion revisited: confirmation of the CFP-like species. Nat. Methods. 2007;4:767–768. doi: 10.1038/nmeth1007-767. [DOI] [PubMed] [Google Scholar]
- 53.Farah C.S., Reinach F.C. The troponin complex and regulation of muscle contraction. FASEB J. 1995;9:755–767. doi: 10.1096/fasebj.9.9.7601340. [DOI] [PubMed] [Google Scholar]
- 54.Markwardt M.L., Kremers G.-J., Rizzo M.A. An improved cerulean fluorescent protein with enhanced brightness and reduced reversible photoswitching. PLoS ONE. 2011;6:e17896. doi: 10.1371/journal.pone.0017896. [DOI] [PMC free article] [PubMed] [Google Scholar]
- 55.Goedhart J., van Weeren L., Gadella T.W., Jr. Bright cyan fluorescent protein variants identified by fluorescence lifetime screening. Nat. Methods. 2010;7:137–139. doi: 10.1038/nmeth.1415. [DOI] [PubMed] [Google Scholar]
Associated Data
This section collects any data citations, data availability statements, or supplementary materials included in this article.