

Abstract
Nanopore-based DNA sequencing is the most promising third-generation sequencing method. It has superior read length, speed, and sample requirements compared with state-of-the-art second-generation methods. However, base-calling still presents substantial difficulty because the resolution of the technique is limited compared with the measured signal/noise ratio. Here we demonstrate a method to decode 3-bp-resolution nanopore electrical measurements into a DNA sequence using a Hidden Markov model. This method shows tremendous potential for accuracy (∼98%), even with a poor signal/noise ratio.
The field of genomic science has advanced in leaps and bounds since the development of second-generation sequencing technologies, but it still suffers from significant limitations. One such limitation is the read length; for example, Illumina HiSeq2000 is currently limited to <150 basepairs (bp) per read. Increasing error with read length is a functional limitation of processive sequencing methods (1). This dramatically increases back-end bioinformatics processing (i.e., alignment and assembly), a factor that is often overlooked in determining the cost and time required for sequencing (2).
Nanopore-based sequencing provides a potential alternative to current next-generation sequencing methods. Sequencing with the use of a nanopore relies on the electrolytic current that develops when a DNA molecule immersed in electrolyte is forced by an electric field to translocate through a pore (3). This technology has multiple advantages—primarily speed, small sample quantities and long reads (>1 kbp). Although it is difficult to identify the bases from the current signature, investigators have recently made significant progress in this respect (4–6).
One difficulty highlighted by recent work is the resolution of the nanopore. The location and number of bases, which influence the current signature at any given time, are dependent on the dimensions and architecture of the pore. The electrolytic current resolution of the nanopore also presents problems because the sequence-specific modulations of the ionic current are typically not large enough to resolve individual nucleotides above noise (7).
Here we show that although nanopores may not be able to realize single-base resolution, this is not a limitation that precludes DNA sequencing. Using atomic-resolution Brownian dynamics (BD), we simulate the ionic current levels produced by DNA fragments in a nanopore accounting for the 3-bp resolution of the technique (8) (for details of the simulation, see the Supporting Material). We then demonstrate that using a Hidden Markov model (HMM), we can decode the DNA sequence with 98.3% ± 0.1% accuracy.
Fig. 1 A plots the simulated ionic current through a nanopore for all 64 combinations of 3 bp. There are many triplets that are functionally indistinguishable using only the current signature. We can see this clearly by examining GTG and TCG. Typical current values are highlighted in Fig. 1 A for GTG (horizontal green dashed line) and TCG (horizontal red dashed line), and probability density functions are plotted in Fig. S1, A and B. We assume Gaussian distributions for the probability density functions of the different triplet states, with parameters given by the BD simulation. For GTG the triplet state can easily be assigned based solely on the current value; however, for TCG this would be error-prone and impractical. The signal/noise ratio (SNR) given by the BD simulation (17.8 dB) is comparable to that found experimentally for nucleotide discrimination (14.1 dB) (6).
Figure 1.
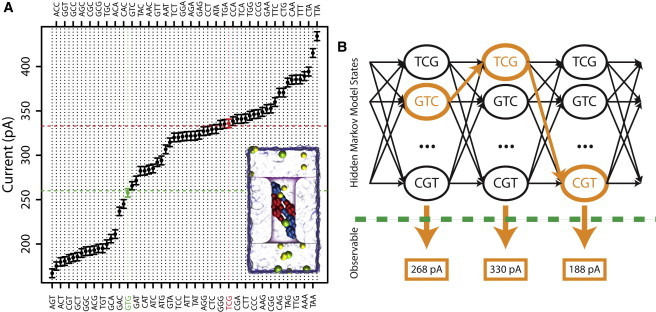
Viterbi algorithm as applied to nanopore base-calling. (A) Current values for all possible DNA triplets (43 = 64) simulated using atomic-resolution BD; error bars indicate the expected standard deviation in ionic current sampled at 1.6 μs. The green dashed line represents a typical current value for the GTG triplet (green point), and the red dashed line represents a typical current value for the TCG triplet (red point). Pictured in the inset is a simulated system for GCC. (B) The Viterbi algorithm operates on a state machine assumption. The operation of Viterbi's algorithm can be visualized by means of a trellis diagram; the Viterbi path is the path that maximizes the joint probabilities through the trellis, colored in orange.
Consider, however, that the current signature at any moment in time is part of a series of observations, and the first two bases of a triplet are defined by the last two of the previous state. If we take a de novo base-calling approach, we would then assume that the third base has equal likelihood of any of the four nucleosides, e.g., TCG must become CGA, CGC, CGG, or CGT, eliminating the majority of possible triplets. Extending this methodology, we can employ an HMM, a statistical model that allows a system to be treated as a chain of indirectly observable states. HMMs have previously been used to classify events from nanopores, but have not been applied to the effect of multiple basepairs on a translocating DNA molecule (9). In our case, we define the state to be the triplet currently in the central constriction of the nanopore. The emission, or observation from the HMM, is the electrolytic current. Due to the ambiguity involved in identifying the exact triplet from the current alone, we calculate the most likely triplet based on possible transitions from the previous state. This is a heretofore unappreciated approach to nanopore signal recovery, and at its core is the idea that each measurement has a dependence on the measurements made before it. This methodology could be applied to either solid-state or biological nanopores (e.g., α-hemolysin has shown multiple base-recognition sites (5)).
An example state diagram for the sequence GTCGT is shown in Fig. 1 B. We assume that DNA is advancing through the pore one base at a time, so the next triplet must be one of four possible triplets (as shown in Fig. S1 C). To determine the sequence, we determine the best path through the state diagram, given by the path that maximizes the total joint probability. We calculate the joint probability using P(I(t)|k) × Tik, where P(I(t)|k) is the probability of a given current measurement for state k, and Tik is the transition probability between previous state j to new state k. The total joint probability is given by δk Πt P(I(t)|kt) × T(t − 1)(t) where δk is the marginal probability distribution of the k hidden states at the initial point (initially, we assign equal probability to each possible state). The Viterbi algorithm determines for each state the best possible combinations of states to reach that point, as follows: Vk(t) = P(I(t)|k) maxi(Vi(t − 1) × Tik). To implement the Viterbi algorithm, we use the HiddenMarkov package in R (10,11) (see Supporting Material for details). We set the transition matrix assuming single base steps, i.e., 0.25 for each of the four possibilities described earlier. The probability densities for the emission of the states are given by Gaussian distributions with parameters set by the BD simulations.
As a test of this method, we generated several simulated signal waveforms for the sequence of λ DNA using different Gaussian random noise levels. We base-called these current signatures (results are shown in Fig. 2). Using the SNR from the BD simulations (17.8 dB) gives a base-calling accuracy of 98.3% ± 0.1%, as compared with 47.1% ± 0.2% using only a single current measurement. A typical experimental SNR, 14.1 dB, gives 88.5% ± 0.2% accuracy using the Viterbi algorithm, but only 38.2% ± 0.2% using a single current measurement. The accuracy level saturates at 25.5 dB at 99.995% ± 0.002%, as compared with 32.5 dB at 83.64% ± 0.07% with a single current measurement.
Figure 2.
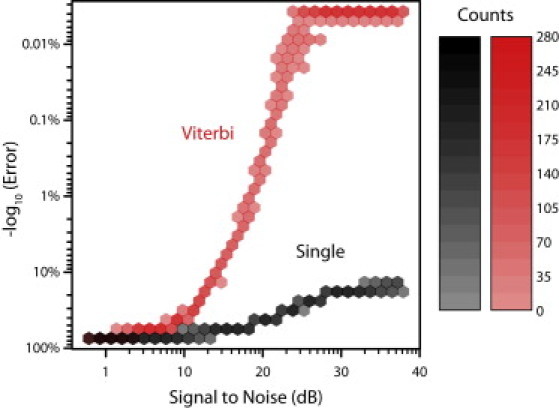
Comparison of the Viterbi method and single current measurement for different SNR levels. Individual simulations base-calling λ DNA using either the Viterbi base-calling method (red) or single current values (black) are plotted as a bivariate histogram (binned hexagonally).
We found similar accuracy for our method using the human genome. Known contig sequences of the human genome were split into 50-kbp fragments. We then generated a noisy current signature (18 dB) using these fragments, and base-called with our method. The median base-calling accuracy for the entire human genome was 98.2% ± 3.9%, compared with 47.4% ± 1.9% using a single current measurement. The distribution of the log error rate of the fragments is plotted in Fig. S2 A, which shows that 48,785 of the 57,368 fragments have accuracy > 98%. We found an error rate dependence on the complexity of the sequence, as measured by the Shannon entropy and plotted in Fig. S2 B (12). A low-complexity sequence tends to have lower accuracy; for entropy < 5, the accuracy is 45.8% ± 24.8%. A high-complexity sequence (entropy > 5) has a higher accuracy rate of 98.4% ± 1.4%. The vast majority of human genome fragments (57,150 of 57,368) had entropy > 5.
To determine whether there was a length dependence for the error rate, we selected randomly sized fragments from a large human genome contig (74 Mb; chr1: 30028083-103863906; hg19). As shown in Fig. S2 C, the accuracy increases with increasing fragment length, as more information is obtained from longer fragments. This stands in stark contrast to most modern sequencing methods, where longer reads tend to have increasing error rates due to dephasing and other issues. Moreover, the time for base-calling scales directly as the length of the read using our current code (Fig. S2 D), meaning that longer reads incur no penalty. Long reads are also favorable for subsequent sequence alignment (2).
We have demonstrated a proposed method for base-calling nanopore data, which leverages multibase resolution and the dependence of each measurement on the previous measurement. Although the results are based on simulated current levels, experimental calibration would allow for direct application. The best calibration method would be to use a period of supervised learning for each pore, during which a control sequence of DNA would be run through the pore and the current signature recorded. The emission matrix of the HMM would be trained on these values, because the underlying state is known. The training set would have multiple instances of each triplet, giving sufficient measurements to estimate the probability density. The distributions need not be normal; the HMM depends only on well-defined distributions, not on their shape. Furthermore, if the translocation rate of the DNA is not constant, the transition matrix can be adapted accordingly. The training set allows us to assign probabilities to each state that remains unchanged. This allows for different triplets to have different translocation rates, which is a distinct possibility.
Acknowledgments
We gratefully acknowledge correspondence with G. Timp and B. Langmead.
This work was funded by the National Institutes of Health (R01-HG005115, 5R01HG003713-03, and F32CA138111), the National Science Foundation (DMR-0955959), and Teragrid (MCA05S028).
Supporting Material
References and Footnotes
- 1.Fuller C.W., Middendorf L.R., Vezenov D.V. The challenges of sequencing by synthesis. Nat. Biotechnol. 2009;27:1013–1023. doi: 10.1038/nbt.1585. [DOI] [PubMed] [Google Scholar]
- 2.Pop M., Salzberg S.L. Bioinformatics challenges of new sequencing technology. Trends Genet. 2008;24:142–149. doi: 10.1016/j.tig.2007.12.007. [DOI] [PMC free article] [PubMed] [Google Scholar]
- 3.Timp W., Mirsaidov U.M., Timp G. Nanopore sequencing: electrical measurements of the code of life. IEEE Trans. Nanotechnol. 2010;9:281–294. doi: 10.1109/TNANO.2010.2044418. [DOI] [PMC free article] [PubMed] [Google Scholar]
- 4.Purnell R.F., Mehta K.K., Schmidt J.J. Nucleotide identification and orientation discrimination of DNA homopolymers immobilized in a protein nanopore. Nano Lett. 2008;8:3029–3034. doi: 10.1021/nl802312f. [DOI] [PubMed] [Google Scholar]
- 5.Stoddart D., Maglia G., Bayley H. Multiple base-recognition sites in a biological nanopore: two heads are better than one. Angew. Chem. Int. Ed. Engl. 2010;49:556–559. doi: 10.1002/anie.200905483. [DOI] [PMC free article] [PubMed] [Google Scholar]
- 6.Manrao E.A., Derrington I.M., Gundlach J.H. Nucleotide discrimination with DNA immobilized in the MspA nanopore. PLoS ONE. 2011;6:e25723. doi: 10.1371/journal.pone.0025723. [DOI] [PMC free article] [PubMed] [Google Scholar]
- 7.Branton D., Deamer D.W., Schloss J.A. The potential and challenges of nanopore sequencing. Nat. Biotechnol. 2008;26:1146–1153. doi: 10.1038/nbt.1495. [DOI] [PMC free article] [PubMed] [Google Scholar]
- 8.Comer J., Aksimentiev A. Predicting the DNA sequence dependence of nanopore ion current using atomic-resolution Brownian dynamics. J. Phys. Chem. C. 2012;116:3376–3393. doi: 10.1021/jp210641j. [DOI] [PMC free article] [PubMed] [Google Scholar]
- 9.Eren A.M., Amin I., Winters-Hilt S. Pattern recognition-informed feedback for nanopore detector cheminformatics. In: Arabnia H.R., editor. Advances in Computational Biology. Springer-Verlag; Berlin: 2010. pp. 99–108. [DOI] [PubMed] [Google Scholar]
- 10.Harte, D. 2010. Mathematical Background Notes for “HiddenMarkov”. Statistics Research Associates, Wellington, New Zealand. URL: http://homepages.paradise.net.nz/david.harte/SSLib/Manuals/notes.pdf.
- 11.R Development Core Team . R Foundation for Statistical Computing; Vienna, Austria: 2011. R: A Language and Environment for Statistical Computing. [Google Scholar]
- 12.Durbin R., Eddy S., Krogh A., Mitchison G. Cambridge University Press; Cambridge/New York: 1998. Biological Sequence Analysis: Probabilistic Models of Proteins and Nucleic Acids. [Google Scholar]
- 13.Heng J.B., Aksimentiev A., Timp G. Beyond the gene chip. Bell Labs Tech J. 2005;10:5–22. doi: 10.1002/bltj.20102. [DOI] [PMC free article] [PubMed] [Google Scholar]
- 14.Aksimentiev A., Schulten K. Imaging α-hemolysin with molecular dynamics: ionic conductance, osmotic permeability, and the electrostatic potential map. Biophys. J. 2005;88:3745–3761. doi: 10.1529/biophysj.104.058727. [DOI] [PMC free article] [PubMed] [Google Scholar]
Associated Data
This section collects any data citations, data availability statements, or supplementary materials included in this article.