

Abstract
The efficacy of cancer drugs such as cisplatin (Cp) and oxaliplatin (Ox), which covalently bind to DNA to form drug-DNA adducts, is linked to their recognition by repair proteins such as HMGB1a. Previous experimental studies showed that HMGB1a's binding affinity for Cp- and Ox-DNA varies with the drug used and the local DNA sequence context of the adduct. We link this differential binding affinity to the free energy of deforming (bending and minor groove opening) the drug-DNA molecule during HMGB1a binding. Specifically, the minimal binding affinity of HMGB1a for Ox-DNA in the TGGA context is explained by its larger deformation free energy compared with Cp-DNA or Ox-DNA in other sequence contexts. Methyl groups on neighboring thymine bases in Ox-TGGA crowd the minor groove and sterically hinder the motion of the diaminocyclohexane ring of Ox, leading to this reduced deformability and resultant decrease in HMGB1a's binding affinity.
Introduction
Platinum-based anticancer drugs, such as cisplatin (Cp) and oxaliplatin (Ox), are widely and successfully used to treat cancer (1,2). This class of drug damages DNA by covalently binding to adjacent purine bases to form drug-DNA adducts, which prevent replication proteins from accessing the genetic code and hence lead to cell death (1,2). Unfortunately, tumor cells can develop resistance to Cp, reducing its effectiveness; however, tumor cells often remain sensitive to Ox despite the similar structure and mode of action of the two drugs (2,3). The causes of this differential tolerance are not completely understood, but cellular damage recognition and mismatch repair systems have been implicated (4). Often, differential drug resistance arises because some of the repair proteins involved in these systems display greater binding affinity for Cp than for Ox (5,6). One particular damage recognition protein, the high-mobility group protein B1 (HMGB1), has been studied in great detail because the A-domain of this protein (HMGB1a) is a model for other HMG-class DNA-binding motifs, which are common in cellular repair mechanisms (7,8).
Most experimental work has focused on consecutive guanines damaged by the platinum-based drugs, because these are the most common adducts (1). The binding affinity of HMGB1a for these adducts depends on both the identity of the drug and the bases flanking the damaged guanines (i.e., the sequence context). Although the binding affinity of HMGB1a for Cp adducts (Cp-DNA) has been studied in numerous sequence contexts, Ox adducts (Ox-DNA) have only been studied in a small subset of the possible sequence contexts (AGGC, CGGA, TGGA, and TGGT). For Cp, it has been found that the binding affinity proceeds in the following order (from highest to lowest affinity): CGGA = TGGA > TGGT > AGGC (5,6,9,10). For Ox, the binding affinity proceeds in a different order: TGGT > AGGC = CGGA ≫ TGGA (5,6). Most remarkably, Ox in the TGGA context (Ox-TGGA) is essentially unrecognized by HMGB1a and has a dissociation constant (KD) similar to that of undamaged B-DNA (5). However, we note that there is some disagreement among previous experimental studies; for instance, the KD for Cp-TGGA estimated by Dunham and Lippard (9) differs by an order of magnitude from that reported by Wei et al. (5). Differences such as these qualitatively change the ordering of the binding affinities for Cp, which clearly complicates quantitative comparisons (see Table S1 in the Supporting Material for additional details and a possible methodological reason for these discrepancies). In all cases of conflict, however, the discrepancies in binding affinity correspond to differences of less than the thermal energy between the two results, indicating that the resolution of the gel mobility shift assay used to obtain these data may be too low to resolve the differences accurately. In light of these conflicting results, we sought to understand the most striking experimental result: the absolute lack of recognition of Ox-TGGA.
In a previous study we focused on the structure and conformational dynamics of Cp and Ox adducts in different sequences (11). First, we found that the ensemble average structure of the HMGB1a-bound drug-DNA was independent of both sequence and drug identity, confirming that the protein-bound drug-DNA structure cannot explain the differential recognition. Next, examining the drug-DNA molecules in the absence of the protein HMGB1a, we found that the ensemble average structural distributions explain only some of the differences in binding affinity. Ensemble averages do suggest a possible explanation for the poor recognition of Ox-TGGA. A large dihedral angle between the damaged guanine bases (also known as the roll angle) is considered favorable for binding because it more easily allows intercalation of a specific phenylalanine residue between the damaged bases, and low twist at the binding site is considered favorable because the HMGB1a-bound drug-DNA is unwound with respect to undamaged B-DNA. At least one of these two structural characteristics (i.e., roll or twist) is favorable for Ox in the AGGC, CGGA, and TGGT sequences, whereas both roll and twist are unfavorable for Ox-TGGA. This provides a plausible case for the weak recognition of Ox-TGGA, but it is not entirely convincing given that the same structural argument does not explain the strong recognition of Ox-TGGT. In keeping with previous simulation studies (12–14), we observed conformational dynamics associated with transient hydrogen bonds that explained some other experimental trends. However, a number of experimental observations remained unexplained, not least of which was the particularly poor recognition of Ox-TGGA. It became apparent that many features, such as the overall bend angle and minor groove width of the drug-damaged DNA structure in the absence of the protein (termed unbound in this work) is intermediate between the undamaged B-DNA and protein-drug-DNA (termed bound here) structures (Fig. 1, a and b). This suggests that the protein must deform the drug-DNA structure substantially during binding (Fig. 1 c). Given that sequence-dependent curvature and flexibility are well-known properties of DNA (15,16), we hypothesized that a high free energy of deformation of the Ox-TGGA molecule and/or high-energy barrier in the kinetic pathway from the unbound to the bound state could explain the lack of recognition of Ox-TGGA. As such, we chose to employ computationally intensive, biased molecular-dynamics (MD) simulations and free-energy calculations to determine the free-energy landscape of Cp-DNA and Ox-DNA in various sequence contexts as a function of reaction coordinates that represent the deformation states.
Figure 1.

The frequency of the helical bend (a) and minor groove width (b) of the unbound drug-DNA structure is intermediate between that of B-DNA and drug-DNA when bound to HMGB1a. (c) Single snapshot of structures of B-DNA, unbound drug-DNA, and drug-DNA when bound to HMGB1a protein. The unbound drug-DNA structure is substantially different from the B-DNA structure. This unbound drug-DNA structure is further substantially deformed during binding by HMGB1a. ΔGdeform corresponds to the free energy required to deform the unbound drug-DNA structure to the drug-DNA structure when bound to HMGB1a, calculated in the absence of the protein.
Materials and Methods
Fig. 1 c illustrates that ΔGdeform is the free energy needed to deform the drug-DNA from the unbound structure to the bound structure. In principle, one could calculate the overall free energy of HMGB1a binding to drug-DNA molecule using a molecular mechanics Poisson-Boltzmann/surface area (MMPBSA) (17), free-energy perturbation (18), or thermodynamic integration (19) method; however, these methods are plagued by low accuracy in entropy calculations for such large molecules, or have difficulty in achieving sufficient sampling for large systems with large conformational changes between the initial and final states. Because we hypothesize that the deformability of the DNA depends on the drug and the sequence context, we focused purely on calculating ΔGdeform, which is a component of the overall free energy of binding, using atomistic MD simulations combined with umbrella sampling, followed by the weighted histogram analysis method (WHAM) (20). Details of our MD protocol are available in Section S2, and details of the umbrella sampling procedure are presented below.
To determine the free-energy landscape, one must define the configurational space, identify reaction coordinate(s) that define the configurational space, and ensure sufficient sampling of structures at all values of the reaction coordinate(s), including those that the system rarely samples in traditional unbiased MD simulations (21–24). Based on our knowledge of the system at hand (Fig. 1, a and b), we chose two reaction coordinates to define the configurational space: the minor groove width and the helical bend angle. We chose these coordinates because our previous work showed that the most notable changes that occur during protein-drug-DNA binding are the helix bending and the minor groove widening, although the exact order in which these changes occur is not known. Fig. 2 qualitatively illustrates the definition of these reaction coordinates. The first reaction coordinate, the minor groove width, is defined as the distance between the center of mass between two groups of backbone atoms, as shown in Fig. 2 a. One of these groups comprises the backbone atoms of one of the guanine bases linked to the drug and base 3′ of that guanine, and the other group comprises the backbone atoms of the cytosine basepaired with the other drug-bonded guanine and base 3′ of that cytosine. The selection of backbone atoms excludes hydrogen atoms. The constraint was applied with the distance collective variable in the NAMD 2.8 colvars module (25). This reaction coordinate is the same as that described by Zacharias (24). The second reaction coordinate, the helical bend angle, is defined as the angle between the top four basepairs of the DNA (red in Fig. 2 b) and the bottom four basepairs (green in Fig. 2 b). When applying the helical bend angle constraint, we maintain a 12-basepair canonical B-DNA structure aligned with the z axis as the reference unbent state. The top four basepairs are constrained to a certain angle with respect to this unbent reference structure by a harmonic potential, using the tilt collective variable, whereas the bottom four basepairs are constrained to maintain the same orientation as their counterparts in the reference structure, using the orientationAngle collective variable. Mathematically, the projection (i.e., the scalar product) of the z axis of the top four basepairs onto the z axis of the reference structure is constrained to a certain value (e.g., 1 to maintain perfect alignment, or 0.707 for an angle of 45°). The z axis of the top four basepairs is determined after a best-fit rotation to fit the reference structure, but no rotational constraint is actually applied to those basepairs. For the bottom four basepairs, the best-fit rotation that maintains the orientation with the reference structure is constrained to the unit quaternion (i.e., no rotation around any axis). We do not need to control the direction of the bend because the DNA is predisposed to bend toward the major groove, the same direction as when HMGB1a binds to DNA. To our knowledge, this definition of a bending reaction coordinate for umbrella sampling has not been reported in literature, but it is similar in nature to other DNA bending reaction coordinates (21,22).
Figure 2.

The reaction coordinates (a) minor groove width, defined as the distance between the centers-of-mass of the two groups of atoms shown here in van der Waals representation, and (b) the helical bend angle defined as the angle between the vector representing the top four basepairs and the corresponding basepairs in an unbent reference structure. The bottom four basepairs (b) are constrained to the same orientation as the corresponding basepairs in an unbent reference structure. The combination of the restraints on the top and bottom basepairs causes the DNA to bend. (Best viewed in color.)
To enable sufficient sampling of all structural states, we employed the umbrella sampling method (26), which introduces a series of biasing potentials at discrete points along the reaction coordinate(s). We combined the results from multiple simulations with different biasing potentials (where each individual simulation is referred to as a window) using WHAM (20,27,28). Initially, we performed one-dimensional (1D) umbrella sampling with only the helical bend constraint. We confirmed that the 1D free-energy profiles as a function of the helical bend angle qualitatively reproduced known trends in flexibility for A-tract DNA, and that the free-energy profiles essentially converged with the amount of sampling we performed (see Fig. S2 and Fig. S3 for details). To understand the differential binding affinity of HMGB1a to the various drug-DNA molecules, the free-energy profile as a function of helical bend angle alone is insufficient. This is because the helical bend angle alone cannot describe the complete configurational space that represents the deformation of the drug-DNA molecule, as during binding the protein not only bends the helix but also widens the minor groove. Therefore, we subsequently performed two-dimensional (2D) umbrella sampling to determine the entire free-energy surface in terms of the helical bend and the minor groove width. Additional details regarding both the 1D and 2D umbrella sampling procedures are provided in Section S3.
We note certain limitations with regard to the force field used in this work and its impact on our free-energy calculations. First, a previous simulation study by Mazur (29) revealed that the persistence length of DNA as parameterized in the Amber force field is ∼80 nm, rather than the typically cited value of 50 nm. Although the apparently greater stiffness of the DNA model may quantitatively affect our results, we believe our results are at least qualitatively accurate because 1), Mazur (29) did not include the recent bsc0 modification used in this work, which better represents the backbone torsion angles and in turn may alter the flexibility of the DNA model; and 2), although there are quantitative differences between the Amber force field and experimental measurements, the differences appear within the range of variations observed with different experimental approaches and solvent conditions (29). Therefore, it seems likely that the Amber force field will produce qualitatively correct results regarding DNA deformability in this work. Second, it is not known how the choice of a different force field to parameterize DNA (e.g., CHARMM) will affect the results of our free-energy calculations. However, recent comparisons of the Amber and CHARMM force fields suggest that they produce very similar results (30,31). It seems plausible that, despite quantitative differences among the various biomolecular force fields, our major qualitative findings would be preserved.
Once we had obtained the free-energy surfaces, we employed the finite-temperature string (FTS) method (32) to find the minimum free-energy pathway (MFEP) between the unbound and bound structures on the free-energy landscapes resulting from 2D umbrella sampling conducted in the absence of the protein. The original zero-temperature string (ZTS) method can be used to find the MFEP on smooth free-energy surfaces where the MFEP literally follows the lowest free-energy values between two or more energy minima (33,34). The ZTS method places a series of points (the string) on the free-energy surface and allows them to evolve according to the gradient of the free energy, analogously to an unbiased MD simulation. However, on rough free-energy surfaces where the roughness is on the order of the thermal energy, the literal MFEP may not be informative because the small-scale details (roughness) of the free-energy surface are unimportant. For example, consider a wide, shallow, free-energy tube connecting two minima but with sinusoidal roughness of much smaller amplitude than the walls of the tube or the depth of the minima: qualitatively, the MFEP should be near the center of the tube, not the long, winding path that avoids the insignificant local maxima of the roughness. The FTS method solves this issue by augmenting the ZTS method with a random force with magnitude similar to the roughness of the surface, analogously to Langevin dynamics. This random force allows the points of the string to overcome minor energy barriers and reach a more reasonable MFEP on rough surfaces. We chose the FTS method to calculate MFEPs because the free-energy surfaces we calculated in this work are not entirely smooth. For our purposes, the initial and final points of the MFEP were fixed at the structural coordinates of the unbound and bound systems from our previous unbiased simulations of the unbound drug-DNA molecule and the HMGB1a-drug-DNA complex, respectively (11). Additional details regarding our implementation of the FTS method are available in Section S3.
Using previous experimental results for the binding affinity of HMGB1a for various DNA sequences, we calculated dissociation constants (KD) using a method described in the literature (13). Subsequently, we used these KD values to estimate the relative binding energy of HMGB1a for Cp versus Ox using the method detailed in Section S4.
Results and Discussion
1D deformability
First, we calculated the 1D free energy as a function of helical bend angle, and the results are presented in Fig. 3. Most notably, we observe large differences between B-DNA (no drug) and the drug-DNA structures. Clearly, the covalent binding of the drug inherently bends the DNA, thereby shifting the minima in the free energy of bending to higher bend angles. The minima of the free-energy curves coincide quantitatively with the average bend from unbiased drug-DNA simulations from our previous structural studies (11). The free-energy profile is roughly quadratic for small perturbations but increases linearly for large deformations, in agreement with previous work that focused on the sequence-dependent deformability of B-DNA (21,35). There are no free-energy barriers along the profile, which is reasonable because bending DNA in the absence of the protein is unfavorable. The presence of the protein during binding would provide additional favorable enthalpic interactions that would make the total binding free energy favorable. However, because here we are simply calculating the free-energy cost for bending the drug-DNA molecule in the absence of the protein (ΔGdeform), the resulting shape of the free-energy curve as a function of helical bend is reasonable.
Figure 3.

Free energy of bending (kcal/mol) for B-DNA, Cp-DNA, and Ox-DNA in four sequence contexts: (a) TGGT, (b) TGGA, (c) AGGC, and (d) CGGA. The dashed vertical lines correspond to the average helical bend angle of the drug-DNA structure from Elder and Jayaraman (11), and the dotted vertical lines correspond to the average helical bend angle of the structure of the drug-DNA when bound to HMGB1a protein. Symbols on these vertical lines denote either Cp (circles) or Ox (squares).
Table 1 shows the 1D bending free-energy change between the unbound and bound states, ΔGdeform,1D, and the difference in this free-energy change between Cp-DNA and Ox-DNA, ΔΔGdeform,1D. If ΔΔGdeform,1D is negative, it simply implies that it is easier to bend Cp-DNA than Ox-DNA. Experimental results suggest that HMGB1a has a more favorable binding affinity for Cp-DNA than for Ox-DNA. Although ΔΔGdeform,1D for the two drugs in the AGGC, CGGA, and TGGT contexts is too low to clearly distinguish the drugs from each other in these contexts, in the TGGA context we find that ΔΔGdeform,1D is much greater, offering some evidence for the much weaker recognition of Ox in this context. Next, we examine the effect of sequence context for the Cp- and Ox-DNA adducts (see Cp and Ox columns of Table 1). For Cp-DNA, the variations in ΔGdeform,1D with sequence context do not correspond to the experimentally determined order in binding affinities, although we reiterate that the reported differences in experimentally observed binding affinity are relatively small and may not be discernible. For Ox-DNA, ΔGdeform,1D is greatest for the TGGA context, further explaining the weak recognition by HMGB1a. However, Ox-TGGT has the second-highest ΔGdeform,1D and yet is known to have the highest binding affinity. Hence, we conclude that the 1D free-energy profile is insufficient to explain all binding affinity trends, and turn to the more-comprehensive 2D umbrella sampling procedure.
Table 1.
Free energy of bending in kcal/mol (ΔGdeform,1D) and the difference in bending free energy of Cp and Ox (ΔΔGdeform,1D)
| Sequence | ΔGdeform,1D Cp | ΔGdeform,1D Ox | ΔΔGdeform,1D (Cp-Ox) |
|---|---|---|---|
| AGGC | 1.14 | 0.94 | 0.21 |
| CGGA | 1.14 | 1.18 | −0.04 |
| TGGA | 1.73 | 2.37 | −0.64 |
| TGGT | 1.27 | 1.57 | −0.30 |
ΔΔGdeform,1D is negative when it is easier to bend Cp-DNA than Ox-DNA. Note that ΔΔGdeform,1D is low for all sequences except for TGGA, in agreement with experimental results showing that HMGB1a easily distinguishes Ox-TGGA from Cp-TGGA and from other sequence contexts.
2D deformability
Fig. 4 shows frequency distributions from unbiased simulations and 2D free-energy landscapes for Cp-TGGA and Ox-TGGA as a function of helical bend angle and minor groove width. The frequency distributions (Fig. 4, a and b) show the most common structure in the unbound state and the bound state. These distributions are used to identify the initial (I) and final (F) coordinates in the free-energy landscapes. The free-energy landscapes (Fig. 4, c and d) show that helical bend and minor groove width are correlated because the free energy increases more gradually when the two coordinates increase in tandem, which is expected because we also observed the positive correlation of helical bend and minor groove width in our structural studies (11). As with the 1D bending free-energy profiles, the 2D landscapes are relatively smooth and lack free-energy barriers. We also find that the drugs have qualitatively different free-energy landscapes, with Ox-DNA generally experiencing a greater increase in free energy with bend angle than Cp. Fig. S4 and Fig. S5 show the free-energy landscapes for all drug and sequence combinations, and Fig. S6 confirms that the 2D free-energy landscapes essentially converged with the amount of sampling we performed. We note that the application of these two global structural constraints also results in many of the same local structural deformations associated with the binding of HMGB1a, such as the increase in the roll angle between the damaged guanine bases, which suggests that this choice of reaction coordinates is reasonable.
Figure 4.

Frequency distributions of the structural parameters from unbiased simulations for (a) Cp- and (b) Ox-TGGA, and 2D free-energy landscapes of deformation for (c) Cp- and (d) Ox-TGGA. The frequency distributions (a and b) were calculated from the combined series of bend angle and minor groove width values visited by both the unbound and bound structures in unbiased simulations. The free-energy landscapes (c and d) were calculated via umbrella sampling and WHAM, as described in the text. White and gray dotted lines are MFEPs from the unbound structure (marked I) to the bound structure (marked F). The multiple MFEPs denote paths calculated from the mean values of the unbound state (I) to multiple endpoints in the bound state (F). The y coordinate of each endpoint (F) is the mean value of the minor groove width. The x coordinate of the endpoint (F) of the white path is the mean value of the bend angle, and the x coordinates of the gray paths are the mean ± SD of the bend angle. Contour lines are spaced 1 kcal/mol apart. White regions indicate the absence of data.
Fig. 4, c and d, also show multiple MFEPs within each landscape. These multiple MFEPs correspond to the path with different final endpoints (marked as F in Fig. 4, c and d) to allow an assessment of the sensitivity of our findings to the structure of the bound state. The MFEPs in Fig. 4, c and d, correspond to three different final structural states: the white pathway ends at the mean values of helical bend (x coordinate) and minor groove width (y coordinate), whereas the two gray pathways end at the mean ± standard deviation (SD) of the probability distribution of the helical bend (x coordinate) and the mean of the minor groove width (y coordinate). These structural coordinates of the helical bend angle and minor groove width were obtained from our previous study (11). The initial point of the pathway (marked as I in Fig. 4) is the same in all cases because that region of the landscape is quite shallow, and consequently changes in the initial structure cause only small changes in the initial energy. We also calculated MFEPs ending at the mean ± SD of the probability distribution of the minor groove width (y coordinate) and mean of the bend angle (x coordinate), but we found that the free-energy values along these pathways (termed free-energy profiles) did not differ significantly from the pathway ending at the mean structural values (i.e., the white pathways in Fig. 4, c and d). We also found that the profiles are insensitive to small deviations in the specific pathway taken by calculating the free-energy profile of a linear pathway between the initial and final states, which produces a free-energy profile similar to that produced by the MFEP (Fig. S7). Consequently, we focus on the three free-energy profiles along the MFEPs ending at the mean ± SD of the helical bend (x coordinate) and the mean minor groove width (y coordinate).
Fig. 5 shows the free-energy values along the points of the MFEPs calculated for all drugs and sequence contexts (i.e., free-energy profiles). The bold lines are for the MFEP ending at the mean structural coordinates (like the white pathways in Fig. 4, c and d) and the dotted lines are for the MFEPs ending at the mean ± SD of the helical bend (like the gray pathways in Fig. 4, c and d). For Cp-DNA, it is not possible to distinguish the sequence contexts because the SD profiles largely overlap the mean profiles of the sequence contexts. However, the situation is quite different for Ox-DNA: although the SD profiles of the AGGC, CGGA, and TGGT sequences essentially overlap each other, the TGGA sequence reaches significantly higher free energies throughout the pathway and does not overlap the other sequences. This provides the strongest evidence yet for the extremely low binding affinity of HMGB1a for Ox-TGGA.
Figure 5.
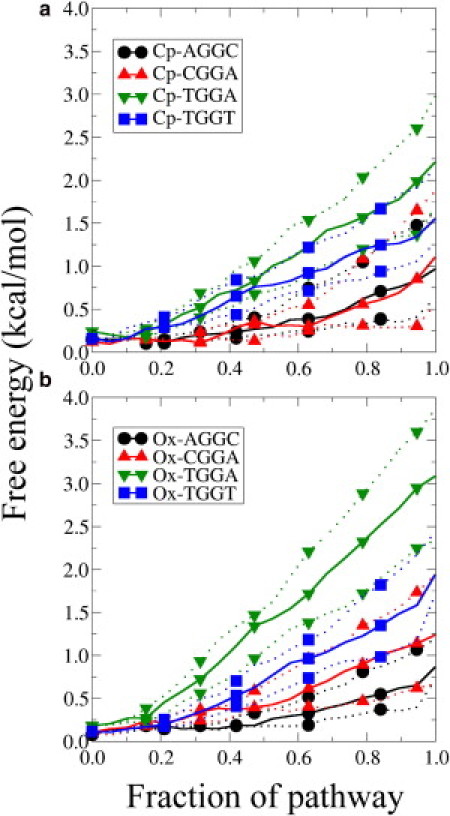
Free-energy profiles along the MFEP of each drug and sequence combination. Bold lines correspond to MFEPs ending at the mean structure of the bound state (white pathways in Fig. 4). Dotted lines correspond to the MFEPs ending at the mean bend angle ± SD of the bend angle and at the mean minor groove width (gray pathways in Fig 4.). The x axis indicates the progress along the pathway, with the unbound state being 0.0 and the bound state being 1.0.
Table 2 shows the differences in 2D deformability free-energy changes for Cp and Ox (ΔΔGdeform,2D), alongside the overall free-energy differences calculated from experimental binding affinity data (ΔΔGbind). We note that a quantitative comparison between the simulation and experimental data is not possible because the experimental data measure the binding free energy of HMGB1a (ΔGbind), whereas the simulation method calculates only the free energy of deformation of the drug-DNA molecule (ΔGdeform) in the absence of the protein. However, qualitative comparisons are still valid. The differences in ΔGdeform between Cp-DNA and Ox-DNA are less than the thermal energy in the AGGC, CGGA, and TGGT contexts, and therefore it may not be possible to distinguish these contexts as discussed above. However, the TGGA context shows a much more significant discrepancy between Cp and Ox, in agreement with the experimental findings for ΔΔGbind.
Table 2.
Relative free energy (kcal/mol) of HMGB1a binding to Cp versus Ox
| Sequence (reference) | KD ratio | ΔΔGbind from KD ratio | ΔΔGdeform,2D |
|---|---|---|---|
| AGGC (6) | 2.6 | −0.56 | 0.10 |
| CGGA (6) | 3.2 | −0.69 | −0.13 |
| TGGA (5) | 55.1 | −2.39 | −0.87 |
| TGGT (6) | 1.8 | −0.35 | −0.39 |
Values are calculated from experimental binding affinity data (ΔΔGbind from KD ratio) and from 2D deformability umbrella sampling calculations (ΔΔGdeform,2D). ΔΔG is the difference in 2D deformation energy between Ox and Cp, i.e., a negative value indicates that deforming Cp-DNA is easier than deforming Ox-DNA.
The cause of this striking difference between Cp- and Ox-TGGA appears to be steric clashes between the bulky diaminocyclohexane ring of Ox and methyl groups on nearby thymine bases (the thymine of TGGA and thymine paired opposite the A of TGGA), as shown in Fig. 6. Methyl groups on these thymine bases extend into the already crowded minor groove even in undamaged B-DNA. These methyl groups were previously shown to alter the flexibility of both undamaged and drug-damaged DNA by interacting with each other in consecutive A-T basepairs or by sterically hindering a platinum-based drug with a bulky chemical group (36,37). The TGGA and TGGT contexts contain two such methyl groups, one on either side of the adduct, and these groups pinch the diaminocyclohexane ring of Ox but do not interact closely with the smaller amine groups of Cp. This is visually evident when one compares the trajectories, and we verified this observation by quantifying the distance between the platinum atom of the drugs and the adjacent methyl groups along the MFEPs. The platinum atom was chosen as a measure of how closely each drug interacts with the methyl groups, because both Cp and Ox contain this feature. In the TGGT context, both Cp and Ox adducts maintain a distance of ∼5 Å from both methyl groups in both the unbound and bound states, suggesting that Cp-TGGT and Ox-TGGT present a similar hindrance during binding (and deformation). In the TGGA context, Cp maintains distances of 5 Å and 9 Å from the two methyl groups in both the unbound and bound states. Ox maintains the same close contact of 5 Å with the methyl group immediately 5′ of the adduct (Me1 in Fig. 6) in the unbound and bound states, but the distance to the methyl group on the opposite DNA strand (Me2 in Fig. 6) decreases from 9 Å to 5 Å between the unbound and bound states. This decrease in distance indicates that Ox interacts more closely with the methyl Me2 in the bound state, and this closer interaction causes a steric hindrance that makes it more difficult to deform Ox-TGGA than Ox in other contexts. The increased difficulty of deformation is likely a major contributor to the lower binding affinity of HMGB1a for Ox-TGGA. In contrast to TGGA, the CGGA context possesses only the methyl group on the strand opposite the drug-DNA adduct (equivalent to Me2 in the TGGA context), and both drugs maintain a platinum-methyl distance of ∼9 Å, indicating lower steric hindrance during deformation of both Cp-CGGA and Ox-CGGA.
Figure 6.

Position of thymine methyl groups (Me1 and Me2) relative to Cp and Ox in the TGGA and TGGT contexts. It is qualitatively evident that the bulky diaminocyclohexane moiety of Ox is pinched between the two methyl groups in the TGGA context (a), which hinders deformation of Ox-TGGA, whereas the smaller amine groups of Cp do not interact strongly with the methyl groups (b). Ox is less constrained by the two methyl groups in the TGGT context (c) than in the TGGA context (a).
Conclusions
In this work, we calculated the free energy of deformation of DNA damaged by the cancer drugs Cp and Ox in several DNA sequence contexts. The results of this study suggest that the greater free-energy penalty for deforming Ox in the TGGA context (compared with Cp and other sequence contexts) is responsible for the extremely low binding affinity of HMGB1a for Ox-TGGA. This result stands in contrast to previous studies that suggested that structure is the key factor in differential binding affinity, but is fully consistent with findings that deformability often plays a crucial role in protein-binding affinity (37–39). The reason for the sequence-dependent deformation free energy of Ox-DNA adducts appears to be steric hindrance by nearby thymine methyl groups, the locations of which depend on the sequence context. Recent efforts focused on steric hindrance between the drug and DNA (40–42), and the work presented here further support the idea that in the future, designers of cancer drugs could focus on tuning repair protein binding by tailoring this type of steric hindrance with adjacent methyl groups.
Acknowledgments
This research was supported in part by the National Science Foundation through TeraGrid resources provided by Kraken under grant number TG-MCB100140. This work also used the Janus supercomputer, which is supported by the National Science Foundation (award number CNS-0821794) and the University of Colorado Boulder. The Janus supercomputer is a joint effort of the University of Colorado Boulder, the University of Colorado Denver, and the National Center for Atmospheric Research.
Supporting Material
References
- 1.Jamieson E.R., Lippard S.J. Structure, recognition, and processing of cisplatin-DNA adducts. Chem. Rev. 1999;99:2467–2498. doi: 10.1021/cr980421n. [DOI] [PubMed] [Google Scholar]
- 2.Wang D., Lippard S.J. Cellular processing of platinum anticancer drugs. Nat. Rev. Drug Discov. 2005;4:307–320. doi: 10.1038/nrd1691. [DOI] [PubMed] [Google Scholar]
- 3.Woynarowski J.M., Faivre S., Juniewicz P.E. Oxaliplatin-induced damage of cellular DNA. Mol. Pharmacol. 2000;58:920–927. doi: 10.1124/mol.58.5.920. [DOI] [PubMed] [Google Scholar]
- 4.Chaney S.G., Campbell S.L., Wu Y. Recognition and processing of cisplatin- and oxaliplatin-DNA adducts. Crit. Rev. Oncol. Hematol. 2005;53:3–11. doi: 10.1016/j.critrevonc.2004.08.008. [DOI] [PubMed] [Google Scholar]
- 5.Wei M., Cohen S.M., Lippard S.J. Effects of spectator ligands on the specific recognition of intrastrand platinum-DNA cross-links by high mobility group box and TATA-binding proteins. J. Biol. Chem. 2001;276:38774–38780. doi: 10.1074/jbc.M106374200. [DOI] [PubMed] [Google Scholar]
- 6.Malina J., Novakova O., Brabec V. Conformation of DNA GG intrastrand cross-link of antitumor oxaliplatin and its enantiomeric analog. Biophys. J. 2007;93:3950–3962. doi: 10.1529/biophysj.107.116996. [DOI] [PMC free article] [PubMed] [Google Scholar]
- 7.Huang J.C., Zamble D.B., Sancar A. HMG-domain proteins specifically inhibit the repair of the major DNA adduct of the anticancer drug cisplatin by human excision nuclease. Proc. Natl. Acad. Sci. USA. 1994;91:10394–10398. doi: 10.1073/pnas.91.22.10394. [DOI] [PMC free article] [PubMed] [Google Scholar]
- 8.Pilch D.S., Dunham S.U., Breslauer K.J. DNA sequence context modulates the impact of a cisplatin 1,2-d(GpG) intrastrand cross-link on the conformational and thermodynamic properties of duplex DNA. J. Mol. Biol. 2000;296:803–812. doi: 10.1006/jmbi.2000.3496. [DOI] [PubMed] [Google Scholar]
- 9.Dunham S.U., Lippard S.J. DNA sequence context and protein composition modulate HMG-domain protein recognition of cisplatin-modified DNA. Biochemistry. 1997;36:11428–11436. doi: 10.1021/bi9709452. [DOI] [PubMed] [Google Scholar]
- 10.Cohen S.M., Mikata Y., Lippard S.J. HMG-domain protein recognition of cisplatin 1,2-intrastrand d(GpG) cross-links in purine-rich sequence contexts. Biochemistry. 2000;39:11771–11776. doi: 10.1021/bi001352l. [DOI] [PubMed] [Google Scholar]
- 11.Elder R.M., Jayaraman A. Role of structure and dynamics of DNA with cisplatin and oxaliplatin adducts in various sequence contexts on binding of HMGB1a. Mol. Simul. 2012 In press. [Google Scholar]
- 12.Sharma S., Gong P., Chaney S.G. Molecular dynamic simulations of cisplatin- and oxaliplatin-d(GG) intrastrand cross-links reveal differences in their conformational dynamics. J. Mol. Biol. 2007;373:1123–1140. doi: 10.1016/j.jmb.2007.07.079. [DOI] [PMC free article] [PubMed] [Google Scholar]
- 13.Ramachandran S., Temple B.R., Dokholyan N.V. Structural basis for the sequence-dependent effects of platinum-DNA adducts. Nucleic Acids Res. 2009;37:2434–2448. doi: 10.1093/nar/gkp029. [DOI] [PMC free article] [PubMed] [Google Scholar]
- 14.Bhattacharyya D., Ramachandran S., Chaney S.G. Flanking bases influence the nature of DNA distortion by platinum 1,2-intrastrand (GG) cross-links. PLoS ONE. 2011;6:e23582. doi: 10.1371/journal.pone.0023582. [DOI] [PMC free article] [PubMed] [Google Scholar]
- 15.Stefl R., Wu H., Feigon J. DNA A-tract bending in three dimensions: solving the dA4T4 vs. dT4A4 conundrum. Proc. Natl. Acad. Sci. USA. 2004;101:1177–1182. doi: 10.1073/pnas.0308143100. [DOI] [PMC free article] [PubMed] [Google Scholar]
- 16.Parkinson J.A., Chen Y., Sadler P.J. Sequence-dependent bending of DNA induced by cisplatin: NMR structures of an A.T-rich 14-mer duplex. Chemistry. 2000;6:3636–3644. doi: 10.1002/1521-3765(20001002)6:19<3636::aid-chem3636>3.3.co;2-n. [DOI] [PubMed] [Google Scholar]
- 17.Srinivasan J., Cheatham T.E., III, Case D.A. Continuum solvent studies of the stability of DNA, RNA, and phosphoramidate-DNA helices. J. Am. Chem. Soc. 1998;120:9401–9409. [Google Scholar]
- 18.Aaqvist J. Ion-water interaction potentials derived from free energy perturbation simulations. J. Phys. Chem. 1990;94:8021–8024. [Google Scholar]
- 19.Rodriguez-Gomez D., Darve E., Pohorille A. Assessing the efficiency of free energy calculation methods. J. Chem. Phys. 2004;120:3563–3578. doi: 10.1063/1.1642607. [DOI] [PubMed] [Google Scholar]
- 20.Kumar S., Rosenberg J.M., Kollman P.A. The weighted histogram analysis method for free-energy calculations on biomolecules. I. The method. J. Comput. Chem. 1992;13:1011–1021. [Google Scholar]
- 21.Curuksu J., Zacharias M., Zakrzewska K. Local and global effects of strong DNA bending induced during molecular dynamics simulations. Nucleic Acids Res. 2009;37:3766–3773. doi: 10.1093/nar/gkp234. [DOI] [PMC free article] [PubMed] [Google Scholar]
- 22.Curuksu J., Zakrzewska K., Zacharias M. Magnitude and direction of DNA bending induced by screw-axis orientation: influence of sequence, mismatches and abasic sites. Nucleic Acids Res. 2008;36:2268–2283. doi: 10.1093/nar/gkm1135. [DOI] [PMC free article] [PubMed] [Google Scholar]
- 23.Spiegel K., Magistrato A., Klein M.L. Azole-bridged diplatinum anticancer compounds. Modulating DNA flexibility to escape repair mechanism and avoid cross resistance. J. Phys. Chem. B. 2007;111:11873–11876. doi: 10.1021/jp0762323. [DOI] [PubMed] [Google Scholar]
- 24.Zacharias M. Minor groove deformability of DNA: a molecular dynamics free energy simulation study. Biophys. J. 2006;91:882–891. doi: 10.1529/biophysj.106.083816. [DOI] [PMC free article] [PubMed] [Google Scholar]
- 25.Phillips J.C., Braun R., Schulten K. Scalable molecular dynamics with NAMD. J. Comput. Chem. 2005;26:1781–1802. doi: 10.1002/jcc.20289. [DOI] [PMC free article] [PubMed] [Google Scholar]
- 26.Torrie G.M., Valleau J.P. Nonphysical sampling distributions in Monte Carlo free-energy estimation: umbrella sampling. J. Comput. Phys. 1977;23:187–199. [Google Scholar]
- 27.Grossfield, A. WHAM: the weighted histogram analysis method, version 2.0.4. http://membrane.urmc.rochester.edu/content/wham.
- 28.Roux B. The calculation of the potential of mean force using computer simulations. Comput. Phys. Commun. 1995;91:275–282. [Google Scholar]
- 29.Mazur A.K. Evaluation of elastic properties of atomistic DNA models. Biophys. J. 2006;91:4507–4518. doi: 10.1529/biophysj.106.091280. [DOI] [PMC free article] [PubMed] [Google Scholar]
- 30.Pérez A., Luque F.J., Orozco M. Frontiers in molecular dynamics simulations of DNA. Acc. Chem. Res. 2012;45:196–205. doi: 10.1021/ar2001217. [DOI] [PubMed] [Google Scholar]
- 31.Liu Z., Ensing B., Moore P.B. Quantitative assessment of force fields on both low-energy conformational basins and transition-state regions of the (ϕ−ψ) space. J. Chem. Theory Comput. 2010;7:402–419. doi: 10.1021/ct100395n. [DOI] [PubMed] [Google Scholar]
- 32.Vanden-Eijnden E., Venturoli M. Revisiting the finite temperature string method for the calculation of reaction tubes and free energies. J. Chem. Phys. 2009;130:194103–194117. doi: 10.1063/1.3130083. [DOI] [PubMed] [Google Scholar]
- 33.Weinan E., Ren W., Vanden-Eijnden E. String method for the study of rare events. Phys. Rev. B. 2002;66:052301. doi: 10.1021/jp0455430. [DOI] [PubMed] [Google Scholar]
- 34.Weinan E., Ren W., Vanden-Eijnden E. Simplified and improved string method for computing the minimum energy paths in barrier-crossing events. J. Chem. Phys. 2007;126:164103–164108. doi: 10.1063/1.2720838. [DOI] [PubMed] [Google Scholar]
- 35.Wiggins P.A., van der Heijden T., Nelson P.C. High flexibility of DNA on short length scales probed by atomic force microscopy. Nat. Nanotechnol. 2006;1:137–141. doi: 10.1038/nnano.2006.63. [DOI] [PubMed] [Google Scholar]
- 36.Malina J., Vojtiskova M., Hambley T.W. DNA adducts of the enantiomers of the Pt(II) complexes of the ahaz ligand (ahaz=3-aminohexahydroazepine) and recognition of these adducts by HMG domain proteins. Biochem. Biophys. Res. Commun. 2005;332:1034–1041. doi: 10.1016/j.bbrc.2005.05.047. [DOI] [PubMed] [Google Scholar]
- 37.Juo Z.S., Chiu T.K., Dickerson R.E. How proteins recognize the TATA box. J. Mol. Biol. 1996;261:239–254. doi: 10.1006/jmbi.1996.0456. [DOI] [PubMed] [Google Scholar]
- 38.Czapla L., Peters J.P., Maher L.J., 3rd Understanding apparent DNA flexibility enhancement by HU and HMGB architectural proteins. J. Mol. Biol. 2011;409:278–289. doi: 10.1016/j.jmb.2011.03.050. [DOI] [PMC free article] [PubMed] [Google Scholar]
- 39.Rohs R., Jin X., Mann R.S. Origins of specificity in protein-DNA recognition. Annu. Rev. Biochem. 2010;79:233–269. doi: 10.1146/annurev-biochem-060408-091030. [DOI] [PMC free article] [PubMed] [Google Scholar]
- 40.Margiotta N., Natile G., Coluccia M. Sterically hindered complexes of platinum(II) with planar heterocyclic nitrogen donors. A novel complex with 1-methyl-cytosine has a spectrum of activity different from cisplatin and is able of overcoming acquired cisplatin resistance. J. Inorg. Biochem. 2006;100:1849–1857. doi: 10.1016/j.jinorgbio.2006.07.010. [DOI] [PubMed] [Google Scholar]
- 41.Kasparkova J., Suchankova T., Brabec V. Cytotoxicity, cellular uptake, glutathione and DNA interactions of an antitumor large-ring Pt II chelate complex incorporating the cis-1,4-diaminocyclohexane carrier ligand. Biochem. Pharmacol. 2010;79:552–564. doi: 10.1016/j.bcp.2009.09.019. [DOI] [PubMed] [Google Scholar]
- 42.Lovejoy K.S., Lippard S.J. Non-traditional platinum compounds for improved accumulation, oral bioavailability, and tumor targeting. Dalton Trans. 2009;48:10651–10659. doi: 10.1039/b913896j. [DOI] [PMC free article] [PubMed] [Google Scholar]
- 43.Macke T.J., Case D.A. Modeling unusual nucleic acid structures. In: Leontis N.B., Santa Lucia J. Jr., editors. Molecular Modeling of Nucleic Acids. American Chemical Society; Washington, DC: 1997. pp. 379–393. [Google Scholar]
- 44.Scheeff E.D., Briggs J.M., Howell S.B. Molecular modeling of the intrastrand guanine-guanine DNA adducts produced by cisplatin and oxaliplatin. Mol. Pharmacol. 1999;56:633–643. [PubMed] [Google Scholar]
- 45.Humphrey W., Dalke A., Schulten K. VMD: visual molecular dynamics. J. Mol. Graph. 1996;14:33–38. doi: 10.1016/0263-7855(96)00018-5. 27–28. [DOI] [PubMed] [Google Scholar]
- 46.Yao S., Plastaras J.P. A molecular mechanics AMBER-type force field for modeling platinum complexes of guanine derivatives. Inorg. Chem. 1994;33:6061–6077. [Google Scholar]
- 47.Brukner I., Dlakic M., Suck D. Evidence for opposite groove-directed curvature of GGGCCC and AAAAA sequence elements. Nucleic Acids Res. 1993;21:1025–1029. doi: 10.1093/nar/21.4.1025. [DOI] [PMC free article] [PubMed] [Google Scholar]
- 48.Pérez A., Marchán I., Orozco M. Refinement of the AMBER force field for nucleic acids: improving the description of α/γ conformers. Biophys. J. 2007;92:3817–3829. doi: 10.1529/biophysj.106.097782. [DOI] [PMC free article] [PubMed] [Google Scholar]
- 49.Hornak V., Abel R., Simmerling C. Comparison of multiple Amber force fields and development of improved protein backbone parameters. Proteins. 2006;65:712–725. doi: 10.1002/prot.21123. [DOI] [PMC free article] [PubMed] [Google Scholar]
- 50.Hambley T.W. van der Waals radii of Pt(II) and Pd(II) in molecular mechanics models and an analysis of their relevance to the description of axial M.H(-C), M.H(-N), M.S, and M.M (M = Pd(II) or Pt(II)) Interactions. Inorg. Chem. 1998;37:3767–3774. doi: 10.1021/ic971392m. [DOI] [PubMed] [Google Scholar]
- 51.Cornell W.D., Cieplak P., Kollman P.A. A 2nd generation force-field for the simulation of proteins, nucleic-acids, and organic-molecules. J. Am. Chem. Soc. 1995;117:5179–5197. [Google Scholar]
- 52.Bondi A. van der Waals volumes + radii. J. Phys. Chem. 1964;68:441. [Google Scholar]
Associated Data
This section collects any data citations, data availability statements, or supplementary materials included in this article.