Abstract
Purpose
Choosing a surgical approach for total hip arthroplasty (THA) has a patient-specific impact on peri-operative muscle damage as well as postoperative functional outcome. Women and aged patients increasingly benefit from minimally invasive surgical procedures. For this reason, and due to the distinctly different bony anatomy of men and women, the hypothesis of this study is that muscle distribution around the hip joint is dependent on sex and age. The goal of this study was to analyse hip musculature in men and women and to correlate total muscle volume distribution.
Methods
From 93 computed tomography (CT) scans of the pelvis (45 men, 48 women) volumes of gluteus medius (GMV), gluteus maximus (GXV) and tensor faciae latae (TFL) muscles were measured on both sides of the pelvis. The distribution of muscle volumes was normalised to patient weight and then correlated with sex and age.
Results
The measured muscle volumes featured no major differences between the left and the right side. The absolute total volume of the hip-encompassing muscular system (TMV) is bigger in men than in women. Correlations between TMV and collected data were observed in both sexes in relation to body weight and size (men p < .00001; women p 0.001). With increased body weight, the TMV of the male patients increased progressively (women 11.2 cm TMV/kg KG vs. men 17.4 cm TMV/kg KG) (p 0.04). The relative distribution of each muscle volume (GMV, GXV, TFL) around the hip joint showed no major differences with respect to sex and/or age (p 0.986 and 0.996, respectively).
Conclusions
The equal relative muscle distribution in men and women around the hip joint reflects neither sex-related differences observed in clinical outcomes after THA nor bony anatomy. Yet men exhibited more muscle reserves (muscle volume; absolute and in relation to body mass) , which could explain the better outcome in men after THA. Furthermore, this suggests the extraordinary importance of muscle-sparing surgical approaches in women. The results represent the rationale for designing and analysing future studies of sex-specific therapies with regard to hip-joint muscles.
Introduction
The question as to which surgical approach available for total hip arthroplasty (THA) is the best for any given patient cannot be answered on the basis of the data currently available in the academic literature. Yet the operating surgeon is required to choose from several different approaches. This decision is often made based on personal preferences, skill and the prevailing philosophy of the surgeon’s institute. It has been shown that some patients benefit more than others from any given surgical approach: for example, the incidence of fatty dystrophy of the muscular system is lower after minimally invasive surgery in patients aged ≥70 years and with a body mass index (BMI) >25 [1, 2]; this is evidenced by improved clinical results following minimally invasive surgery [3, 4]. However, the influence of gender was not explicitly analysed in these populations and was not taken into account in large meta-analyses [5, 6], even though in studies in which—irrespective of the approach—examine predictive factors for the expected outcome after THA have suggested patients’ gender to be an influencing factor with variable character [7–13], and the bony anatomy of the hip and pelvis is sex specific [14–17]. Taking into account the variability of clinical outcomes after THA for female patients, the sex specificity of the bony hip anatomy, as well as the resultant sex-specific osseous–muscular correlations [18], we hypothesised that the absolute and relative distribution of the hip-encompassing muscular system varies between men and women.
The goal of this study was to analyse the total volume and distributions in male and female patients of the muscles essential for hip function. In addition to the gender, the measured parameters were correlated with patient age. Based on sex- or age specificity of muscular distributions around the hip joint, it may be possible to theoretically determine the best patient-specific approach with either the least-possible absolute (approach through the least muscular mass) or least-possible relative (approach through the most muscular mass) peri-operative muscle damage. Knowledge of specific muscular distributions may serve as a basis and a reference point for planning and evaluating studies and meta-analyses of therapies with regard to the hip joint and its encompassing muscular system.
Materials and methods
Patient data for this retrospective study was obtained consecutively from existing computed tomography (CT) scans recorded in data bases of the radiology clinic of the Charité Medical School. The period of investigation was limited to 2003–2008. Exclusion criteria were arthroses with a Kellgren–Lawrence score ≥2; existing total hip prostheses; fractures in the area of the pelvis, femur or tibia and fibula; neurologic diseases; pelvic asymmetry; and CT scans in the prone position. Further excluded were patients with neurological dysfunctions, limited mobility and in poor general health. Clinical data included sex, date of birth, height, weight, admission date and sectional CT images ranging from the iliac crest to the proximal femoral shaft. While complying with exclusion criteria, 93 CT data sets were obtained from 45 men and 48 women. Patient age ranged from 18 to 86 years. Muscles on both the left and right side of 186 hip joints were analysed.
CT scans
Scans were conducted using a Toshiba Aquilion 64® and Philips Mx8000 IDT 16Scanner, with each slice ranging from 3 to 5 mm thick and a gantry inclination of 0°. Pixel sizes ranged between 0.583 and 0.885 mm and were analysed using the Vitrea 2® (Vital Images, MN, USA) software. Patients were scanned in the supine position. Both the left and right sides were analysed. Average values of each patient’s tensor faciae latae volume (TFL), gluteus medius volume (GMV) and gluteus maximus volume (GXV) were calculated, yielding 93 comparable sets of measurements.
Muscle measurement
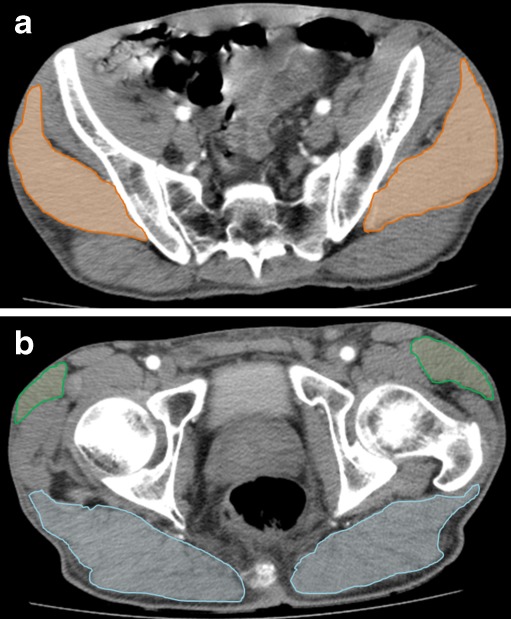
Cross-sectional areas (CSA) (cm2) of the faciae latae, gluteus medius and gluteus maximus muscles were contoured on each slice using a Vitrea2® CT software package. Muscle volumes (ccm) were automatically calculated by the Vitrea 2® software packages as the sum of each CSA, multiplied by slice thickness (Fig. 1a and b).
Fig. 1.
Gluteus medius (a, orange), tensor fasciae latae and gluteus maximus (b, green and blue, respectively) were contoured and marked in each cross-sectional image. Images depict horizontal cross-sections with the estimated biggest cross-sectional surface area (CSA) of the studied muscles. The marked muscle cross-sectional areas were used to calculate muscle volumes using the Vitrea 2®software
Statistical analysis
The data was analysed using descriptive statistics and the Kolmogorov–Smirnov Z test, and the Levene test for normal distribution and homogeneity of variances. Side differences and differences between genders were investigated using paired and unpaired t test, respectively. For correlation analyses, Pearson’s test was used for parametric data. Multi-collinearity was investigated by calculating the variance inflation factor. The chi-square test was used to look for gender- and age-related differences in relative muscle distribution. A p value <0.05 was considered to be significant. Data analysis was performed using the SPSS statistics package 19.0 (SPSS Inc., Chicago, IL, USA).
Results
An analysis of demographic data revealed a normal distribution of age and body size among men and women. There were no major differences between men and women with regard to age and BMI (Table 1).
Table 1.
Demographic data of the studied population. Age, body height and body weight were normally distributed
| Female | Male | P value | |||||||
|---|---|---|---|---|---|---|---|---|---|
| Min | Max | Avg | SD | Min | Max | Avg | SD | ||
| Age | 24 | 82 | 56.3 | 14.4 | 18 | 83 | 58.7 | 16.8 | NS |
| Height | 152 | 180 | 162 | 6.3 | 163 | 200 | 177 | 7.7 | <0.001 |
| Body mass | 44 | 102 | 65.3 | 11.5 | 51 | 130 | 80.2 | 13.9 | < 0.001 |
| BMI | 15.4 | 35.7 | 24.7 | 3.8 | 14.9 | 36.8 | 25.6 | 4.2 | NS |
n number of patients (women 45, men 48), BMI body mass index, Min minimum, Max maximum, Avg average, SD standard deviation, NS not significant
Absolute muscle volumes
There were no significant differences between muscle volumes measured on the left and right sides. Absolute muscle volumes are therefore listed as mean values of the left and right sides (Table 2) and used in subsequent analyses. All absolute muscle volumes were significantly higher in men than in women. Additionally, TMV did not vary with age group (≥70, <70) (p 0.7).
Table 2.
Muscle volumes were not significantly different around the imaged hips. Hence, values used for analysis are the average of the left and right sides. Absolute muscle volumes were significantly higher in men than in women. Patient age had no influence on muscle volumes (p > 0.5);
| Female | Male | P value | |||||||
|---|---|---|---|---|---|---|---|---|---|
| Min | Max | Avg | SD | Min | Max | Avg | SD | ||
| TFL | 19.5 | 80.1 | 44.6 | 15.4 | 29.3 | 90.4 | 57.7 | 14.7 | <0.001 |
| GMV | 150 | 332 | 250 | 40.9 | 139 | 473 | 333 | 68.6 | <0.001 |
| GXV | 233 | 638 | 445 | 92.4 | 198 | 958 | 565 | 140 | <0.001 |
| TMV | 817 | 1.994 | 1.479 | 275 | 736 | 2.766 | 1.913 | 404 | <0.001 |
n number of patients (women 45, men 48), BMI body mass index, Min minimum, Max maximum, Avg average, SD standard deviation, NS not significant, TFL tensor faciae latae, GMV gluteus medius volume, GXV gluteus maximus volume, TMV total musculature volume
Relative muscle volumes
Muscle volumes relative to body size
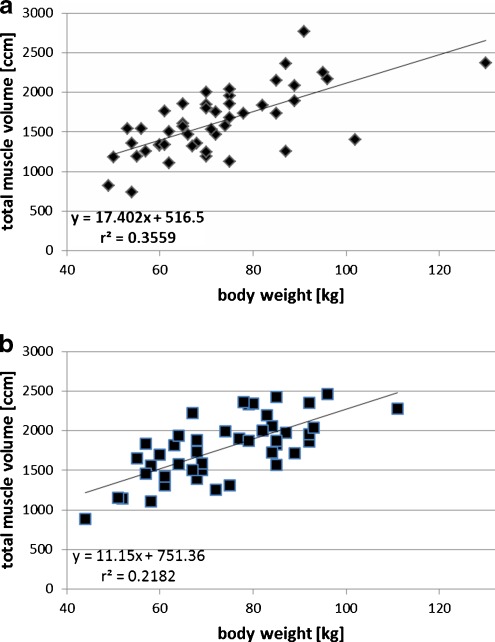
The TMV correlated with the body mass and height for both men and women (p < 0.0001 and p 0.001, respectively). Due to the collinearity of the weight and height (variance factor of inflation 2,399 for body height; 1.526 for body weight), only the correlation between TMV and body weight was subsequently analyzed. The increase associated with the male patient group was much higher (p 0.04); (see rise in trend line and k-value in the formulas in Fig. 2a and b).
Fig. 2.
Correlations between body weight (a) and total musculature volume (TMV) (b); trend lines represent body-weight-dependent increase in TMV in men and women. The increase is significantly steeper in men (p 0.04)
Muscle volume and distribution around the hip joint relative to demographic data
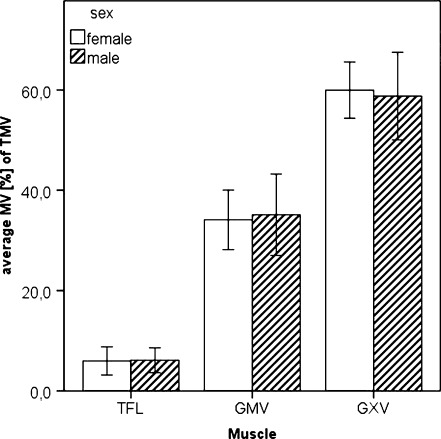
To quantitatively analyse muscle distribution around the hip and make direct comparison between men and women, the proportions of measured single muscle volumes were expressed as a percentage of TMV. There were no detectable differences in the distribution of muscles surrounding patients’ hip joints (Fig. 3).
Fig. 3.
Relative muscle volume distribution around the hip joint as percentage values of total muscle volume men vs. women shows no significant differences
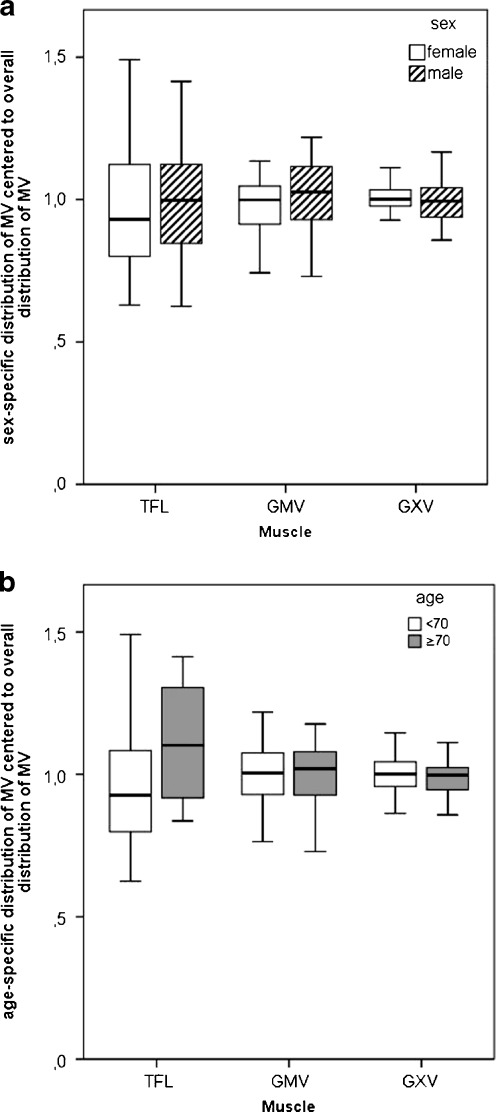
To analyze the influence of sex and age on muscle distribution around the hip joint, the group-specific proportion of each individual muscle volume of TMV was scaled according to the average volume of each respective total population (men, women; young, old) and was averaged for each respective group. Results are shown in Fig. 4a and b. Neither sex nor age had any noteworthy influence on the distribution of muscle volumes (chi-square test p 0.986 and p 0.996, respectively).
Fig. 4.
Relative muscle distribution normalised to average single muscle volumes of (a) men and women and (b) age <70 and ≥70. Distribution did not show any significant sex- or age-related difference. Chi-square test p 0.986 and p 0.996, respectively
Discussion
In this study we could quantify the musculature surrounding the human hip and correlate its volumes and distribution with body size (weight), sex and age in patients without hip arthrosis. Sex-specific differences were observed for the relative and absolute volumes of the muscular system surrounding the hip joint. The absolute TMV of the muscular system surrounding the hip joint was bigger in men than in women. The correlation between body weight and muscle mass was more pronounced in men than in women. Neither sex nor age influenced the relative distribution of muscle volumes. This is the first study of its kind in which muscle distributions close to the hip joint were analysed in a large patient population. The results offer an explanation for better outcomes in men after THA, and the measured values can serve as robust reference values for comparative studies, such as studies of patients with pathologically altered hip joints.
Limitations
Due to the retrospective design of this study, unknown influencing factors cannot be ruled out. For example, individual differences between physical activity levels within the groups may have influenced the volume and distribution of hip muscles. Nevertheless, equilibrium between age and BMI was observed within the studied populations. This, combined with the large number of cases, supports our opinion that the results of this study constitutes reliable comparative data.
Symmetry and absolute volumes
The symmetrical distribution of muscles about the left and the right sides of the patients’ hips is in agreement with the study carried out by Grimaldi et al. [19]. Absolute TFL and GXV muscle volumes measured in this study are admittedly lower than those measured by Grimaldi et al. [19]. GMV measurements, however, produced similar volumes [20]. These differences may be due to the different research methods used in the studies (MR vs. CT), as well as differences in size and age of the study populations (52a vs. 58a, where a stands for “years”; n 12 vs. n 93, where n stands for “number of patients”). Again, unequal levels of activity between patient groups might offer an explanation for the differences in muscle volumes.
Relative muscle volumes
Muscle volume relative to demographic data
Neither gender nor age had a major influence on muscle volume distribution at either side of the imaged hips. It is therefore not possible to use these results as a basis for a sex-specific choice of a surgical approach to achieve the expected least absolute and/or relative muscle damage.
Muscle volumes relative to body sizes
The absolute TMV surrounding the hip joint was larger in men than in women. Correlations between differences in TMV could only be found with regard to body weight and hence body size. Age had no influence whatsoever on TMV. Men exhibited a more distinct correlation with a better predictive muscle volume value with the body mass than women (Fig. 2). Men with an equal increase in body mass featured a more progressive increase in TMV compared with their female counterparts (women 11.2 cm TMV/kg KG vs. men 17.4 cm TMV /kg KG), which suggests that men have a better body mass adaptability. The result of this is that men exhibit a higher TMV normalised to body weight and therefore have more hip muscle reserves to stabilise the pelvis during single-leg stance in the postoperative scenario. As the generated force per unit of muscle volume is not sex specific, a comparison between men and women based on the principle “volume = force” is valid [21, 22].
Clinical implications
The sex-specific, significantly lower, weight-normalised muscle mass in women suggests that during hip-joint surgery on women, it is extremely important to focus on an approach that is most gentle on the muscles (Fig. 2). In the event of identical damage during a surgical approach, relative muscle damage is always greater in women. The larger muscle reserves in men suggests a greater capacity to compensate the inevitable peri-operative muscle injury during THA. Moreover, the fact that men have more muscle reserves offers an explanation as to why men are physically more tolerant towards changes in hip geometry following THA and also why they are generally more content after surgery and suffer fewer postoperative complications than women [13, 21–26]. Based on our study, one could hypothesise that female patients profit more from THA that uses a minimally invasive approach than do men. Considering that each additional surgery causes further muscle damage, poorer functional recovery after revision THA must be expected in women.
Conclusion
The identical relative distribution of muscle volumes around hip joints imaged in this study does not reflect the observed gender-related differences in clinical outcomes after THA and differences in their osseous anatomies. However, the larger muscle volume in men relative to body mass does reflect these sex-specific outcomes after THA in that men have more muscle reserves around the hip. The results offer a reasonable explanation for the greater impact of intra-operative muscle damage on female patients and their higher sensitivity to changes in hip geometry. Moreover, it stresses the importance of choosing a surgical approach to THA in women that causes the least muscle damage. With regards to muscle distribution, this study does not offer recommendations for choosing a surgical approach for THA in male and female patients. Our results do, however, represent the rationale for the design and analysis of future studies in regard to sex-specific therapies for the hip joint and its encompassing muscular system.
Acknowledgments
Disclosure
No financial support was received from any party for this study.
References
- 1.Muller M, et al. Age-related appearance of muscle trauma in primary total hip arthroplasty and the benefit of a minimally invasive approach for patients older than 70 years. Int Orthop. 2011;35(2):165–171. doi: 10.1007/s00264-010-1166-6. [DOI] [PMC free article] [PubMed] [Google Scholar]
- 2.Muller M, et al. Muscle trauma in primary total hip arthroplasty depending on age, BMI, and surgical approach: minimally invasive anterolateral versus modified direct lateral approach. Orthopade. 2011;40(3):217–223. doi: 10.1007/s00132-010-1730-1. [DOI] [PubMed] [Google Scholar]
- 3.Muller M, et al. Evidence of reduced muscle trauma through a minimally invasive anterolateral approach by means of MRI. Clin Orthop Relat Res. 2010;468(12):3192–3200. doi: 10.1007/s11999-010-1378-5. [DOI] [PMC free article] [PubMed] [Google Scholar]
- 4.Preininger B, et al. Earlier postoperative mobilization with minimally invasive hip hemiarthroplasty. Unfallchirurg. 2011;114(4):333–339. doi: 10.1007/s00113-010-1773-0. [DOI] [PubMed] [Google Scholar]
- 5.Smith TO, Blake V, Hing CB. Minimally invasive versus conventional exposure for total hip arthroplasty: a systematic review and meta-analysis of clinical and radiological outcomes. Int Orthop. 2011;35(2):173–184. doi: 10.1007/s00264-010-1075-8. [DOI] [PMC free article] [PubMed] [Google Scholar]
- 6.Cheng T, et al. Minimally invasive total hip arthroplasty: a systematic review. Int Orthop. 2009;33(6):1473–1481. doi: 10.1007/s00264-009-0743-z. [DOI] [PMC free article] [PubMed] [Google Scholar]
- 7.Singh JA, Lewallen DG. Predictors of activity limitation and dependence on walking aids after primary total hip arthroplasty. J Am Geriatr Soc. 2010;58(12):2387–2393. doi: 10.1111/j.1532-5415.2010.03182.x. [DOI] [PMC free article] [PubMed] [Google Scholar]
- 8.Kennedy DM, et al. Preoperative function and gender predict pattern of functional recovery after hip and knee arthroplasty. J Arthroplasty. 2006;21(4):559–566. doi: 10.1016/j.arth.2005.07.010. [DOI] [PMC free article] [PubMed] [Google Scholar]
- 9.Cushnaghan J, et al. Long-term outcome following total hip arthroplasty: a controlled longitudinal study. Arthritis Rheum. 2007;57(8):1375–1380. doi: 10.1002/art.23101. [DOI] [PubMed] [Google Scholar]
- 10.Busato A, et al. Influence of high BMI on functional outcome after total hip arthroplasty. Obes Surg. 2008;18(5):595–600. doi: 10.1007/s11695-007-9412-8. [DOI] [PubMed] [Google Scholar]
- 11.Santaguida PL, et al. Patient characteristics affecting the prognosis of total hip and knee joint arthroplasty: a systematic review. Can J Surg. 2008;51(6):428–436. [PMC free article] [PubMed] [Google Scholar]
- 12.Lavernia CJ, et al. Ethnic and racial factors influencing well-being, perceived pain, and physical function after primary total joint arthroplasty. Clin Orthop Relat Res. 2011;469(7):1838–1845. doi: 10.1007/s11999-011-1841-y. [DOI] [PMC free article] [PubMed] [Google Scholar]
- 13.Ethgen O, et al. Health-related quality of life in total hip and total knee arthroplasty. A qualitative and systematic review of the literature. J Bone Joint Surg Am. 2004;86-A(5):963–974. doi: 10.2106/00004623-200405000-00012. [DOI] [PubMed] [Google Scholar]
- 14.Nakahara I, et al. Gender differences in 3D morphology and bony impingement of human hips. J Orthop Res. 2011;29(3):333–339. doi: 10.1002/jor.21265. [DOI] [PubMed] [Google Scholar]
- 15.Tamari K, et al. Ethnic-, gender-, and age-related differences in femorotibial angle, femoral antetorsion, and tibiofibular torsion: cross-sectional study among healthy Japanese and Australian Caucasians. Clin Anat. 2006;19(1):59–67. doi: 10.1002/ca.20170. [DOI] [PubMed] [Google Scholar]
- 16.Tohtz SW, et al. CT evaluation of native acetabular orientation and localization: sex-specific data comparison on 336 hip joints. Technol Health Care. 2010;18(2):129–136. doi: 10.3233/THC-2010-0575. [DOI] [PubMed] [Google Scholar]
- 17.Unnanuntana A, et al. Evaluation of proximal femoral geometry using digital photographs. J Orthop Res. 2010;28(11):1399–1404. doi: 10.1002/jor.21119. [DOI] [PubMed] [Google Scholar]
- 18.Preininger B, et al. A formula to predict patients' gluteus medius muscle volume from hip joint geometr. Man Ther. 2011;16(5):447–451. doi: 10.1016/j.math.2011.02.003. [DOI] [PubMed] [Google Scholar]
- 19.Grimaldi A, et al. The association between degenerative hip joint pathology and size of the gluteus maximus and tensor fascia lata muscles. Man Ther. 2009;14(6):611–617. doi: 10.1016/j.math.2008.11.002. [DOI] [PubMed] [Google Scholar]
- 20.Grimaldi A, et al. The association between degenerative hip joint pathology and size of the gluteus medius, gluteus minimus and piriformis muscles. Man Ther. 2009;14(6):605–610. doi: 10.1016/j.math.2009.07.004. [DOI] [PubMed] [Google Scholar]
- 21.Akagi R, et al. Muscle volume compared to cross-sectional area is more appropriate for evaluating muscle strength in young and elderly individuals. Age Ageing. 2009;38(5):564–569. doi: 10.1093/ageing/afp122. [DOI] [PubMed] [Google Scholar]
- 22.Akagi R, et al. Relationships between muscle strength and indices of muscle cross-sectional area determined during maximal voluntary contraction in middle-aged and elderly individuals. J Strength Cond Res. 2009;23(4):1258–1262. doi: 10.1519/JSC.0b013e3181918a9b. [DOI] [PubMed] [Google Scholar]
- 23.Morrey BF, et al. Difficult complications after hip joint replacement. Dislocation. Clin Orthop Relat Res. 1997;344:179–187. doi: 10.1097/00003086-199711000-00019. [DOI] [PubMed] [Google Scholar]
- 24.Ali Khan MA, Brakenbury PH, Reynolds IS. Dislocation following total hip replacement. J Bone Joint Surg Br. 1981;63-B(2):214–218. doi: 10.1302/0301-620X.63B2.7217144. [DOI] [PubMed] [Google Scholar]
- 25.Quintana JM, et al. Predictors of health-related quality-of-life change after total hip arthroplasty. Clin Orthop Relat Res. 2009;467(11):2886–2894. doi: 10.1007/s11999-009-0868-9. [DOI] [PMC free article] [PubMed] [Google Scholar]
- 26.Singh JA, Sloan JA. Health-related quality of life in veterans with prevalent total knee arthroplasty and total hip arthroplasty. Rheumatology. 2008;47(12):1826–1831. doi: 10.1093/rheumatology/ken381. [DOI] [PMC free article] [PubMed] [Google Scholar]


