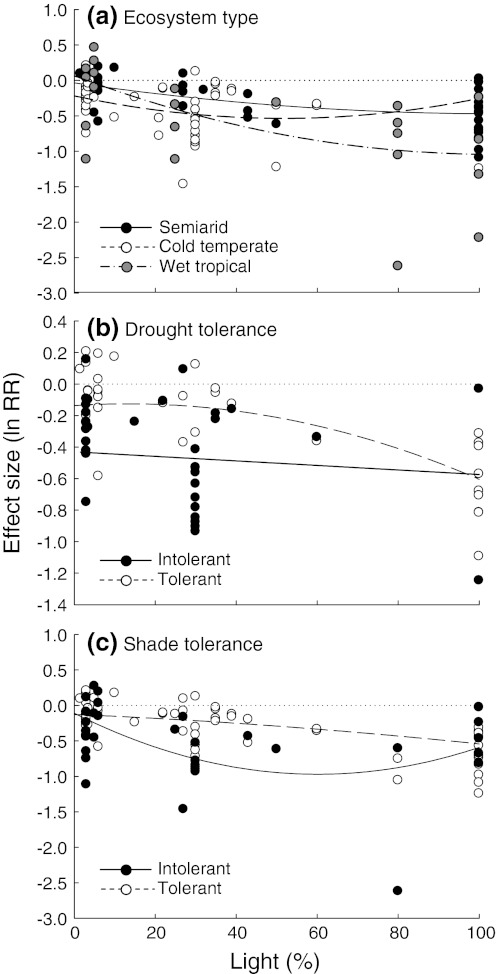
Fig. 3.
Comparison of drought effects on whole-plant biomass along the light gradient between groups of studies that differed in a type of ecosystem (semiarid vs. cold temperate vs. wet tropical), b species drought tolerance (intolerant vs. tolerant), and c species shade tolerance (intolerant vs. tolerant). Only those grouping variables for which differences among groups were detected are shown (see Appendix S11). Dotted lines indicate zero effect sizes

