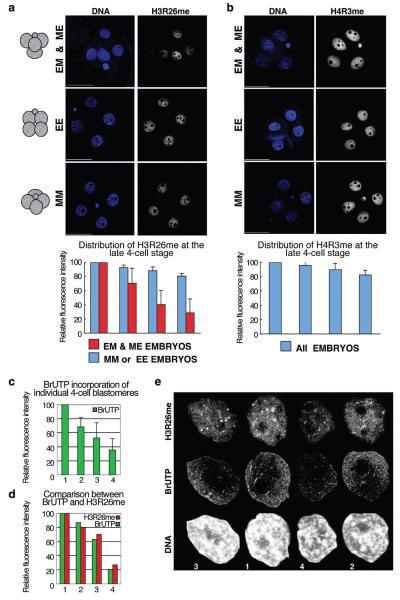
Figure 1.
Levels of H3R26me are different in blastomeres of 4-cell stage embryos and correlate with their spatial arrangement.
(a) 4-cell stage embryos were stained for H3R26me and grouped according to their shape in tetrahedral (EM and ME), EE (flatten,polar body on one side) or MM (flatten,polar body in the middle). Shown are projections, including all sections, of representative embryos.Fluorescence levels were quantified and normalised against the blastomere showing the highest level which was set at 100%. Decreasing values of fluorescence were normalised and averaged accordingly(n=18). Each bar represents the relative fluorescence level of each of the 4 blastomeres. Scale bar 50μm.
(b) Differences in histone arginine methylation levels in 4-cell stage blastomeres are specific:only residues that are CARM1 targets, and not PRMT1, display differential distribution.
(c) 4-cell stage blastomeres display different global transcriptional activity. BrUTP incorporation was measured in sections from nuclei of 4-cell stage embryos captured every 0.6μm (n=12). Projections were used after cropping off the nuclei using the Volocity software to quantify active (nuclear) transcription. Values were normalised as in (a).
(d-e) Global transcription levels correlate with global H3R26me levels. Quantification (d) of BrUTP incorporation (green) and H3R26me (red) of 4-nuclei of a representative embryo. Nuclei (e) are shown at the same scale,numbers at the bottom correspond to the blastomere numbers of the graph.

