Abstract
A challenge for PET/CT quantitation is patient respiratory motion, which can cause an underestimation of lesion activity uptake and an overestimation of lesion volume. Several respiratory motion correction methods benefit from longer duration CT scans that are phase matched with PET scans. However, even with the currently-available, lowest dose CT techniques, extended duration CINE CT scans impart a substantially high radiation dose. This study evaluates methods designed to reduce CT radiation dose in PET/CT scanning.
Methods
We investigated selected combinations of dose reduced acquisition and noise suppression methods that take advantage of the reduced requirement of CT for PET attenuation correction (AC). These include reducing CT tube current, optimizing CT tube voltage, adding filtration, CT sinogram smoothing and clipping. We explored the impact of these methods on PET quantitation via simulations on different digital phantoms.
Results
CT tube current can be reduced much lower for AC than that in low dose CT protocols. Spectra that are higher energy and narrower are generally more dose efficient with respect to PET image quality. Sinogram smoothing could be used to compensate for the increased noise and artifacts at radiation dose reduced CT images, which allows for a further reduction of CT dose with no penalty for PET image quantitation.
Conclusion
When CT is not used for diagnostic and anatomical localization purposes, we showed that ultra-low dose CT for PET/CT is feasible. The significant dose reduction strategies proposed here could enable respiratory motion compensation methods that require extended duration CT scans and reduce radiation exposure in general for all PET/CT imaging.
Keywords: attenuation correction (AC), PET/CT, ultra-low dose CT
1. Introduction
Positron Emission Tomography (PET) combined with X-ray Computed Tomography (CT) has shown great benefits for oncology diagnosis and staging during the last decade (Weber 2005, Weber 2009). There has been increasing interest in PET quantitation in oncology (Herrmann et al 2009, Wahl et al 2009). Quantitative assessment of therapy-induced changes in tumour 18F-FDG uptake may allow for the prediction of tumour response and patient outcome very early in the course of therapy (Weber 2006).
The CT component in a PET/CT system not only provides precise anatomical localization of regions identified on the PET tracer uptake images, but is also used for attenuation correction (CTAC) of the PET emission data, an essential step for quantitative PET imaging (Beyer et al 2000, Wahl et al 1993, Kinahan et al 1998).
One challenge of PET quantitation for lung cancer imaging is patient respiratory motion (Park et al 2008), which can cause an underestimation of standardized uptake values (SUV) and an overestimation of lesion volume (Park et al 2008, Pevsner et al 2005, Liu et al 2009). Several groups have proposed methods to address the PET/CT quantitation problems caused by respiratory motion for lung imaging. For example, Kawano et al. and Nehmeh et al. proposed breath-hold methods, but these may be poorly tolerated by a large fraction of the population, particularly ill individuals (Kawano et al 2008, Nehmeh et al 2007). Other proposed methods include: respiratory gated 4D PET/CT (Nehmeh et al 2004a, 2004b, Pan et al 2004), post processing methods (Dawood et al 2006), and motion corrected PET reconstruction (Thielemans et al 2006, Qiao et al 2007, Qiao et al 2006, Li et al 2006, Kinahan et al 2006). Most of these methods depend on accurate respiratory-gated CT images that are phase-matched with respiratory-gated PET images. When the CT data are acquired and reconstructed in a different respiratory phase than the PET data, there will be mismatches between CT and PET, leading to a degradation of the quantitative accuracy of the PET images.
Such mismatches occur due to respiratory pattern variability (Liu et al 2009). Pan et al (2006, 2007) and Chi et al (2007) have recommended CT acquisitions of 5–14 s per image plane to improve phase matching. This would increase patient radiation dose dramatically compared to current static acquisition protocols. For example, in order to image respiratory motion with CT, at least a 200 mm length of the thorax region needs to be scanned continuously for 5–6 seconds. Even while operating the CT scanner at its lowest possible setting (10 mA), this imparts an effective dose roughly of 2.7 mSv. If a longer duration (15 s) and extend cine scan range covering both thorax and upper abdomen region (e.g. 400 mm) are required, this would increase the radiation dose over 3 times. When added with the whole body helical CT scan, even with current low dose protocols, the total radiation dose from CT would be substantially higher. Table 1 gives the typical patient radiation effective doses in PET/CT and CT imaging. In both cases (for PET and CT) we are using the effective whole-body dose calculated using the procedures recommended by ICRP reports 103 (ICRP, 2007) and 106 (ICRP, 2008).
Table 1.
Typical radiation doses from PET/CT and CT scans.
| Type | Techniques | Effective Dose (mSv) | References |
|---|---|---|---|
| PET | Recommended administration 190 MBq 18F-FDG (in 3D mode) | 3.6 a | Boellaard et al 2010 (EANM guidelines) |
| Dx CT | Wide range of settings reported. Coverage: C+A+P | 7 – 43 | NCRP Report 160, 2009. Table 4.2 |
| LD-HCT | 110 – 120 kVp, 30 – 60 mAs, 0.75 – 6.5 mm slice collimation, 1.25 – 2.0 pitch. Scan axial coverage: 851 – 910 mm | 1.3 – 4.5 Geometrical mean 2.4 Total for PET/CT: 6.0 |
Brix et al 2005. Table 2 |
| LD-CINE-CT | 120 kVp, 5mAs, 8 × 2.50 mm collimation, 6s cine duration. Cine-CT scan coverage: 200 mm over thorax area | 2.7b | Pan et al 2006 |
| LD-HCT + Ext LD-CINE-CT | Cine scan: 15 s duration with 400 mm axial coverage. HCT axial scan coverage: 900 mm | 13.5 (cine-CT) + 2.4 (HCT) = 15.9 (all CT)b + 3.6 (PET) = 19.5 (total) | Based on Pan et al 2006 |
| LD-HCT + Ext ULD CINE-CT | HCT axial coverage: 500 mm (400 mm coverage from cine-CT) | 1.35 (cine-CT) +1.33 (HCT) = 2.7 (all CT)b + 3.6 (PET) = 5.3 (total) | Proposed in this paper |
Abbreviations: Dx CT = Diagnostic CT, HCT = Helical CT. LD-HCT = Low Dose HCT for PET/CT. LD-CINE = Low Dose Cine CT. Ext LD-CT = Extended duration and coverage Low Dose Cine CT. Ext ULD CINE-CT = Extended duration and coverage Ultra-Low Dose Cine CT. C+A+P = CT scan range of chest, abdomen, and pelvis, roughly equivalent to ‘whole-body’ range used in PET/CT.
Effective PET dose calculated based 1.9E-02 mSv/MBq from ICRP report 106, 2008 (Table C.9.4).
Effective CT dose calculated with ImPACT CT Dosimetry tool (v 1.0.4).
Under the constraint of using a standard clinical X-ray CT scanner, there are several potential methods for reducing CT radiation dose and for reducing the bias and noise that are characteristic of low dose CT images (Xia et al 2009). Potentially the most important of these is the recognition that diagnostic CT images usually have a higher signal to noise ratio than is necessary for CT-based PET attenuation correction (CTAC) and motion estimation. This recognition allows for the use of several simple strategies to enable CT radiation dose reduction while maintaining or improving PET image quality (Colsher et al 2008, Xia et al, 2009).
In this paper, we investigate selected combinations of dose reduced acquisition and noise suppression methods to enable ultra-low dose CT-based PET attenuation correction, benefiting from the reduced requirement of CT for PET AC. These methods include reducing CT tube current, optimizing CT tube voltage, adding filtration, CT sinogram smoothing and clipping. We explore the impact of these methods on PET quantitation via simulations on different phantoms. We define “ultra-low” dose to denote dose that is approximately an order of magnitude lower than current low dose CT protocols on PET/CT scanners. This significant radiation dose reduction can then be translated to longer duration CT scans, enabling PET respiratory motion correction methods, as well as general reduction in patient radiation dose. We evaluate bias, noise, and root-mean-square-error in both CT images and attenuation corrected PET images for each investigated methods.
2. Materials and Methods
2.1. Simulation tool
We use the Computer Assisted Tomography SIMulator (CATSIM) for the simulation of the X-ray CT imaging. It includes a Monte Carlo based simulation package called CATDOSE for estimation of the CT radiation dose. Both CATSIM and CATDOSE have been validated relative to GE Lightspeed Volumetric Computed Tomography (Lightspeed VCT, General Electric Medical Systems, Waukesha, WI) measurements for a series of properties (De Man et al 2007). The CT simulation models effects of the X-ray source focal spot, tube spectra, beam conditioning, detector noise, bowtie filter, scatter, and beam hardening.
CT raw data yi at sinogram index i, are formed from the combination of a quantum noise process pi and electronic noise zi, i.e., yi = pi + zi, following methods described by (De Man et al 2001), similar to the methods described by others (La Riviere 2005, Whiting et al 2006). Electronic noise zi is modelled as a Gaussian random process, zi ~ N(d, σe2), where d is the dark current, and σe, is the standard deviation of the electronic noise. The quantum noise is modelled as:
Where k is the energy bin index, fC is a factor to convert from keV to the number of electrons, and xik follows a Poisson random process with parameter λik, xik ~ P(λik).
where λ is the detector quantum efficiency (fraction of photons absorbed), Aik is the number of photons arriving at the detector without attenuator for energy bin k, s is the beam sub-sampling index, liso is the intersection length between the line with index is and the object element with index o, μok is the linear attenuation coefficient of object at o at energy k, and yik’ is the estimated scatter signal.
The PET images are simulated with a simplified version of ASIM5 (Comtat et al 1999), which includes the physical effects of attenuation, background noise, and photon counting. The noisy prompt coincidences p̃ follow a Poisson pseudo-random process with mean m, (p̃ ∼ P(m) ), defined as
where t represents the true coincidences; b is the background noise including scattered and random coincidences; and αt and αb are global scale factors for true coincidences and background noise respectively.
Both CATSIM and ASIM are projector-based simulation methods, which allow for rapid generation of multiple independent and identically distributed (i.i.d.) realizations of data.
2.2. Test objects
Two test phantoms were used. The first was a uniform 20 cm × 30 cm elliptical water cylinder, with a 10 cm axial dimension, containing uniform activity with count levels of a typical whole-body FDG PET scan. The second was derived from the NURBS-based cardiac-torso (NCAT) phantom (Segars 2001, Segars et al 2008), with focal FDG uptake in a 1.6-cm-diameter bone lesion and a 6-cm-diameter soft tissue lesion. The activity distribution was set at background: liver: lung: lesion as 1:3:0.7:6. The elliptical phantom allowed for systematic evaluation of each dose-reduction method on PET quantitation for uniform soft tissues. The NCAT phantom was used for a more realistic study of lesion quantitation with selected combinations of acquisition parameters representing clinical settings.
2.3. Data flow and parameters
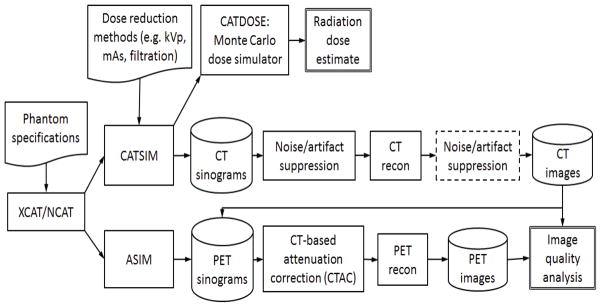
Figure 1 shows the simulation data flow, where the CT images generated by CATSIM were used to estimate the linear attenuation coefficients at 511 keV for PET attenuation correction. A modification of the bilinear scaling method was used (Kinahan et al 2003, Burger et al 2002). In this method, two scaling factors (one for water/air mixtures and the other for water/bone mixtures) are used to calculate the 511 keV attenuation values for PET energy directly from the CT numbers. The scaling factors are optimized for different kVp settings from the CATSIM data since the ground truth was known in these studies.
Figure 1.
Data processing flow used for the simulation studies. The processing step in the dotted box is not included in this study.
In each simulation, only a single trans-axial section of the phantom was scanned. We used CT step-and-shoot mode with a gantry rotation time of 0.5 second. The beam conditioning included 2 mm of graphite nearest the X-ray source, followed by 0.25 mm of aluminium. Beam hardening correction was applied to the sinogram, based on the polynomial correction method (Hsieh 2009). The CT slice thickness was 3.125 mm, comparable with the PET slice thickness. All CT images were reconstructed to the size of 128 × 128 pixels using filtered back projection (FBP) over a 50 cm field of view (FOV) to match PET image dimensions. Unless otherwise specified, the attenuation corrected PET images were reconstructed using FBP to an image size of 128 × 128 pixels over 50 cm FOV.
2.3.1. CT radiation dose reduction through acquisition parameters and spectral shaping
CT electronic noise, zi, was added to the Poisson distributed projection data. For the elliptical water phantom, the variance of zi was set to different levels {64, 160, 400 photons} of quantum noise to reflect previous studies that modelled electronic noise based on the performance of previous generation CT data acquisition systems (La Riviere et al 2006). For each combination of tube voltage {80, 100, 120, 140} kVp and tube current {0.5, 1, 5, 10, 20, 25, 50, 100, 500} mA, we generated 20 i.i.d. data realizations for a total of 720 simulations at each electronic noise level for the water cylinder phantom.
Spectral shaping was performed by adding Cu (Z=29) filters of varying thickness. We modelled X-rays travelling through primary filters of Cu with varying thicknesses, then through a standard bowtie filter. The post-bowtie spectra were evaluated in terms of mean energy and transmission efficiency (TE), which is defined as the sum of photons in the full spectra divided by the sum of photons in the full spectra with no added filter. With a 160 photon equivalent electronic noise level, for each combination of {120, 140} kVp, {0.5, 1, 5, 10, 20, 25, 50, 100, 500} mA, and {0.25, 0.5, 1.0} mm thickness of copper filtration, we generated 20 i.i.d. data realizations for a total of 1080 simulations for the water cylinder phantom.
2.3.2. CT noise and artefact reduction by sinogram smoothing
The 160 CT sinograms of the water cylinder phantom (simulated with 140 kVp, no copper filtration, electronic noise of 160 photons) were filtered by 2D 3×3 boxcar smoothing, followed by an adaptive trimmed mean filter (ATM) (Hsieh 1998, Colsher et al 2008, Xia et al 2009).
Next, scans of the NCAT phantom were simulated at CT parameters of 120 kVp, 0.5 mm added copper filtration, with electronic noise on the order of 10 photons worth of quantum noise. This noise setting reflects the performance of newer generation CT systems. Several CT tube currents were simulated {1, 5, 10, 20, 50, 100, 500} mA (with one realization for each). Different 2D boxcar smoothing level ({3×3, 3×5, 5×5, 7×7, 11×11}) followed by ATM were applied on each of the acquired CT sinograms respectively, making a total of 35 combinations of smoothing level and mA level. The attenuation corrected PET images were reconstructed using both FBP and weighted OSEM (16 subsets, 14 iterations) followed by Gaussian post-filtering (5 mm FWHM) on 128 × 128 pixels over a 50 cm FOV.
2.4. Metrics
For all the above simulations, CT radiation dose was calculated with CATDOSE, where the mean absorbed dose (mGy) for the central slice of the phantom was evaluated. We then measured the bias, noise, and root mean square error (RMSE) for the reconstructed CT and PET images. For simulations of the NCAT phantom, 5 different regions of interest (ROIs) were drawn, as shown in Figure 2. Table 2 lists the ROI specifications. We then measured the image bias, image roughness noise and RMSE. For the water cylinder simulations with multiple realizations, corresponding ensemble metrics for CT and PET were also calculated with eighteen 2D ROIs of radius of 2 cm each, drawn on a cross-section of the phantom for each realization.
Figure 2.
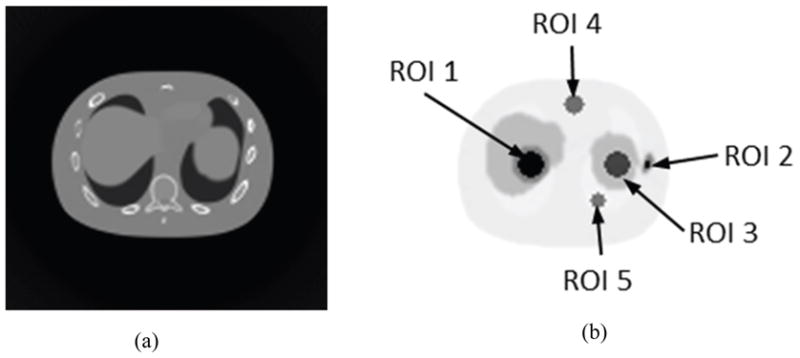
(a) Sample images of noise-free CT and (b) corresponding noise-free PET (right) of the NCAT phantom used for simulation with different ROIs drawn on the cross-section image of the NCAT phantom.
Table 2.
ROI specification.
| ROI | Radius (cm) | Region |
|---|---|---|
| 1 | 2 | hot spot in liver |
| 2 | 0.5 | hot spot in bone |
| 3 | 2 | cold spot in spleen |
| 4 | 1.6 | cold spot in background fat tissue |
| 5 | 1.2 | cold spot in lung |
Bias
For realization r (r =1, 2, …R), the mean of pixels in the k th ROI (k = 1, 2, …, K) is denoted as mr,k, m̄r is the mean pixel value over all ROIs in realization r, and M is the mean of m̄r over R realizations. Mean bias, B, is calculated as the difference between M and the true value T. Since the true value is constant, we calculate the standard error of the mean M for all realizations SEM as follows
where , fir is the value of pixel i in realization r and I is the total pixel number in each ROI.
Noise
Two types of noise were measured, image roughness noise and ensemble noise (Tong et al 2010).
-
Image roughness: For ROIk and realization r, we measured image roughness IRr,k by calculating the standard deviation of the pixel values inside the ROI. We define the mean image roughness, IR as the mean over r and k of the measured IRr,k and evaluate the standard error of mean IR (SEIR) as well.
where , fir is the value of pixel i in realization r and I is the total pixel number in each ROI.
-
Ensemble noise: For each ROIk, we define the ensemble noise ENk as the standard deviation of ROI means mr,k across the R realizations, and average this value over all ROIs to obtain the final mean ensemble noise EN for the uniform background. The standard error of mean ensemble noise SEEN is also calculated.
where , fir is the value of pixel i in realization r and I is the total pixel number in each ROI.
Ensemble Root Mean Square Error
For each realization r, we measured RMSEr, by calculating the root mean square error between all the measured and the true pixel values inside the object. We define the ensemble RMSE as the mean over R realizations of the measured RMSEr and evaluate the standard error of mean RMSE (SERMSE) as well.
where , fir is the value of pixel i in realization r, fit is the truth value of pixel i, and I is the number of total pixel in the object.
3. Results
3.1. Impact of acquisition parameters and spectral shaping on CT radiation dose reduction
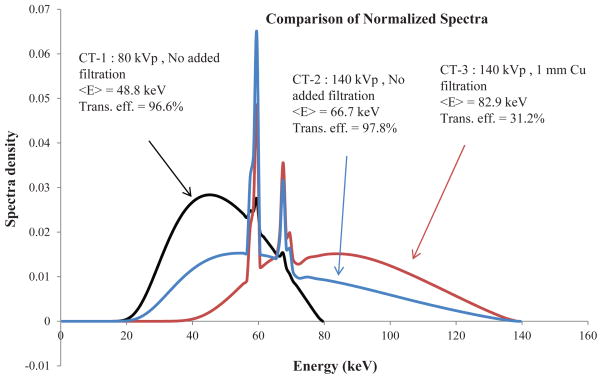
Figure 3 shows the normalized spectra of the 80 kVp without added filtration, 140 kVp without added filtration and 140 kVp with 1 mm Cu beam filtration. It also shows the mean energy and relative photon flux transmission efficiency for each spectrum. Table 3 lists the mean energy and transmission efficiency of the spectra for all kVp settings with added Cu filtration of various thicknesses. As expected, increased filtration thickness increases the mean energy and reduces transmission efficiency.
Figure 3.
Spectra for three CT acquisitions with mean energy and relative photon flux transmission efficiency.
Table 3.
Mean Energy and Transmission Efficiency comparison corresponding to the normalized spectra density with different filtration thickness at various kVp settings.
| Cu (mm) | Property | 80 kVp | 100 kVp | 120 kVp | 140 kVp |
|---|---|---|---|---|---|
| 0 | Mean Energy (keV) | 48.8 | 56.0 | 61.9 | 66.7 |
| Transmission Efficiency (%) | 96.6 | 97.2 | 97.6 | 97.8 | |
| 0.25 | Mean Energy (keV) | 54.1 | 61.7 | 67.9 | 72.9 |
| Transmission Efficiency (%) | 48.5 | 57.9 | 63.7 | 67.3 | |
| 0.5 | Mean Energy (keV) | 57.2 | 65.1 | 71.6 | 77.0 |
| Transmission Efficiency (%) | 28.5 | 38.8 | 45.6 | 50.0 | |
| 1 | Mean Energy (keV) | 60.8 | 69.4 | 76.8 | 82.9 |
| Transmission Efficiency (%) | 12.2 | 20.4 | 26.7 | 31.2 | |
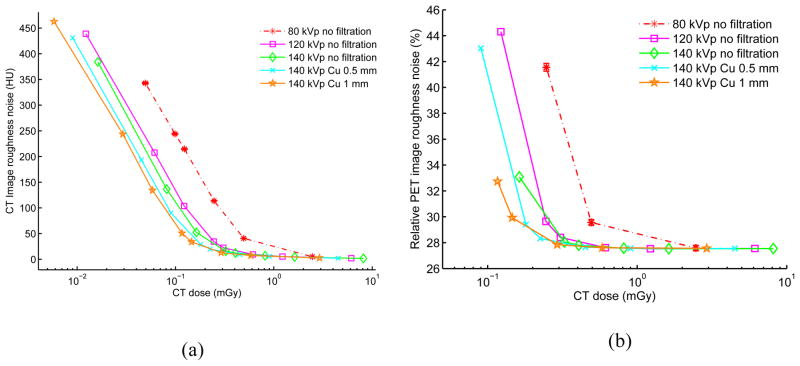
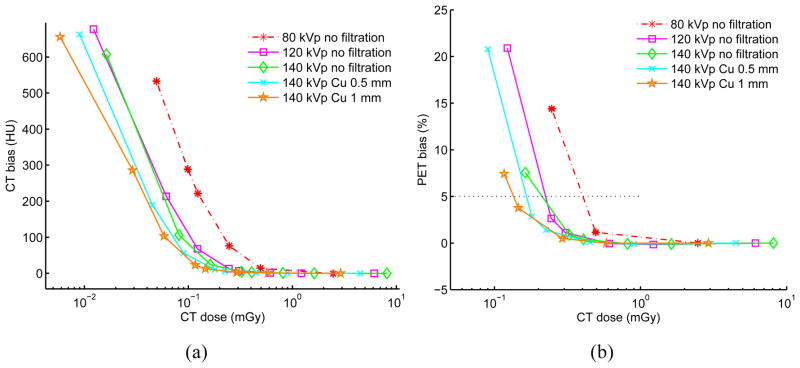
Figures 4–5 show the image roughness noise and bias in the reconstructed CT and corresponding PET images as a function of radiation dose for the elliptical water phantom at different combinations of kVp, mA and filtration settings. The standard error of the mean for those metrics across 20 i.i.d. simulations is shown as error bar for the 80 kVp no added filtration setting; errors bars are not presented on the other curves to reduce clutter and because the error is extremely low (as shown with 80 kVp). The image ensemble noise and RMSE plots for CT and PET (data not shown) display similar trends. For the PET data plots, the lower range is truncated if PET bias exceeds 5% when mA decreases from 500 mA to 10 mA in the selected settings. For comparison, Table 4 lists corresponding CT bias, CT image roughness noise, CT ensemble noise, PET image roughness noise, PET ensemble noise as well as mean absorbed doses at 5% PET bias for each of the selected filtration settings. The values in the table are calculated through linear interpolation of simulated results in the selected ranges.
Figure 4.
(a) CT image roughness noise vs. CT absorbed radiation dose. (b) PET image roughness noise vs. CT absorbed radiation dose. Results are based on 20 each repeated CT and PET i.i.d. simulations using various filtration and kVp, mAs parameters for a 20 × 30 cm elliptical water-filled phantom. The CT tube current is varied for each kVp from 500 mA down to 0.5 mA leading to different absorbed doses (0.5 s tube rotation time). The CT dose is measured as the mean absorbed dose across the central part of the phantom with slice thickness of 3.125 mm. As illustration, the standard error of the mean is shown as error bar for the 80 kVp no filtration case, but is too small to be observed. For CT, lower range is truncated if bias is over than 700 HU with visually obvious artifacts. For PET, lower range is truncated if corresponding bias is more than 20%.
Figure 5.
(a) CT image bias vs. CT absorbed radiation dose. (b) PET image bias vs. CT absorbed radiation dose. Results are based on 20 each repeated CT and PET i.i.d. simulations using various filtration and kVp, mAs parameters for a 20 × 30 cm elliptical water-filled phantom. The CT tube current is varied for each kVp from 500 mA down to 0.5 mA leading to different absorbed doses (0.5 s tube rotation time). The CT dose is measured as the mean absorbed dose across the central part of the phantom with slice thickness of 3.125 mm. The standard error of the mean is shown as error bar for the 80 kVp no filtration case and is very small. For CT, lower range is truncated if bias is over than 700 HU with visually obvious artifacts. PET mean bias of 5% is shown as the horizontal black line.
Table 4.
At 5% PET bias, corresponding CT bias, CT image roughness noise, PET image roughness, and mean absorbed dose.
| Method | CT dose (mGy) | bias in CT (HU) | Roughness noise in CT (HU) | Ensemble noise in CT (HU) | Roughness noise in PET (%) | Ensemble noise in PET (%) |
|---|---|---|---|---|---|---|
| 80 kVp, no filtration | 0.42 | 32.37 | 61.97 | 3.10 | 33.05 | 2.35 |
| 120 kVp, no filtration | 0.23 | 19.90 | 43.44 | 2.22 | 31.54 | 2.24 |
| 140 kVp, no filtration | 0.22 | 16.53 | 38.39 | 2.00 | 31.17 | 2.21 |
| 140 kVp, 0.5 mm Cu | 0.17 | 15.61 | 36.28 | 1.85 | 31.03 | 2.19 |
| 140 kVp, 1 mm Cu | 0.14 | 16.09 | 39.59 | 2.04 | 30.88 | 2.20 |
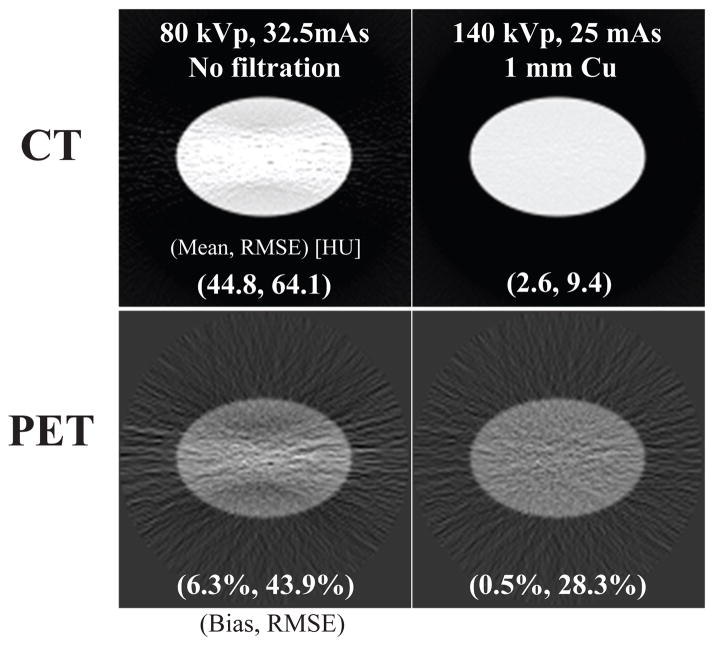
Anecdotal CT images generated with different spectra resulting in matched absorbed dose and the corresponding AC PET images are shown in Figure 6. As expected, the higher energy spectra (140 kVp, 1 mm Cu) results in a CT image with visually less streak artefacts and noise.
Figure 6.
(top) CT image mean and RMSE of the water cylinder phantom and (bottom) corresponding attenuation corrected PET mean and RMSE at the same CT radiation dose.
3.2. Impact of CT sinogram smoothing
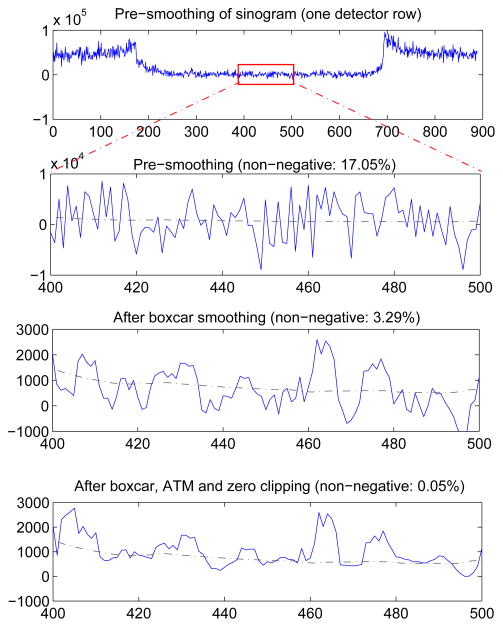
A representative example of the influence of simple boxcar smoothing and ATM filtering on the simulated CT sinogram data after dark current correction are shown in Figure 7. A 5 × 5 boxcar followed by ATM smoothing was applied on one projection view of a CT sinogram acquired at 1 mA, 120 kVp, 0.5 mm Cu filtration. The fraction of non-positive sinogram values decreased from 17.05% to 3.29% after boxcar smoothing, and was further reduced to 0.05% after ATM smoothing and sinogram clipping. This shows that sinogram smoothing may be effective at reducing or eliminating noise induced artifacts in CT.
Figure 7.
Detailed profile of sinogram after dark current subtraction in each processing step. The sinogram was generated with CT technique of 1 mA, 120 kVp, 0.5 mm Cu filtration. The sinogram was smoothed by a 5 × 5 boxcar, followed by ATM smoothing and zero clipping. Note the x- and y-axis scale changes. The dashed line is the reference noise-free CT sinogram profile for comparison.
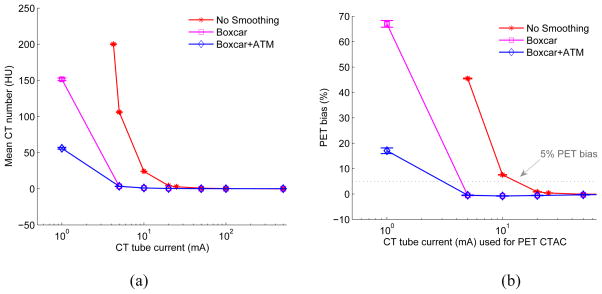
Figure 8 shows the comparison results of CT bias and corresponding PET bias as a function of CT tube current for the elliptical water cylinder phantom (simulated with 140 kVp, no copper filtration, electronic noise of 160 photons). Different levels of sinogram smoothing were used: no sinogram smoothing, 2D 3×3 boxcar smoothing and 2D 3×3 boxcar + ATM smoothing, respectively. It can be observed that for a matched PET bias of 5%, compared with no CT sinogram smoothing, 2D 3×3 boxcar smoothing allows reducing the tube current from ~ 13 mA to ~ 4 mA, while 2D boxcar smoothing + ATM allows a further reduction in tube current.
Figure 8.
(a) Comparison of CT bias (mean CT number in HU) as a function of CT tube current with and without sinogram smoothing for 20 i.i.d elliptical water cylinder phantom. (b) Corresponding comparison of PET bias (%) as a function of CT tube current for the 20 i.i.d elliptical water cylinder phantom with and without CT sinogram smoothing. The standard error of the mean is shown as error bar. The dotted line shows 5% PET bias. It can be seen that 2D 3×3 boxcar sinogram smoothing could reduce CT dose for matched PET bias, boxcar followed with ATM could further reduce CT dose. Note that lower range of no smoothing case is truncated if the corresponding PET bias is higher than 70%.
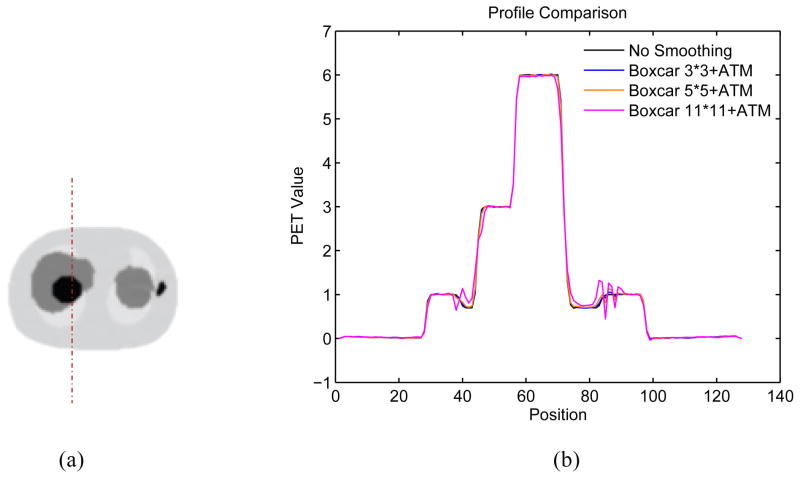
The impact of CT sinogram smoothing in noise-free NCAT PET images is shown in Figure 9 presenting the profiles through PET lung region with different CT sinogram smoothing levels. CT sinogram smoothing can cause resolution mismatch between CT and PET images, especially at boundaries.
Figure 9.
(a) Illustration of the location of the profile through the reconstructed noise-free PET NCAT phantom. (b) The profile through PET lung region as illustrated in the left for different CT sinogram smoothing kernels.
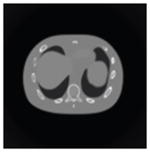
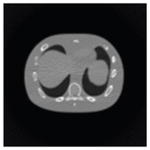
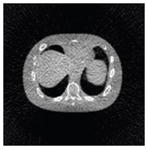
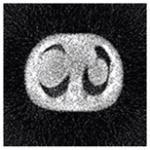
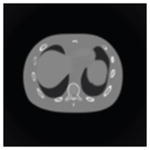
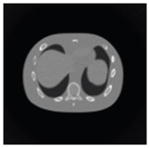
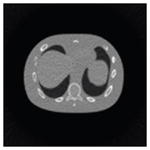
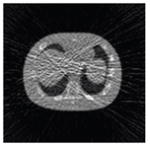
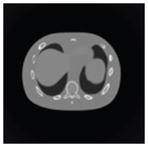
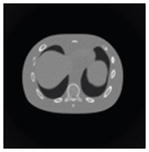
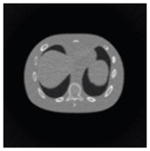
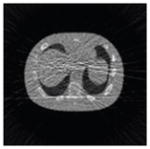
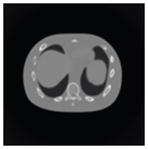
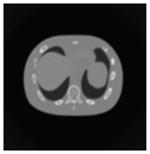
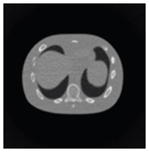
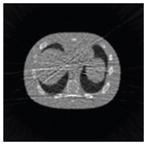
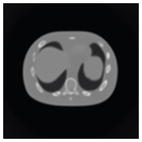
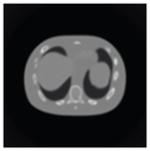
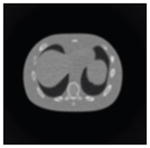
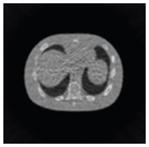
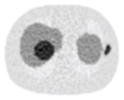
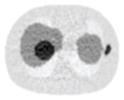
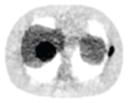
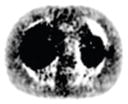
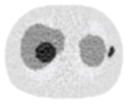
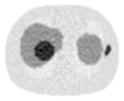
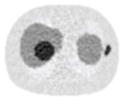
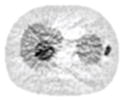
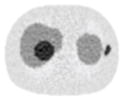
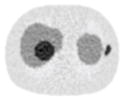
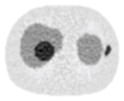
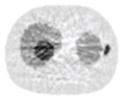
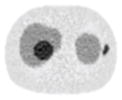
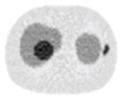
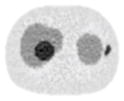
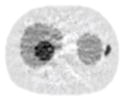
Tables 5 and 6 present the reconstructed CT and corresponding noisy PET images for the NCAT phantom. Each column of a table represents a different CT dose level (with (tube current) × (time) in units of mAs), and each row represents a different sinogram smoothing level (boxcar kernel size). The numerical value listed on the corner of each image in table 5 gives the RMSE of the reconstructed CT image. The number on the corner of each image in table 6 shows the normalized RMSE for PET (% of RMSE compared to the known true PET image). Results for other mA levels are not shown here but are consistent with the patterns shown in Tables 5 and 6. The difference images of CT and noisy PET are also compared (data not shown). Table 7 lists percentage change of bias, coefficient of variation of image roughness for different ROIs and normalized RMSE for the total object in the noisy PET images if the corresponding CT images are acquired at 120 kVp, 0.5 mm Cu filtration, 2.5 mAs, with various sinogram smoothing levels. This shows that compared to no sinogram smoothing, some level of smoothing is helpful for reducing PET bias and noise, while too much smoothing may be detrimental for PET quantitation.
Table 5.
The effects of different smoothing levels on the CT images of the NCAT phantom. The number in each table element is the root mean square error (RMSE) measured in HU. The underlined value represents the optimal smoothing level at each dose level (tube current time product in unit of mAs in the column). The CT images were simulated at 120 kVp, 0.5 mm Cu filtration.
| CT total tube current | CT noise-free | 10 mAs | 2.5 mAs | 0.5 mAs |
|---|---|---|---|---|
| Sinogram smoothing levels | ||||
| No CT sinogram smoothing |
 0.0 |
 32.3 |
 182.6 |
 431.3 |
| 3*3 Boxcar +ATM |
 5.6 |
 13.1 |
 34.0 |
 201.4 |
| 5*5 Boxcar +ATM |
 13.6 |
 15.8 |
 26.3 |
 119.9 |
| 7*7 Boxcar +ATM |
 23.0 |
 23.7 |
 28.4 |
 84.7 |
| 11*11 Boxcar +ATM |
 41.8 |
 41.9 |
 42.8 |
 58.5 |
Table 6.
Noisy PET reconstructed images and the Normalized RMSE (%) are shown for each category. The underlined value highlights the optimal smoothing level at each dose level (tube current time product in unit of mAs in the column). The CT images for PET attenuation correction were simulated at 120 kVp, 0.5 mm Cu filtration.
| CT total tube current | CT noise-free | 10 mAs | 2.5 mAs | 0.5 mAs |
|---|---|---|---|---|
| CT sinogram smoothing levels | ||||
| No CT sinogram smoothing |
 12.65% |
 14.29% |
 58.01% |
 380.65% |
| 3*3 Boxcar +ATM |
 12.67% |
 12.73% |
 13.55% |
 37.16% |
| 5*5 Boxcar +ATM |
 12.73% |
 12.84% |
 13.11% |
 32.04% |
| 7*7 Boxcar +ATM |
 12.91% |
 12.97% |
 13.50% |
 26.42% |
| 11*11 Boxcar +ATM |
 13.84% |
 13.88% |
 14.14% |
 21.13% |
Table 7.
Bias and noise results for increasing CT sinogram smoothing levels for the NCAT object simulated with a 2.5 mAs CT acquisition. Metrics presented are the percentage PET bias, the percentage image roughness in the brackets for each ROI shown in Figure 2, and the normalized RMSE for the total object. Each metric is normalized to the mean true value of the emission object.
| Metrics | ROI | No Smoothing | 2D 3*3 boxcar ATM | 2D 5*5 boxcar ATM | 2D 7*7 boxcar ATM | 2D 11*11 Boxcar ATM |
|---|---|---|---|---|---|---|
| PET bias (noise) | ROI #1 | 24.5 (12.3) | 0.5 (8.8) | −0.5 (8.0) | −0.1 (10.0) | −0.5 (9.0) |
| ROI #2 | 30.5 (6.7) | −0.1 (6.3) | 0.6 (6.5) | −1.3 (7.0) | −1.4 (8.5) | |
| ROI #3 | 41.8 (15.0) | 2.8 (10.8) | 2.0 (11.5) | 0.3 (11.3) | 0.9 (10.9) | |
| ROI #4 | 68.2 (22.3) | −0.1 (16.8) | 2.7 (15.3) | 0.2 (14.5) | 1.8 (16.1) | |
| ROI #5 | −99.6 (213.3) | −6.0 (19.4) | −0.9 (15.0) | 2.2 (16.2) | 11.4 (17.2) | |
| RMSE % (total object) | 58.0 | 13.6 | 13.1 | 13.5 | 14.1 | |
4. Discussion
The proposed radiation dose reduced acquisition methods are based on CT tube current reduction, tube voltage optimization and spectral shaping. Decreasing CT tube current decreases the number of X-ray photons generated from the tube, thus linearly decreasing the radiation dose for a given acquisition time. By optimizing the tube voltage and the hardness of the x-ray spectra, the photon penetration capacity can be optimized. Additional flat filters could remove low-energy photons and shape the spectrum to be more dose-efficient. Our results show that ultra-low dose CT for PET/CT may be possible by simply extending these standard acquisition methods.
The propagation of noise and bias from the CTAC image to the PET image is complex and depends on the PET image values and the reconstruction algorithm used (Hsiao and Gindi 2001, Qi and Huesman 2005). As a rough estimate, however, we have previously shown (Kinahan et al 2006) that PET image errors are roughly proportional to local CTAC errors. It can be observed from Figures 4 and 5 that both bias and noise in the CT image determine the quantitative accuracy in the PET image. As expected, for set kVp and filtration, through tube current reduction, there is a dose threshold below which the CT bias and noise increase significantly. These artifacts are due to photon starvation at low flux levels and the presence of electronic noise in the data acquisition systems (DAS). Modern high-end CT scanners have lower electronic DAS noise than simulated here. Our results clearly show the benefit of reductions in dark current noise for ultra-low dose PET/CT imaging.
Narrower and higher energy spectra are more dose-efficient when subtle contrast discrimination in the CT image is not necessary and over-all PET image bias and noise are important. It can be observed in Figure 5(b) that for the lowest energy spectra (80 kVp, no filtration), PET bias is below 5% when absorbed radiation dose is greater than 0.42 mGy. However, for the highest/narrowest energy spectra (140 kVp, 1 mm Cu), PET bias is still below 5% when dose is less than 0.14 mGy. Table 4 further illustrates this trend. In Table 4, compared to 80 kVp no filtration, optimizing tube voltage and filtration allows reduced CT radiation dose for the matched PET bias. It shows that for matched PET bias, highest/narrowest energy spectra (140 kVp, 1 mm Cu) has a dose reduction factor of 3 with decreased CT and PET noise compared to the lowest energy spectra (80 kVp, no filtration). It should also be noted that the transmission efficiency is only 31.2%, implying that the X-ray tube uses about 3× more energy for a given protocol. The transmission efficiency metric is intended as a check that filtration is not placing unrealistic requirements on x-ray tube power capabilities. Figure 6 shows that for matched CT radiation dose, with spectral shaping, the CT and corresponding PET images have less image noise and artifacts.
Reducing CT radiation dose by extending standard acquisition techniques leads to increased noise and/or artifacts in CT images, especially for ultra-low dose cases where bias and noise in CT images would inevitably appear. At the limit where acquired low dose CT SNR and/or artifacts are detrimental to PET image quality, sinogram smoothing can be employed, making low dose CT acquisitions acceptable for PET attenuation correction. In the presence of electronic noise in the CT DAS, the collected signal after removing the mean dark current of the DAS often drops below zero (Colsher et al 2008, Kachelriess et al 2001, Hsieh 2009). The root cause of the CT number inaccuracy is the treatment of non-positive signals before logarithmic operation. As an example, Figure 7 shows the effect of smoothing on the sinogram data in each step. The noise-free profile is also shown in Figure 7 as dashed line for comparison. For the simulated NCAT object at set acquisition conditions, it is observed in Figure 7 that 2D boxcar smoothing could supress noise and preserve the mean without introducing bias, followed by ATM to reduce non-positive values. Filtering before logarithmic conversion with the low-pass 2D boxcar will degrade CT resolution. However, for PET attenuation correction, CT image has to be smoothed with post-processing techniques to match the PET resolution. Our study in Figure 8 shows that for a uniform phantom scanned at 140 kVp, and with a threshold of 5% PET bias, the 2D 3×3 boxcar smoothing allows reducing CT dose by a factor of approximately 3 to 4, and 2D 3×3 boxcar smoothing followed with ATM allows a further reduction of CT dose.
The NCAT phantom was simulated to test the effects on lesion contrast. From Tables 5 and 6, we observe that with reduced mAs (thus reduced radiation dose), both CT and corresponding PET images suffer from increased noise and artifacts if no CT sinogram smoothing is applied. However, with smoothing, we obtain PET images with matched RMSE with reduced radiation dose. For example, by applying 5×5 boxcar followed with ATM, we have PET images of same level of RMSE after reducing CT tube current-time product from 10 mAs to 2.5 mAs (a factor of 4). Table 5 and Table 6 also suggest the optimal smoothing level (value with underline) for each dose level (each column). In general, more smoothing is needed when noise level is increased. Table 7 also gives the percentage of bias, coefficient of variant of image roughness in each ROI and the normalized RMSE for the total object, which indicates that there may be an optimal level of smoothing in reducing PET bias. It is worth noting that these results will vary with the specific PET reconstruction algorithms, reconstruction parameters, post-filtering levels as well as ROI size. However, the results here indicate the general trend. We also evaluated the PET images reconstructed with FBP, which gave similar results to OSEM PET reconstructions (data not shown). Figure 9 suggests that too much CT sinogram smoothing may introduce artifacts at PET images where the object has structural boundaries due to resolution mismatch between CT and PET images.
Though more sophisticated CT sinogram smoothing algorithms could be used, the purpose of this study is to investigate the feasibility of ultra-low dose PET/CT imaging by extending standard methods. Our initial results with simple boxcar smoothing followed with ATM (Colsher et al 2008) are successful and suggest that further improvements may be possible with more sophisticated smoothing algorithms.
We use four different CT and PET image metrics: image bias, image roughness noise and ensemble noise, and RMSE for image evaluation. Image bias is not empirically used for diagnostic CT imaging, but is a reasonable metric used here for CT-based attenuation correction. Image roughness noise measures the pixel to pixel variability in the image, and is the noise perceived when viewing an individual image. Ensemble noise is a measure for noise across independent realizations, and is inversely proportional to detection task performance (Tong et al 2010). Evaluation results based on these metrics in our study show that PET noise is not substantially increased by ultra-low dose CT scans with the constraint that bias in the PET image is within an acceptable range. Both bias and noise in the CT images determine the quantitative accuracy in the PET images. We use the absorbed CT dose in our study as dose metric. The most appropriate quantity for assessing the risk due to diagnostic imaging procedure is the radiation dose to individual organs (Turner et al 2011). In our study, however, the absorbed dose is used to estimate the relative dose reduction factor compared to those in clinical PET/CT procedures.
One critical constraint for this ultra-low dose CTAC study is that proposed methods should be feasibly implemented on the diagnostic CT subsystem of a PET/CT scanner. For the purpose of PET attenuation correction at 511 keV, CT images can contain relatively high noise, low spatial resolution, and low contrast. This work explored some of the simplest strategies for dose reduction to take advantage of the reduced requirements of CTAC for PET. There are other simple methods besides those studied here, for example: collimation, X-ray tube pulsing, short scan with gating or fixed shielding (Xia et al 2009, Xia et al 2010). For noise reduction, we may use combined detector elements, iterative CT reconstruction (De Man et al 2001), compressed sensing (Chen et al 2008), or temporal averaging. We reconstructed CT images on a matrix size that matches PET image size directly in our study. This also reduces CT computation time and may allow for computationally intense CT processing techniques, such as gated and/or iterative CT image reconstruction. To the best of our knowledge, little work has been done to capitalize on the lower image quality requirements of CTAC to combine methods for PET attenuation correction and radiation-dose-reduced CT imaging.
One challenge in our study is that system parameters and implemented algorithms may vary among different scanners from different manufactures. The presented results here are based on simulations, using combinations of wide range of parameters to predict the general scanner behaviours for ultra-low dose situations. One limitation of our study is that we used a fixed small scatter-to-primary ratio for all our simulations. We believe, however, that this is a reasonable approximation as it is known that for example, the scatter-to-primary ratio for LightSpeedTM 16 scanner is less than 4% (Hsieh 2009). Though scatter causes CT bias, this is a small contribution compared to photon starvation effects in the ultra-low dose case. In addition, some of the simulated parameter values (e.g. tube current less than 10 mA) are below the lower limit currently available on commercial scanners. Furthermore, it may be challenging to equip some CT scanners with special filtration for low dose CT. In general, however, the proposed methods are feasible to implement in practice, and could be translated into protocols for the assessment of individual response to therapy and to strengthen clinical trials of more effective cancer therapies, as well as PET/CT guided radiation treatment planning and PET/CT cardiac imaging.
5. Conclusion
We have presented a systematic simulation study investigating the possibility of using ultra-low dose CT for PET/CT attenuation correction. Our simulations are based on PET data that has been attenuation corrected with dose-reduced CT techniques with an elliptical water cylinder phantom containing clinical PET activity and the NCAT phantom with focal FDG uptake in soft tissue and bone. The simulation results demonstrate that ultra-low dose CT for PET/CT is feasible, and there is significant room to reduce CT radiation dose in the cases where CT is not used for diagnostic or anatomical localization purposes. We have shown that appropriately choosing tube potential, current and filtration allow lower CT doses at matched PET image quality. Spectra that are higher energy and narrower are generally more dose efficient with respect to PET image quality. Sinogram smoothing can be used to compensate for the increased noise and artifacts in reduced dose CT acquisitions. The methods presented here are clinically and technically feasible, and could be used for longer duration CT scans for respiratory-gated CT that is phase matched with PET for attenuation correction and motion estimation, and to reduce patient radiation dose in general.
Acknowledgments
We thank Drs. Patrick La Riviere, Jiang Hsieh, James Colsher, Bruce Whiting and Larry Pierce for helpful discussions. This study was supported by NIH grant R01-CA115870.
Footnotes
Classification numbers: 87.57.uk, 87.57.C-, 87.57.N-, 87.57.Q-, 87.57.-s.
References
- Beyer T, Townsend DW, Brun T, Kinahan PE, Charron M, Roddy R, Jerin J, Young J, Byars L, Nutt R. A combined PET/CT scanner for clinical oncology. Journal of Nuclear Medicine. 2000;41:1369–79. [PubMed] [Google Scholar]
- Boellaard R, et al. FDG PET and PET/CT: EANM procedure guidelines for tumour PET imaging: version 1.0. Eur J Nucl Med Mol Imaging. 2010;37:181–200. doi: 10.1007/s00259-009-1297-4. [DOI] [PMC free article] [PubMed] [Google Scholar]
- Brix G, Lechel U, Glatting G, Ziegler SI, Munzing W, Muller SP, Beyer T. Radiation exposure of patients undergoing whole-body dual-modality 18F-FDG PET/CT examinations. J Nucl Med. 2005;46:608–13. [PubMed] [Google Scholar]
- Burger C, Goerres G, Schoenes S, Buck A, Lonn AH, Von Schulthess GK. PET attenuation coefficients from CT images: experimental evaluation of the transformation of CT into PET 511-keV attenuation coefficients. Eur J Nucl Med Mol Imaging. 2002;29:922–7. doi: 10.1007/s00259-002-0796-3. [DOI] [PubMed] [Google Scholar]
- Chen GH, Tang J, Leng S. Prior image constrained compressed sensing (PICCS): a method to accurately reconstruct dynamic CT images from highly undersampled projection data sets. Med Phys. 2008;35:660–3. doi: 10.1118/1.2836423. [DOI] [PMC free article] [PubMed] [Google Scholar]
- Chi PC, Mawlawi O, Nehmeh SA, Erdi YE, Balter PA, Luo D, Mohan R, Pan T. Design of respiration averaged CT for attenuation correction of the PET data from PET/CT. Med Phys. 2007;34:2039–47. doi: 10.1118/1.2733810. [DOI] [PubMed] [Google Scholar]
- Colsher JG, Jiang H, Thibault J-B, Lonn A, Pan T, Lokitz SJ, Turkington TG. Ultra low dose CT for attenuation correction in PET/CT. Nuclear Science Symposium Conference Record; 2008; IEEE. 2008. pp. 5506–11. NSS ‘08. [Google Scholar]
- Comtat C, Kinahan PE, Defrise M, Michel C, Lartizien C, Townsend DW. Simulating whole-body PET scanning with rapid analytical methods. Nuclear Science Symposium, 1999. Conference Record; 1999; IEEE. 1999. pp. 1260–4. [Google Scholar]
- Dawood M, Lang N, Jiang X, Schafers KP. Lung motion correction on respiratory gated 3-D PET/CT images. IEEE Trans Med Imaging. 2006;25:476–85. doi: 10.1109/TMI.2006.870892. [DOI] [PubMed] [Google Scholar]
- De Man B, Basu S, Chandra N, Dunham B, Edic P, Iatrou M, Mcolash S, Sainath P, Shaughnessy C, Tower B, Williams E. CATSIM: a new Computer Assisted Tomography SIMulation environment. In: Hsieh J, Flynn J, editors. Medical Imaging 2007: Physics of Medical Imaging. 2007. p. 65102G. Proc. of SPIE. [Google Scholar]
- De Man B, Nuyts J, Dupont P, Marchal G, Suetens P. An iterative maximum-likelihood polychromatic algorithm for CT. IEEE Trans Med Imaging. 2001;20:999–1008. doi: 10.1109/42.959297. [DOI] [PubMed] [Google Scholar]
- Herrmann K, Krause BJ, Bundschuh RA, Dechow T, Schwaiger M. Monitoring response to therapeutic interventions in patients with cancer. Semin Nucl Med. 2009;39:210–32. doi: 10.1053/j.semnuclmed.2008.12.001. [DOI] [PubMed] [Google Scholar]
- Hsiao IT, Gindi G. Noise propagation from attenuation correction into PET reconstructions. Ieee T Nucl Sci. 2002;49:90–7. [Google Scholar]
- Hsieh J. Adaptive streak artifact reduction in computed tomography resulting from excessive x-ray photon noise. Med Phys. 1998;25:2139–47. doi: 10.1118/1.598410. [DOI] [PubMed] [Google Scholar]
- Hsieh J. Computed tomography: principles, design, artifacts, and recent advances. Bellingham, Wash. Hoboken, N.J: SPIE; J. Wiley & Sons; 2009. [Google Scholar]
- ICRP. Radiation dose to patients from radiopharmaceuticals. Addendum 3 to ICRP Publication 53. ICRP Publication 106. Approved by the Commission in October 2007. Ann ICRP. 2008;38:1–197. doi: 10.1016/j.icrp.2008.08.003. [DOI] [PubMed] [Google Scholar]
- ICRP. The 2007 Recommendations of the International Commission on Radiological Protection. ICRP publication 103. Ann ICRP. 2007;37:1–332. doi: 10.1016/j.icrp.2007.10.003. [DOI] [PubMed] [Google Scholar]
- Kachelriess M, Watzke O, Kalender WA. Generalized multi-dimensional adaptive filtering for conventional and spiral single-slice, m ulti-slice, and cone–beam CT. Med Phys. 2001;28:475–90. doi: 10.1118/1.1358303. [DOI] [PubMed] [Google Scholar]
- Kawano T, Ohtake E, Inoue T. Deep-inspiration breath-hold PET/CT of lung cancer: maximum standardized uptake value analysis of 108 patients. J Nucl Med. 2008;49:1223–31. doi: 10.2967/jnumed.107.049296. [DOI] [PubMed] [Google Scholar]
- Kinahan PE, Alessio AM, Fessler JA. Dual energy CT attenuation correction methods for quantitative assessment of response to cancer therapy with PET/CT imaging. Technol Cancer Res Treat. 2006;5:319–27. doi: 10.1177/153303460600500403. [DOI] [PubMed] [Google Scholar]
- Kinahan PE, Hasegawa BH, Beyer T. X-ray-based attenuation correction for positron emission tomography/computed tomography scanners. Semin Nucl Med. 2003;33:166–79. doi: 10.1053/snuc.2003.127307. [DOI] [PubMed] [Google Scholar]
- Kinahan PE, MacDonald L, Ng L, Alessio A, Segars P, Tsui BMW, Pathak SD. Compensating for patient respiration in PET/CT imaging with the registered and summed phases (PASP) procedure. 3rd IEEE International Symposium on Biomedical Imaging: Nano to Macro; 2006. pp. 1104–7. [Google Scholar]
- Kinahan PE, Townsend DW, Beyer T, Sashin D. Attenuation correction for a combined 3D PET/CT scanner. Med Phys. 1998;25:2046–53. doi: 10.1118/1.598392. [DOI] [PubMed] [Google Scholar]
- La Riviere PJ. Penalized-likelihood sinogram smoothing for low-dose CT. Med Phys. 2005;32:1676–83. doi: 10.1118/1.1915015. [DOI] [PubMed] [Google Scholar]
- La Riviere PJ, Bian J, Vargas PA. Penalized-likelihood sinogram restoration for computed tomography. IEEE Trans Med Imaging. 2006;25:1022–36. doi: 10.1109/tmi.2006.875429. [DOI] [PubMed] [Google Scholar]
- Li T, Thorndyke B, Schreibmann E, Yang Y, Xing L. Model-based image reconstruction for four-dimensional PET. Med Phys. 2006;33:1288–98. doi: 10.1118/1.2192581. [DOI] [PubMed] [Google Scholar]
- Liu C, Pierce LA, 2nd, Alessio AM, Kinahan PE. The impact of respiratory motion on tumor quantification and delineation in static PET/CT imaging. Phys Med Biol. 2009;54:7345–62. doi: 10.1088/0031-9155/54/24/007. [DOI] [PMC free article] [PubMed] [Google Scholar]
- NCRP. NCRP Report No 160: Ionizing Radiation Exposure of the Population of the United States. 2009. p. 465. [DOI] [PubMed] [Google Scholar]
- Nehmeh SA, Erdi YE, Meirelles GS, Squire O, Larson SM, Humm JL, Schoder H. Deep-inspiration breath-hold PET/CT of the thorax. J Nucl Med. 2007;48:22–6. [PubMed] [Google Scholar]
- Nehmeh SA, Erdi YE, Pan T, Pevsner A, Rosenzweig KE, Yorke E, Mageras GS, Schoder H, Vernon P, Squire O, Mostafavi H, Larson SM, Humm JL. Four-dimensional (4D) PET/CT imaging of the thorax. Med Phys. 2004a;31:3179–86. doi: 10.1118/1.1809778. [DOI] [PubMed] [Google Scholar]
- Nehmeh SA, Erdi YE, Pan T, Yorke E, Mageras GS, Rosenzweig KE, Schoder H, Mostafavi H, Squire O, Pevsner A, Larson SM, Humm JL. Quantitation of respiratory motion during 4D-PET/CT acquisition. Med Phys. 2004b;31:1333–8. doi: 10.1118/1.1739671. [DOI] [PubMed] [Google Scholar]
- Pan T, Lee TY, Rietzel E, Chen GT. 4D-CT imaging of a volume influenced by respiratory motion on multi-slice CT. Med Phys. 2004;31:333–40. doi: 10.1118/1.1639993. [DOI] [PubMed] [Google Scholar]
- Pan T, Mawlawi O, Luo D, Liu HH, Chi PC, Mar MV, Gladish G, Truong M, Erasmus J, Jr, Liao Z, Macapinlac HA. Attenuation correction of PET cardiac data with low-dose average CT in PET/CT. Med Phys. 2006;33:3931–8. doi: 10.1118/1.2349843. [DOI] [PubMed] [Google Scholar]
- Pan T, Sun X, Luo D. Improvement of the cine-CT based 4D-CT imaging. Med Phys. 2007;34:4499–503. doi: 10.1118/1.2794225. [DOI] [PubMed] [Google Scholar]
- Park SJ, Ionascu D, Killoran J, Mamede M, Gerbaudo VH, Chin L, Berbeco R. Evaluation of the combined effects of target size, respiratory motion and background activity on 3D and 4D PET/CT images. Phys Med Biol. 2008;53:3661–79. doi: 10.1088/0031-9155/53/13/018. [DOI] [PubMed] [Google Scholar]
- Pevsner A, Nehmeh SA, Humm JL, Mageras GS, Erdi YE. Effect of motion on tracer activity determination in CT attenuation corrected PET images: a lung phantom study. Med Phys. 2005;32:2358–62. doi: 10.1118/1.1943809. [DOI] [PubMed] [Google Scholar]
- Qi J, Huesman RH. Effect of errors in the system matrix on maximum a posteriori image reconstruction. Phys Med Biol. 2005;50:3297–312. doi: 10.1088/0031-9155/50/14/007. [DOI] [PMC free article] [PubMed] [Google Scholar]
- Qiao F, Pan T, Clark JW, Jr, Mawlawi O. Joint model of motion and anatomy for PET image reconstruction. Med Phys. 2007;34:4626–39. doi: 10.1118/1.2804721. [DOI] [PubMed] [Google Scholar]
- Qiao F, Pan T, Clark JW, Jr, Mawlawi OR. A motion-incorporated reconstruction method for gated PET studies. Phys Med Biol. 2006;51:3769–83. doi: 10.1088/0031-9155/51/15/012. [DOI] [PubMed] [Google Scholar]
- Segars WP. PhD thesis. The University of North Carolina; 2001. Development of a new dynamic NURBS-based cardiac torso (NCAT) phantom. [Google Scholar]
- Segars WP, Mahesh M, Beck TJ, Frey EC, Tsui BMW. Realistic CT simulation using the 4D XCAT phantom. Med Phys. 2008;35:3800–8. doi: 10.1118/1.2955743. [DOI] [PMC free article] [PubMed] [Google Scholar]
- Thielemans K, Manjeshwar RM, Xiaodong T, Asma E. Lesion detectability in motion compensated image reconstruction of respiratory gated PET/CT. Nuclear Science Symposium Conference Record; 2006; IEEE. 2006. pp. 3278–82. [Google Scholar]
- Tong S, Alessio AM, Kinahan PE. Noise and signal properties in PSF-based fully 3D PET image reconstruction: an experimental evaluation. Phys Med Biol. 2010;55:1453–73. doi: 10.1088/0031-9155/55/5/013. [DOI] [PMC free article] [PubMed] [Google Scholar]
- Turner AC, Zhang D, Khatonabadi M, Zankl M, DeMarco JJ, Cagnon CH, Cody DD, Stevens DM, McCollough CH, McNitt-Gray MF. The feasibility of patient size-corrected, scanner-independent organ dose estimates for abdominal CT exams. Med Phys. 2011;38:820–9. doi: 10.1118/1.3533897. [DOI] [PMC free article] [PubMed] [Google Scholar]
- Wahl RL, Jacene H, Kasamon Y, Lodge MA. From RECIST to PERCIST: Evolving Considerations for PET response criteria in solid tumors. J Nucl Med. 2009;50(Suppl 1):122S–50S. doi: 10.2967/jnumed.108.057307. [DOI] [PMC free article] [PubMed] [Google Scholar]
- Wahl RL, Quint LE, Cieslak RD, Aisen AM, Koeppe RA, Meyer CR. “Anatometabolic” tumor imaging: fusion of FDG PET with CT or MRI to localize foci of increased activity. J Nucl Med. 1993;34:1190–7. [PubMed] [Google Scholar]
- Weber WA. Use of PET for monitoring cancer therapy and for predicting outcome. Journal of Nuclear Medicine. 2005;46:983–95. [PubMed] [Google Scholar]
- Weber WA. Positron emission tomography as an imaging biomarker. J Clin Oncol. 2006;24:3282–92. doi: 10.1200/JCO.2006.06.6068. [DOI] [PubMed] [Google Scholar]
- Weber WA. Assessing tumor response to therapy. J Nucl Med. 2009;50(Suppl 1):1S–10S. doi: 10.2967/jnumed.108.057174. [DOI] [PubMed] [Google Scholar]
- Whiting BR, Massoumzadeh P, Earl OA, O’Sullivan JA, Snyder DL, Williamson JF. Properties of preprocessed sinogram data in x-ray computed tomography. Med Phys. 2006;33:3290–303. doi: 10.1118/1.2230762. [DOI] [PubMed] [Google Scholar]
- Xia T, Alessio A, Kinahan PE. Limits of ultra-low dose CT attenuation correction for PET/CT. Proceedings of IEEE medical imaging conference (IEEE NSS/MIC); Orlando, Florida: IEEE; 2009. pp. 3074–9. NSS/MIC’09. [DOI] [PMC free article] [PubMed] [Google Scholar]
- Xia T, Alessio A, Kinahan PE. Spectral shaping for ultra-low dose CT attenuation correction in PET/CT. The First International Meeting on Image Formation in X-Ray Computed Tomography; Salt Lake City, Utah. 2010. [Google Scholar]


