

Abstract
Purpose:
We compared Humphrey Matrix FDT 30-2 (FDT) and Humphrey Visual Field Analyzer 30-2 SITA standard (SAP) in the assessment of anterior (optic nerve or chiasm) and posterior (retro-chiasmal) afferent visual pathway defects.
Materials and Methods:
In this retrospective comparative study, the charts of 37 patients (16 males, range 13-84 years, mean 72.1), with neuro-ophthalmic visual field defects who were tested with both FDT and SAP, were reviewed. Two masked graders assessed the concordance and extent of field defects between the perimeters. The mean concordance between anterior and posterior disease was compared using the Wilcoxon rank sum test. The mean deviation (MD) and pattern standard deviation (PSD) of each perimeter were correlated with the Spearman coefficient.
Results:
Twenty-eight patients had anterior and nine had posterior disease. Most had a fair or good concordance (89.3% anterior, 88.9% posterior). When comparing anterior to posterior disease, the mean concordance of the defects of the two parameters was not statistically different (P = 0.94 and P = 0.61 for total deviation and pattern deviation, respectively). The MD and PSD between perimeters had a significant correlation.
Conclusions:
Our series, using 30-2 field analysis, demonstrates fair to good correlation between FDT and SAP in the majority of patients. In roughly 10% findings between FDT and SAP were discordant. This difference was similar for anterior and posterior disease.
Keywords: Frequency Doubling Perimetry, Humphrey, Neuro-ophthalmology, Visual Field
INTRODUCTION
Frequency doubling technology (FDT) perimetry is based on an optical perception, where a low spatial frequency sinusoidal grating flickers at a high temporal frequency giving an apparent doubling of the spatial frequency.1 FDT was developed based on the belief that the magnocellular (M) cells in the retina are preferentially stimulated. With few M cell fibers distributed throughout the retina, it was argued that FDT perimetry would be more sensitive in detecting early glaucomatous field loss.2,3 However, more recent evidence has suggested that the FDT effect is mediated by many neural cell type.4
Several investigators have assessed the utility of FDT perimetry in the evaluation of neuro-ophthalmic disease. Earlier reports used an older version of FDT. Using this first-generation machine, which tested 17 large spots, similar sensitivity was found in detecting nonglaucomatous optic neuropathies with FDT compared to standard automated perimetry (SAP).5 In contrast, when applied to posterior visual pathway defects, FDT correlated poorly with SAP.6
In 2005, the Humphrey Matrix FDT was introduced, which assesses 55 smaller test spots in the 24-2 pattern.7 A large group of collaborators published two studies using this second-generation FDT perimeter to assess neuro-ophthalmic disease. The first compared second-generation Matrix FDT to SAP in patients with optic nerve and chiasmal disorders.8 The second similarly assessed patients with posterior visual pathway abnormalities.9 Good correlation between the perimeters was reported in both anterior and posterior visual pathway disease. However, the correlation between FDT and SAP was not directly compared in these, or in any other study, for anterior and posterior visual pathway disease. Based on these studies a difference cannot entirely be excluded.
This study was designed to further evaluate the use of FDT perimetry in the assessment of patients with neuro-ophthalmic disease. We compared Humphrey Matrix FDT to SAP for the detection of anterior and posterior pathway visual field defects. Specifically, the correlation was directly compared between anterior and posterior defects.
MATERIALS AND METHODS
After Institutional Review Board review and approval, using the computer database, all patients (n=37, 16 men and 21 women, age 13 to 84, mean 72.1 years) seen within the neuro-ophthalmology service, from July 2006 to November 2008, who had undergone testing with both HVF and FDT were identified. All patients had complete neuro-ophthalmic examination by a single neuro-ophthalmologist with appropriate neuro-imaging (by computed tomography or magnetic resonance imaging). All nongluacomatous optic neuropathies, chiasmal and postchiasmal abnormalities were included. Diagnosis was based on the treating physicians judgment and not further confirmed. Included patients were tested with both Humphrey Matrix FDT 30-2 and Humphrey Visual Field Analyzer (30-2 SITA standard), either the same day or within 2 months (if the condition was deemed stable).
Children under the age of 18 and patients with concurrent disease that would be expected to result in a visual field abnormality were excluded. Included patients had visual fields that met minimum reliability criteria. For the SAP, there was a false positive limit of 15% and a fixation loss limit of 33%. For FDT, the false positive and fixation loss limits were 33%. Due to the potential of excessive false negatives in patients with visual field loss, there was no false negative limit for inclusion. These parameters were chosen to mirror previous studies assessing FDT in neuro-ophthalmic patients.8,9
Each patient only had a single eye included in the study. Only the involved eye of unilateral neuro-ophthalmic disorders was included. In cases with bilateral disease, the better and worse eyes were used alternately.
Comparisons between SAP and FDT perimeters were made as follows. Concordance was estimated for the visual field defect morphology/pattern between the two perimeters. Scores were assigned independently by two trained readers for the total deviation (TD) and pattern deviation probability plots (PD). Correlation was considered “poor” when the areas of visual loss failed to overlap. A “fair” grade was given when the field defects were different, but had some areas of overlap. A “good” grade was given when the region and morphology of the defect corresponded near exactly. Figure 1 provides examples of each level of concordance for anterior and posterior pathway disease. A numerical score for poor concordance (1), fair concordance (2), or good concordance (3) was assigned for each plot. This scoring system is similar to previously published studies.8,9 Concordance scores for the TD and PD were averaged to calculate a “mean concordance” between the perimeters. Results were tabulated for anterior pathway disease and posterior pathway disease. The mean concordance was then compared using the Wilcoxon rank sum test.
Figure 1.
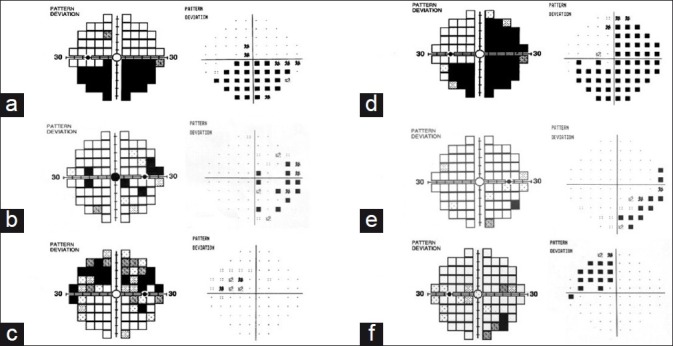
Examples of concordance. Anterior visual pathway: (a) demonstrates good concordance with FDT pattern deviation plot on the left, and SAP pattern deviation on the right. (b) and (c) demonstrate fair and poor concordance. Posterior visual pathway: good (d), fair (e), and poor (f) concordance
The extent of the measured visual field defects was also compared. The number of test spots with sensitivity decreased to the level of P<0.5% (abnormal) was tallied for each field. For a given eye, if the differences (SAP and FDT) in the number of “abnormal” test spots were fewer than 5, they were considered equivalent. Results were tabulated and compared for anterior and posterior pathway disease. This was also chosen to mirror previous studies.8,9
Correlation of both the mean deviation (MD) and pattern standard deviation (PSD) of each perimeter was compared. A Spearman coefficient (Rho) was calculated to compare the MD and PSD for anterior and posterior pathway disease.
RESULTS
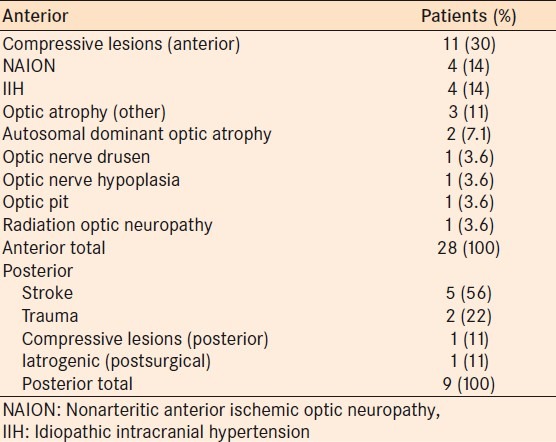
No significant difference was seen in anterior or posterior afferent visual pathway neuro-ophthalmic disease. Twenty-eight patients had anterior visual pathway disease and nine had posterior pathway disease. Table 1 provides the diagnoses of all subjects.
Table 1.
Etiologies of visual field loss
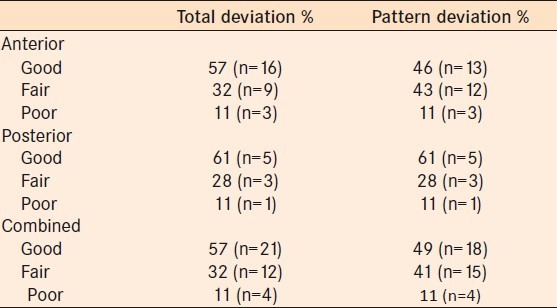
The concordance between the two perimeters is summarized in Table 2. In both anterior and posterior pathway disease, the majority of patients had a good or fair concordance in both the TD and PD plots. Three of 28 (10.7%, CI 0.023-0.28) of fields with anterior disease and 1 of 9 (11.1%, CI 0.002-0.48) with posterior disease were deemed to have poor concordance.
Table 2.
Concordance between total deviation and pattern deviation plots for anterior and posterior disease
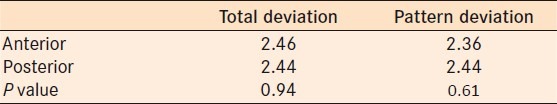
The “mean concordance” based on the numerical score assigned to each is shown in Table 3. There is no statistically significant difference between anterior and posterior pathway concordance scores (Wilcoxon rank sum test) using the TD plot (P = 0.94) or the PD plot (P = 0.61).
Table 3.
Mean concordance scores for total deviation and pattern plots
There was a statistically significant correlation between the two perimeters in the MD for anterior and posterior disease and PSD for anterior disease [Figure 2]. Posterior PSD approached but was not statistically significant (P = 0.07).
Figure 2.
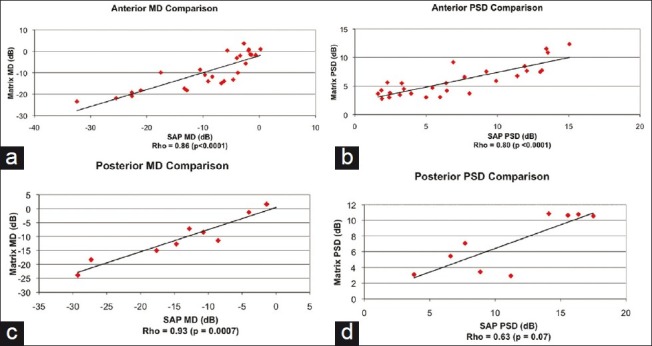
Correlation of mean deviation (MD) and pattern standard deviation (PSD) for each perimeter in anterior and posterior disease. Spearman coefficient (Rho) and P values were calculated for each. Matrix: Humphrey Matrix perimeter, SAP: standard automated perimeter
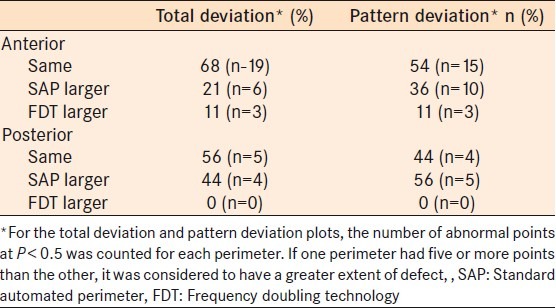
Table 4 summarizes the extents of visual field defect for both perimeters. On the total deviation plots, 67.9 and 55.6% of the defects were of similar size for anterior and posterior defects respectively. For pattern deviation plots the percentage of defects measured similarly were 53.6 and 44.4% for anterior and posterior defects, respectively. Interestingly, of those in which some discordance was present, SAP tended to estimate the extent of the defect to be larger more often than the reverse. This was true for both anterior and posterior disease.
Table 4.
Extent of visual field loss
DISCUSSION
Overall, we found good concordance between standard Humphrey perimetry (SAP) and frequency doubling technology (FDT) in assessing patients with a variety neuro-ophthalmic diseases. These data support the findings of Huang et al. and Taravati et al.8,9 Moreover, we directly compared the correlation between SAP and FDT for anterior and posterior neuro-ophthalmic disease. No significant difference was seen. Our data do not substantiate and argue against the initial concerns that FDT was not accurate in assessing “posterior” or homonymous defects. The discrepancy between initial reports and our data likely relates to the smaller test spot size used with modern FDT perimetry.
In its first generation, the frequency doubling technology perimeter was found to be effective in detecting visual field loss for several nonglaucomatous anterior pathway pathologies. For example, Wall et al. compared the C-20 FDT to SAP and found similar ability to detect defects from nonarteritic anterior ischemic optic neuropathy, idiopathic intracranial hypertension, compressive optic neuropathy, and optic neuritis.5 The sensitivity and specificity of the FDT (79.2 and 61.9%) and SAP (84.7 and 76.2%) were not statistically different. Other researchers have specifically assessed patients with pituitary tumors and nonarteritic ischemic optic neuropathy. In these studies, FDT was found to be a reasonably sensitive method of detecting field loss compared to SAP.10,11
However, the first-generation FDT failed to accurately delineate homonymous hemianopic field defects.5 One of the initial hypotheses used to explain these results was that FDT tested a different aspect of visual function, and therefore produced findings discordant from SAP. Our results and those of Huang and colleagues argue against this. If this were the case, discordant findings would be expected with the newer FDT perimetry as well. The more likely explanation simply relates to the size and position of the “test spots.” The older C-20 FDT tested 17 locations within the central 40° of the visual field. Each quadrant was represented by four test locations (each 10° in size) and one central stimulus (5° in size). Likely because these large stimuli were not offset from the vertical midline, light scatter from testing locations in the hemianopic hemifield resulted in detection in the uninvolved hemifield.5,6
The second generation of FDT, the Humphrey Matrix, has important changes compared to the C-20. The 30-2 pattern has 17 testing locations in each quadrant, with one central fixation target, for a total of 69 testing stimuli. Each stimulus size is 5° square with a 2° offset from the vertical midline. The central stimulus is 1° in size. Other changes in the Humphrey Matrix include a lower flicker rate (18 vs. 25 Hz) with higher spatial frequency (0.5 vs. 0.25 cycles/°), and utilization of the Zippy estimation by sequential testing (ZEST) strategy instead of the modified binary search strategy used in the first generation.12,13 Although it seems unlikely, these advances might also in part explain the improvement in assessing postchiasmal visual field loss.
Previous studies reported that the sensitivity of detecting a homonymous defect increased from 48% with the first-generation machine to 68.8% with the Humphrey Matrix.5,9 Our findings are similar. For posterior disease, the concordance between FDT and SAP was good or fair in 88.9% for the TD plots and 88.9% for the PD plots. This is similar to the study by Taravati et al.9 The difference in concordance values for anterior and posterior disease did not approach significance (P = 0.94 and P = 0.61, Wilcoxon rank sum test).
The primary focus of our study was to compare the correlation between SAP and FDT in the assessment of anterior and posterior visual pathway disease. No difference was found suggesting that neurologic disease affects FDT similarly whether the insult is pre- or postchiasmal. However, it should be noted that in roughly 10% of cases (anterior and posterior) SAP and FDT did not correlate well. Our study was not designed to address this and the significance of this occasional discordance remains unknown. Also of interest, SAP measured the extent of a visual field defect to be larger than the extent measured by FDT more often than the reverse. However, this was not dissimilar for anterior and posterior disease.
Our study suffers from a number of shortcomings: most notably, the relatively small number of patients. Hence, we cannot entirely exclude small differences in the assessment of anterior and posterior disease with FDT. We were also unable to analyze subsets of patients with specific diseases. Moreover, the study was retrospective and therefore at risk of influence from biases inherent in all such investigations. For example, only patients tested with both modalities were included. This may raise the question as to why such patients were evaluated with two types of perimetry. The study period was selected specifically to address this. During this period, SAP and FDT were routinely requested in all new patients seen by one of the authors.
In conclusion, second-generation FDT perimetry provides results comparable to SAP in the assessment of patients with neuro-ophthalmic disease. This holds true for anterior and posterior disease alike. The inability of first-generation FDT to accurately delineate homonymous field defect lies in design. Large test spots that juxtapose the vertical meridian, presented in the nonseeing field, are variably detected by the seeing hemifield. This problem is mitigated with the use of a larger number of smaller test spots with a slight offset from midline. This learned lesson might be kept in mind during future innovations in perimetry.
Footnotes
Source of Support: Supported in part by an unrestricted grant to the Wilmer Ophthalmological Institute from Research to Prevent Blindness Inc, New York
Conflict of Interest: None declared.
REFERENCES
- 1.Anderson AJ, Johnson CA. Mechanisms isolated by frequency-doubling technology perimetry. Invest Ophthalmol Vis Sci. 2002;43:398–401. [PubMed] [Google Scholar]
- 2.Johnson CA. Selective versus nonselective losses in glaucoma. J Glaucoma. 1994;3(suppl):S33–44. [PubMed] [Google Scholar]
- 3.Johnson CA, Samuels SJ. Screening for glaucomatous visual field loss with frequency-doubling perimetry. Invest Ophthalmol Vis Sci. 1997;38:413–25. [PubMed] [Google Scholar]
- 4.White AJ, Sun H, Swanson WH, Lee BB. An examination of the physiological mechanisms underlying the frequency-doubling illusion. Invest Ophthalmol Vis Sci. 2002;43:3590–9. [PubMed] [Google Scholar]
- 5.Wall M, Neahring RK, Woodward KR. Sensitivity and specificity of frequency doubling perimetry in neuro-ophthalmic disorders: A comparison with conventional automated perimetry. Invest Ophthalmol Vis Sci. 2002;43:1277–83. [PubMed] [Google Scholar]
- 6.Thomas D, Thomas R, Muliyil JP, George R. Role of frequency doubling perimetry in detecting neuro-ophthalmic visual field defects. Am J Ophthalmol. 2001;131:734–41. doi: 10.1016/s0002-9394(01)00837-6. [DOI] [PubMed] [Google Scholar]
- 7.Anderson AJ, Johnson CA, Fingeret M, Keltner M, Keltner JL, Spry PG, et al. Characteristics of the normaltive database for the Humphrey Matrix perimeter. Invest Ophthalmol Vis Sci. 2005;46:1540–8. doi: 10.1167/iovs.04-0968. [DOI] [PMC free article] [PubMed] [Google Scholar]
- 8.Huang CQ, Carolan J, Redline D, Taravati P, Woodward KR, Johnson CA, et al. Humphrey Matrix perimetry in optic nerve and chiasmal disorders: Comparison with Humpharey SITA standard 24-2. Invest Ophthalmol Vis Sci. 2008;49:917–23. doi: 10.1167/iovs.07-0241. [DOI] [PubMed] [Google Scholar]
- 9.Taravati P, Woodward KR, Keltner JL, Johnson CA, Redline D, Carolan J, et al. Sensitivity and specificity of the Humphrey Matrix to detect homonymous hemianopias. Invest Ophthalmol Vis Sci. 2008;49:924–8. doi: 10.1167/iovs.07-0248. [DOI] [PubMed] [Google Scholar]
- 10.Monteiro ML, Moura FC, Cunha LP. Frequency doubling perimetry in patients with mild and moderate pituitary tumor-associated visual field defects detected by conventional perimetry. Arq Bras Oftalmol. 2007;70:323–9. doi: 10.1590/s0004-27492007000200024. [DOI] [PubMed] [Google Scholar]
- 11.Girkin CA, McGwin G, DeLeon-Ortega J. Frequency doubling technology perimetry in non-arteritic ischaemic optic neuropathy with altitudinal defects. Br J Ophthalmol. 2004;88:1274–9. doi: 10.1136/bjo.2004.046383. [DOI] [PMC free article] [PubMed] [Google Scholar]
- 12.King-Smith PE, Grigsby SS, Vingrys AJ, Benes SC, Supowit A. Efficient and unbiased modifications of the QUEST threshold method: Theory, stimulations, experimental evaluation and practical implementation. Vision Res. 1994;34:885–912. doi: 10.1016/0042-6989(94)90039-6. [DOI] [PubMed] [Google Scholar]
- 13.Tyrrell RA, Owens DA. A rapid technique to assess the resting states of eyes and other threshold phenomena: The modified binary search (MOBS) Behav Res methods Instrum Comput. 1988;20:137–41. [Google Scholar]