. 2012 May 2;2012:939645. doi: 10.1100/2012/939645
Copyright © 2012 Rajadurai Viswas et al.
This is an open access article distributed under the Creative Commons Attribution License, which permits unrestricted use, distribution, and reproduction in any medium, provided the original work is properly cited.
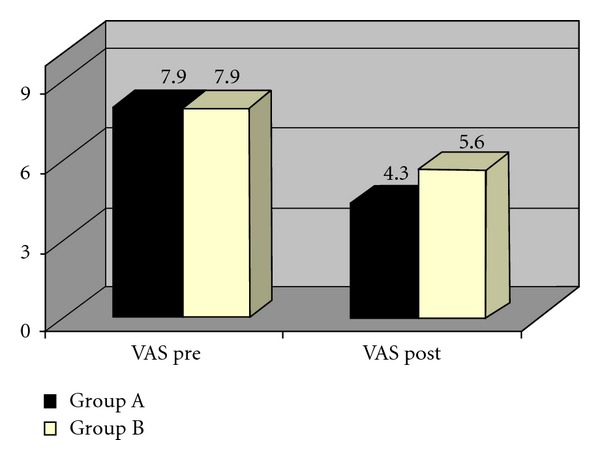
Figure 7.

Comparison of VAS scores of two groups.
