Abstract
Adsorption of dissolved molecules onto solid surfaces can be extremely sensitive to the atomic-scale properties of the solute and surface, causing difficulties for the design of fluidic systems in industrial, medical and technological applications. In this communication, we show that the Langmuir isotherm for adsorption of a small molecule to a realistic, heterogeneous surface can be predicted from atomic structures of the molecule and surface through molecular dynamics (MD) simulations. We highlight the method by studying the adsorption of dimethyl-methylphosphonate (DMMP) to amorphous silica substrates and show that subtle differences in the atomic-scale surface properties can have drastic effects on the Langmuir isotherm. The sensitivity of the method presented is sufficient to permit the optimization of fluidic devices and to determine fundamental design rules for controlling adsorption at the nanoscale.
Keywords: Langmuir isotherm, adsorption, nanochannel, nanofluidics, potential of mean force, molecular dynamics
Adsorption of solutes from a liquid phase to a solid substrate is a process ubiquitous across industries and technologies, yet it is often difficult to predict and control. Specific adsorption has many applications, ranging from clarification in winemaking,1 to dialysis, filtration and the treatment of acute poisoning,2 to the purification of proteins.3 At the same time, uncontrolled adsorption contributes to loss of product to vessel surfaces, clogging of small constrictions in coronary stents4 or microfluidic devices5 and performance deterioration of biosensors.6,7 The microscopic nature of adsorption phenomena requires the atomic structures of the solutes and the substrates be taken into account in order to design substrates to have set adsorption properties for specific solutes. In this communication, we describe a computational method for prediction of the adsorption isotherm specific to the atomic-scale details of the solute, solvent and substrate. Building on previous work in this area,7–14 we demonstrate utility of classical molecular dynamics (MD) simulations for prediction of macroscopic, experimentally accessible adsorption behavior of realistic, heterogeneous surfaces.
Monolayer adsorption is commonly described by the Langmuir isotherm
| (1) |
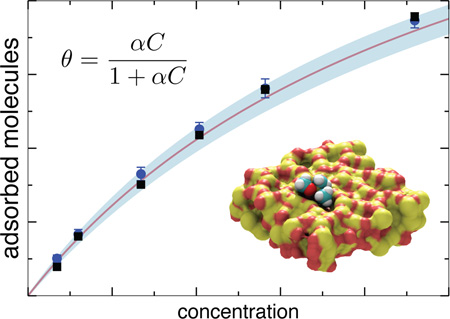
where θ is the fractional area of the surface covered by the adsorbed solutes, Cbulk is the solutes’ bulk concentration and the empirical parameter α specifies the solute–surface affinity, also known as the Langmuir constant. For a homogeneous surface containing a lattice of identical binding sites that can be occupied by only one solute, the Langmuir description is exact, with a being equal to the inverse of the bulk concentration at which half the surface is covered with the solute. In practice, most surfaces are neither periodic nor homogeneous in their binding affinity, and hence the Langmuir constant α is determined from experiment. Below we demonstrate that, in the case of a realistic heterogeneous surface, the Langmuir isotherm can be directly obtained from MD simulations and the Langmuir constant α can be computed from a 3-dimensional potential of mean force (3D PMF) for the solute near the surface.
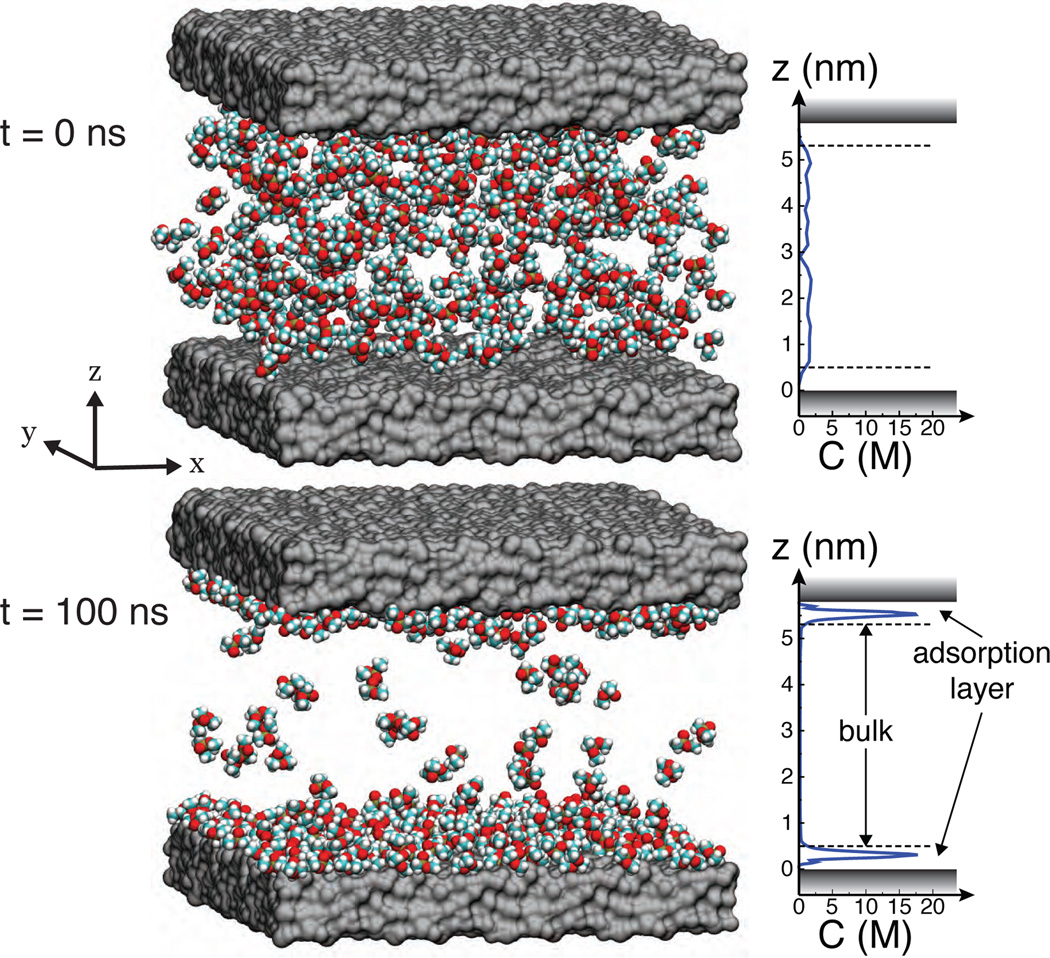
To simulate surface adsorption in all-atom detail, we have modeled a small, enclosed chamber of solution, using dimethyl methylphosphonate (DMMP) as a model solute. Figure 1 (top) shows a typical starting configuration of a simulation system consisting of a 10 × 10 nm2 slab of amorphous silica (SiO2), tiled from sixteen identical 2.5 × 2.5 nm2 patches, enclosing a 5–6 nm tall, well-mixed aqueous solution of DMMP. The system was made effectively infinite in the x – y plane using the periodic boundary conditions. A pressure gradient was imposed in one of the directions, producing a Poiseuille-type flow.15 The magnitude of the flow had negligible effect on adsorption. A complete description of the system setup and the simulation protocols is provided in Supporting Information.
Figure 1.
Molecular dynamics simulations of adsorption. (Top) Typical starting configuration containing randomly placed DMMP solute (shown as vdW spheres), two silica slabs (shown as gray molecular surfaces) and water (not shown). The plot specifies the average concentration of the solute along the z axis. (Bottom) The same system at the end of a 100-ns MD trajectory.
After initial energy minimization and equilibration, the system was simulated for ~100 ns using the classical MD method.16 As the simulation progressed, the concentration of DMMP in the center of the chamber gradually reduced as DMMP adsorbed to the surfaces of the slab. Figure S1 in the Supporting Information plots the number of adsorbed molecule versus time in a typical simulation. In less than 100 ns, the systems reach a dynamic equilibrium state, Figure 1 (bottom), which we used to calculate the average density of adsorbed solutes n and the bulk concentration Cbulk, different from the starting concentration. Here we defined a solute as adsorbed at the surface if its center of mass lies within 0.5 nm of the surface. As detailed in Figure 1, the equilibrium profile of DMMP concentration exhibits pronounced maxima near both surfaces of the slab and is constant elsewhere, and hence we refer to these two regions as the adsorption layer and bulk solution, respectively.
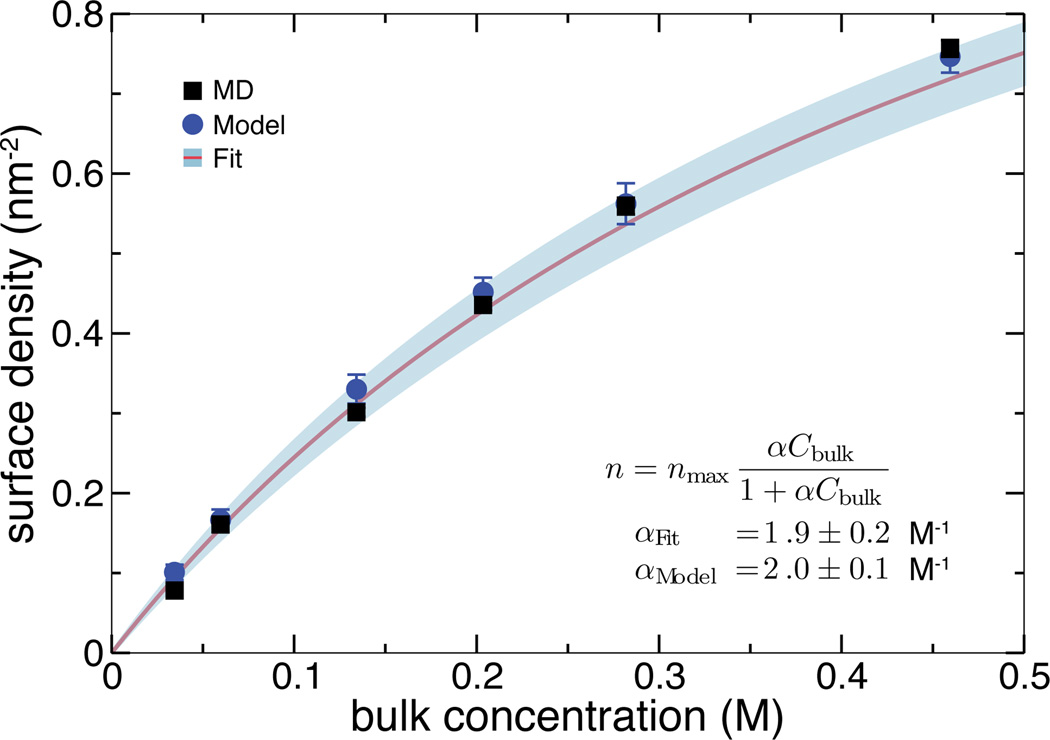
To obtain the adsorption isotherm, we repeated the above simulation having different starting amounts of DMMP in the chamber. The resulting dependence of the density of adsorbed solutes on the bulk concentration is shown in Figure 2 (black squares) along with the fit of the data to the Langmuir isoterm, Eq. (1) (solid line). The plot shows that the simulated adsorption obeys the Langmuir isotherm. To extract the Langmuir constant, independent MD simulations were performed to determine nmax—the maximum adsorption density of DMMP, which is required to compute the fractional surface coverage θ using the adsorption surface density n as θ = n/nmax (see Supporting Figure S2).
Figure 2.
Adsorption isotherm. Black squares indicate the data directly obtained from all-atom MD simulations. The solid line shows the fit of the Langmuir isotherm to the MD data; the expected error of the fit is shown in light blue. Blue circles show the predictions of the theoretical model based on the 3-dimensional potential of mean force (see text).
Thus, we have shown the utility of brute-force MD for predicting the Langmuir constant of a heterogeneous surface. Being essentially the numerical equivalent of an actual experiment, such an approach may not be optimal for designing surfaces with set adsorption properties, as it would require a large number of trials.
To link the local atomic-scale properties of the substrate and the solvent to the global adsorption properties of the surface, we express the Langmuir isotherm in terms of microscopic quantities. For a low-concentration solution, the Langmuir isotherm, Eq. (1) reduces to
| (2) |
and the concentration near the surface can be obtained as
| (3) |
where F(r⃗) is the free energy for a solute at position r⃗, set to zero in the bulk. By integrating the solute concentration over the adsorption layer (Figure 1) and dividing by the area of the surface, Asurface, the density of molecules adsorbed at the surface is
| (4) |
Using θ = n/nmax, we find n = α · Cbulk · nmax, or
| (5) |
| (6) |
which expresses the Langmuir constant α in terms of the maximum adsorption density nmax and the free energy F(r⃗). In this expression, nmax contains the information about the high-concentration behavior of the system.
To determine the free energy of a solute as a function of its position near the surface, we performed umbrella-sampling simulations17 of DMMP and the silica slab and obtained the 3D PMF using the weighted histogram method (WHAM)18 generalized to three dimensions (see Supporting Information). Such 3D PMF maps can be thought of as the change in free energy for bringing the solute molecule from the bulk solution to any point near the surface and reveals the variation in adsorption strength over the surface.
Figure 3 illustrates the results of such calculations, showing the silica surface colored by the local minimum value of the PMF for each (x,y) point. For this particular 2.5 × 2.5 nm2 patch of amorphous silica surface, the depth of the PMF near the surface varies from 0 to −6.6 kBT. The surface appears to have low and high affinity regions, highlighting its heterogeneous nature. The inset in Figure 3 shows the PMF as a function of z, averaged over the x – y plane, revealing the short-range nature of the interaction. The shape of the average PMF is in accord with the steady-state concentration profile of DMMP in Figure 1.
Figure 3.
Potential of mean force (PMF) of a DMMP solute in proximity to a heterogeneous surface. The silica slab is shown as a molecular surface colored by the local minimum value of the PMF in the direction normal to the slab (see text). Inset shows the PMF averaged over the x–y plane as a function of the distance from the surface.
Using Eq. (3), we have computed the Langmuir constant from the 3D PMF map shown in Figure 3 and the previously-determined maximum adsorption density nmax. The value predicted by the 3D PMF model: αModel = 2.0±0.1 M−1, is in excellent agreement with the fit to the adsorption simulation data: αFit = 1.9 ± 0.2 M−1, where the errors were estimated taking into account the uncertainty of determining nmax and the 3D PMF, or the surface concentration in the brute force MD data, respectively. Consequently, adsorption densities predicted by the model agree with the results of brute-force MD in the entire range of studied concentrations, Figure 2. Our model also describes the high-concentration regime for which nmax was determined. For example, at 4.6 M the Langmuir model predicts the adsorption density of 1.4 ± 0.12 nm−2, which is within the error of the brute-force MD value of 1.55 ± 0.01 nm−2.
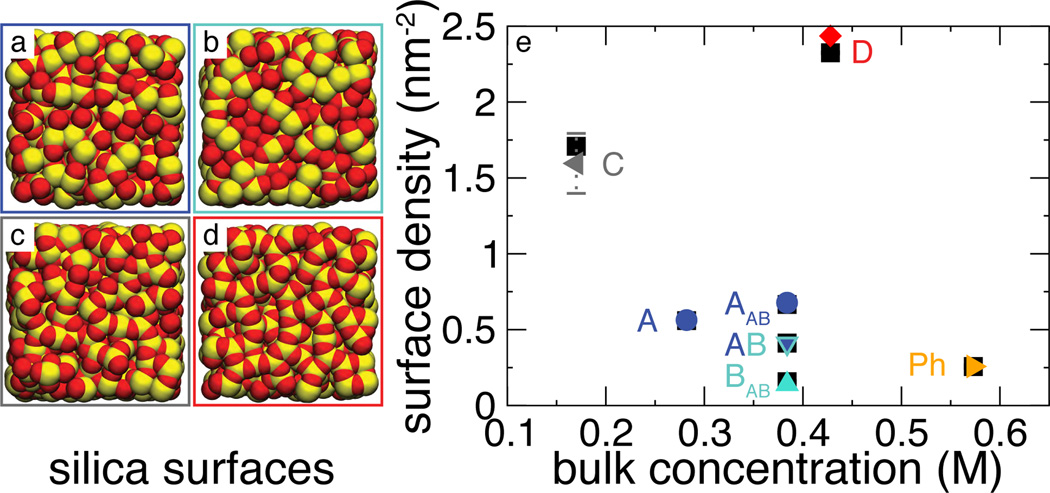
To test the robustness of the 3D PMF model against variations in the atomic-scale features of the substrate surface, we repeated both brute-force and 3D PMF calculations for three additional amorphous silica slabs that had different surface features introduced by thermal annealing8 (see Supporting Information). Figure 4 (a–d) illustrate the atomic structures of the four surfaces; data presented in Figures 1, 2 and 3 pertain to surface A. Surface B was simulated in a chamber constructed using both surface A and B, with surface A on the bottom and B on the top, which is referred to as system AB. For comparison, the same calculations were performed for a frictionless hydrophobic surface19 (Ph) devoid of any atomic-scale features.
Figure 4.
Test of the 3D-PMF model of adsorption using different heterogeneous surfaces. (a–d) Atomic model of the surface of silica slabs A–D, respectively. Oxygen and silicon atoms are shown as red and yellow vdW spheres, respectively. (e) Test of the model. Black squares indicate data directly obtained from MD simulations, other symbols show predictions of the 3D-PMF model. Labels A, B, C, and D indicate the surfaces the data were obtained for (also shown as panels a–d); AB labels the system that combined two different surfaces (A and B, labeled AAB and BAB), and Ph indicates a phantom surface, a smooth surface that lacks atomic-scale features (see text).
Figure 4 e compares the predictions of the 3D PMF model with the results of the brute-force MD simulations. In all cases, the two models produced quantitatively consistent results. Because of the considerable difference in the overall affinity of the surfaces to DMMP, to make the comparison statistically significant, lower-affinity systems were simulated at higher bulk concentrations of the solute.
In Eq. (3), nmax is assumed to be a constant global property of the surface, an assumption that may not hold for extremely heterogeneous or patterned surfaces. In these cases, constant nmax may still approximate large subsections of the surface and the global adsorption can be determined as a weighted average over the constant nmax subsections. Results for system AB illustrate this point. In Figure 4, data points AAB and BAB show the predicted and simulated adsorption density on only surface A and B, respectively; AB shows the total on both surfaces.
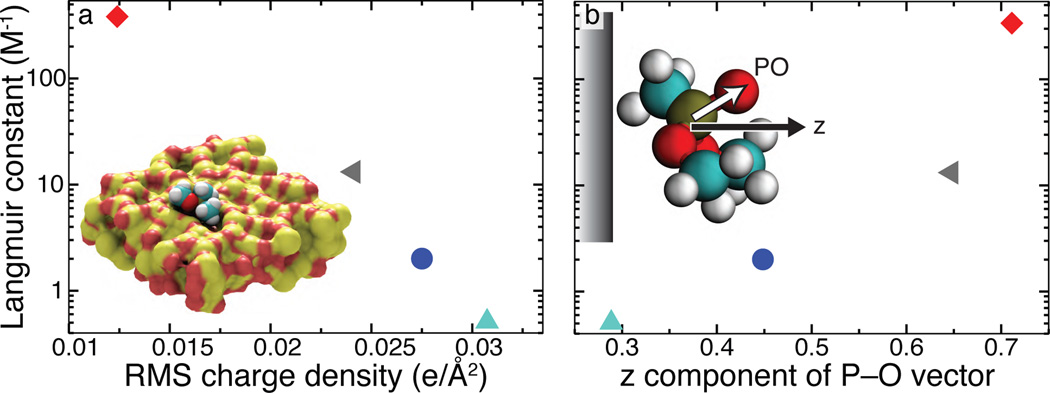
The Langmuir constants of the four silica surfaces are plotted in Figure 5. Surprisingly, we find that subtle variations in the arrangement of the surface atoms (see Figure 4 (a–d)) can alter the Langmuir constant by three orders of magnitude. To determine the microscopic cause for such an effect, we have computed local maps of the atomic scale roughness and the surface charge density for each surface and compared the resulting 2D plots with the 2D plot of the PMF’s local minima, see Supporting Information Figure S3. Whereas some correlation between the surface topography and the PMF maps is apparent (see the right-most column in Figure S3), there is no consistent dependence, as indicated by the plot of the Langmuir constant versus the root mean squared (RMS) roughness of the surfaces, Figure S4. Similarly, neither the local pattern of the surface charges correlate with the PMF maps nor does the global surface charge with the Langmuir constant, see Figure S5.
Figure 5.
Atomic features affect adsorption. For the four silica surfaces, the Langmuir constant is plotted as a function of (a) the root mean square (RMS) surface charge density and (b) the conformation of the adsorbed solutes. The latter is characterized by the average projection of the P–O bond unit vector onto the normal of the slab. Colors and symbols are the same as in Figure 4 e. Inset to (a) shows a DMMP molecule bound to a small pocket (surface D).
Nevertheless, Figure 5 (a) shows a strong anticorrelation between the Langmuir constant and the RMS surface charge, suggesting a hydrophobic effect in the mechanism of DMMP attraction to silica. Indeed, it was previously shown that an amorphous silica surface becomes more hydrophobic as the number of dangling atoms (responsible for the high RMS charge density) is reduced.8 The annealing procedure used to create the silica surfaces has exactly that effect. Inspection of the DMMP conformation in the bound state confirms this assertion: on average, the P–O bond of DMMP was found to point away from the surface, exposing the oxygen to the solution. As shown in Figure 5 b, surfaces that exhibit stronger adsorption of DMMP also produce a stronger orientational order. As the phantom surface, a neutral barrier with no atoms, has a smaller Langmuir constant than any of the silica surfaces, the adsorption of DMMP to silica is not primarily driven to minimize water-DMMP contacts, but rather to exclude water from hydrophobic patches of silica. Here, the local properties of the solution clearly play an important role, as they are known to depend on the atomic-scale features of the surface.20,21
In this letter, we have described and validated a computational method for predicting the Langmuir adsorption isotherm of realistic heterogeneous surfaces. The method permits macroscopically observable properties to be directly related to the atomic structure of the solute, solvent and the substrate and can be applied to study adsorption of any small, weakly interacting solutes and broad range of surfaces, including metals, oxides, polymers, and functionalized and patterned substrates, provided the solute-substrate interactions are appropriately described.22,23 The exquisite sensitivity of the method to the atomic-scale features of the systems will find practical application in rational design of surfaces to minimize non-specific adsorption, maximize selective binding of desired solutes, and determine fundamental design rules that govern adsorption at the nanoscale.
Supplementary Material
Acknowledgement
The authors would like to thank Karin Dahmen and Vincent Hock for their comments on this work. This work was supported by grants from the National Science Foundation (DMR-0955959), the Petroleum Research Fund (48352-G6) and through a cooperative research agreement with the U.S. Army Engineer Research and Development Center - Construction Engineering Research Laboratory (ERDC-CERL). The authors gladly acknowledge supercomputer time provided by the TeraGrid through grant MCA05S028 and through the Department of Defense High Performance Computing Modernization Program at the ERDC Supercomputing Resource Center, Vicksburg, Mississippi.
Footnotes
Supporting Information Available
Details of the simulation methods, setup and analysis, and additional figures. This material is available free of charge via the Internet at http://pubs.acs.org/.
References
- 1.Castellari M, Versari A, Fabiani A, Parpinello G, Galassi S. Removal of Ochratoxin A in Red Wines by Means of Adsorption Treatments with Commercial Fining Agents. J. Agric. Food Chem. 2001;49:3917–3921. doi: 10.1021/jf010137o. [DOI] [PubMed] [Google Scholar]
- 2.Mikhalovsky S. Emerging Technologies in Extracorporeal Treatment: Focus on Adsorption. Perfusion. 2003;18:47–54. doi: 10.1191/0267659103pf627oa. [DOI] [PubMed] [Google Scholar]
- 3.Regnier F, Gooding K. High-Performance Liquid Chromatography of Proteins. Anal. Biochem. 1980;103:1–25. doi: 10.1007/978-1-4615-6728-8_1. [DOI] [PubMed] [Google Scholar]
- 4.Thierry B, Merhi Y, Bilodeau L, Trepanier C, Tabrizian M. Nitinol Versus Stainless Steel Stents: Acute Thrombogenicity Study in an Ex Vivo Porcine Model. Biomaterials. 2002;23:2997–3005. doi: 10.1016/s0142-9612(02)00030-3. [DOI] [PubMed] [Google Scholar]
- 5.Tegenfeldt JO, Prinz C, Cao H, Huang RL, Austin RH, Chou SY, Cox EC, Sturm JC. Micro- and Nanofluidics for DNA Analysis. Anal. Bioanal. Chem. 2004;378:1678–1692. doi: 10.1007/s00216-004-2526-0. [DOI] [PubMed] [Google Scholar]
- 6.Niedzwiecki DJ, Grazul J, Movileanu L. Single-Molecule Observation of Protein Adsorption onto an Inorganic Surface. J. Am. Chem. Soc. 2010;132:10816–10822. doi: 10.1021/ja1026858. [DOI] [PMC free article] [PubMed] [Google Scholar]
- 7.Radadia AD, Stavis CJ, Carr R, Zeng H, King WP, Carlisle JA, Aksimentiev A, Hamers RJ, Bashir R. Control of Nanoscale Environment to Improve Stability of Immobilized Proteins on Diamond Surfaces. Adv. Funct. Mater. 2011;21:1040–1050. doi: 10.1002/adfm.201002251. [DOI] [PMC free article] [PubMed] [Google Scholar]
- 8.Cruz-Chu ER, Aksimentiev A, Schulten K. Water-Silica Force Field for Simulating Nanodevices. J. Phys. Chem. B. 2006;110:21497–21508. doi: 10.1021/jp063896o. [DOI] [PMC free article] [PubMed] [Google Scholar]
- 9.Hassanali AA, Singer SJ. Model for the Water–Amorphous Silica Interface: The Undissociated Surface. J. Phys. Chem. B. 2007;111:11181–11193. doi: 10.1021/jp062971s. [DOI] [PubMed] [Google Scholar]
- 10.Park J, Aluru N. Temperature-Dependent Wettability on a Titanium Dioxide Surface. Mol. Sim. 2009;35:31–37. [Google Scholar]
- 11.Schneider J, Ciacchi LC. A Classical Potential to Model the Adsorption of Biological Molecules on Oxidized Titanium Surfaces. J. Chem. Theory Comput. 2011;7:473–484. doi: 10.1021/ct1004388. [DOI] [PubMed] [Google Scholar]
- 12.Wang B, Kral P. Optimal Atomistic Modifications of Material Surfaces: Design of Selective Nesting Sites for Biomolecules. Small. 2007;3:580–584. doi: 10.1002/smll.200600433. [DOI] [PubMed] [Google Scholar]
- 13.Serr A, Horinek D, Netz R. Polypeptide Friction and Adhesion on Hydrophobic and Hydrophilic Surfaces: A Molecular Dynamics Case Study. J. Am. Chem. Soc. 2008;130:12408–12413. doi: 10.1021/ja802234f. [DOI] [PubMed] [Google Scholar]
- 14.Ziemys A, Ferrari M, Cavasotto C. Molecular Modeling of Glucose Diffusivity in Silica Nanochannels. J Nanosci. Nanotechnol. 2009;9:6349–6359. doi: 10.1166/jnn.2009.1822. [DOI] [PubMed] [Google Scholar]
- 15.Carr R, Comer J, Ginsberg MD, Aksimentiev A. Modeling Pressure-Driven Transport of Proteins through a Nanochannel. IEEE Tran. Nanotechnol. 2011;10:75–82. doi: 10.1109/tnano.2010.2062530. [DOI] [PMC free article] [PubMed] [Google Scholar]
- 16.Phillips JC, Braun R, Wang W, Gumbart J, Tajkhorshid E, Villa E, Chipot C, Skeel RD, Kale L, Schulten K. Scalable Molecular Dynamics with NAMD. J. Comp. Chem. 2005;26:1781–1802. doi: 10.1002/jcc.20289. [DOI] [PMC free article] [PubMed] [Google Scholar]
- 17.Torrie G, Valleau J. Nonphysical Sampling Distributions in Monte Carlo Free-Energy Estimation: Umbrella Sampling. J. Comp. Phys. 1977;23:187–199. [Google Scholar]
- 18.Roux B. The Calculation of the Potential of Mean Force Using Computer Simulations. Comp. Phys. Comm. 1995;91:275–282. [Google Scholar]
- 19.Heng JB, Aksimentiev A, Ho C, Marks P, Grinkova YV, Sligar S, Schulten K, Timp G. The Electromechanics of DNA in a Synthetic Nanopore. Biophys. J. 2006;90:1098–1106. doi: 10.1529/biophysj.105.070672. [DOI] [PMC free article] [PubMed] [Google Scholar]
- 20.Sendner C, Horinek D, Bocquet L, Netz RR. Interfacial Water at Hydrophobic and Hydrophilic Surfaces: Slip, Viscosity, and Diffusion. Langmuir. 2009;25:10768–10781. doi: 10.1021/la901314b. [DOI] [PubMed] [Google Scholar]
- 21.Poissier A, Ganeshan S, Fernandez-Serra MV. The Role of Hydrogen Bonding in Water- Metal Interactions. Phys. Chem. Chem. Phys. 2011;13:3375–3384. doi: 10.1039/c0cp00994f. [DOI] [PubMed] [Google Scholar]
- 22.Ghiringhelli L, Hess B, van der Vegt N, Delle Site L. Competing Adsorption Between Hydrated Peptides and Water onto Metal Surfaces: From Electronic to Conformational Properties. J. Am. Chem. Soc. 2008;130:13460–13464. doi: 10.1021/ja804350v. [DOI] [PubMed] [Google Scholar]
- 23.Dianat A, Seriani N, Ciacchi L, Pompe W, Cuniberti G, Bobeth M. Dissociative Adsorption of Methane on Surface Oxide Structures of Pd–Pt Alloys. J. Phys. Chem. C. 2009;113:21097–21105. [Google Scholar]
Associated Data
This section collects any data citations, data availability statements, or supplementary materials included in this article.


