Abstract
Mammalian cells resist the uptake of nucleic acids. The lipid bilayer of the plasma membrane presents one barrier. Here, we report on a second physicochemical barrier for uptake. To create a sensitive probe for nucleic acid–cell interactions, we synthesized fluorescent conjugates in which lipids are linked to DNA oligonucleotides. We found that these conjugates incorporate readily into the plasma membrane but are not retained there. Expulsion of lipid–oligonucleotide conjugates from the plasma membrane increases with oligonucleotide length. Conversely, the incorporation of conjugates increases markedly in cells that lack the major anionic components of the glycocalyx—sialic acid and glycosaminoglycans, and in cells that had incorporated highly cationic lipids into their plasma membrane. We conclude that anionic oligosaccharides provide a formidable barrier to the uptake of nucleic acids by mammalian cells. This conclusion has implications for genomic stability, as well as the delivery of genes and siRNAs into mammalian cells.
INTRODUCTION
The efficient delivery of genes into cells could engender reparative therapies for genetic diseases.1 The advent of RNAi technology2 has provoked additional interest in the cellular delivery of nucleic acids.3 Delivering genes and siRNAs into cells requires that nucleic acids traverse the plasma membrane. A thorough understanding of the interaction of nucleic acids with cell-surface molecules could inspire new strategies for efficient cellular internalization.4
The mammalian cell surface is analogous to a forest, wherein phospholipid head groups are the floor, extracellular domains of transmembrane proteins are the understory, and oligosaccharides of glycolipids and glycoproteins are the canopy. These oligosaccharides, known collectively as the glycocalyx, constitute the bulk of the material on a cell surface.5 The glycocalyx is highly anionic, due largely to the presence of sialic acid, which contains a carboxylate group, and glycosaminoglycans (GAGs), which contain both carboxylate and sulfate groups. As expected from Coulomb’s law,6 cationic and neutral molecules are delivered more readily into cells than are anionic molecules.7 Masking the anionic charge of DNA with a highly cationic lipid (such as Lipofectamine™) facilitates the delivery of DNA into cells.8
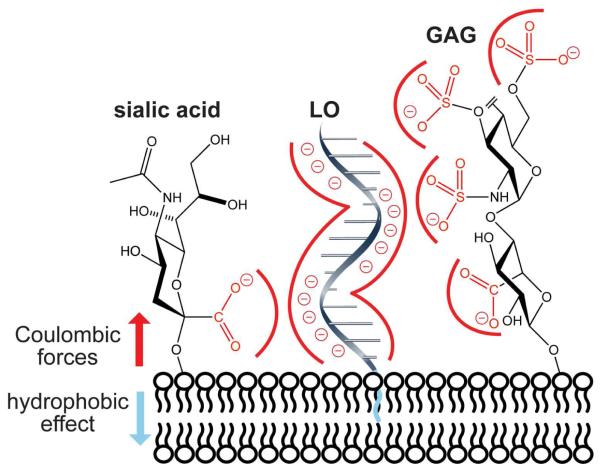
To analyze the interaction of nucleic acids with the cell surface, we sought to create an equilibrating system in which nucleic acids could be localized near the glycocalyx without disrupting the biophysical characteristics of either the nucleic acids or the cell surface. We reasoned that the conjugation of a lipid tail onto a DNA oligonucleotide would enable such a system (Figure 1). Here, we use fluorescently labeled lipid–oligonucleotide conjugates (LOs) to characterize DNA–glycocalyx interactions. Such conjugates are known to incorporate into the plasma membrane.9 Our findings provide insight on evolutionary imperatives and suggest new strategies for the cellular delivery of nucleic acids.
Figure 1.
Depiction of forces that govern the interaction of a lipid– oligonucleotide conjugate (LO) with mammalian cells. The hydrophobic effect mediated by the lipid tails stabilizes an LO in a cellular membrane, enabling analysis of the consequences of Coulombic repulsion between an anionic nucleic acid and anionic sialic acid and glycosaminoglycans (GAGs).
METHODS
General
2-Cyanoethyl N,N-diisopropylchlorophosphoramidite, anhydrous dichloromethane (DCM), N,N-diisopropylethylamine (DIEA), and octadecanol were from Sigma–Aldrich (St. Louis, MO). A 2.0 M aqueous solution of triethylammonium acetate (TEAA) was from Glen Research (Sterling, VA). “NH4OH solution” refers to a 30% v/v solution in H2O diluted as specified. All other chemicals and reagents were obtained from commercial suppliers, and used without further purification.
The removal of solvents and other volatile materials “under reduced pressure” refers to the use of a rotary evaporator at water-aspirator pressure (<20 torr) and a water bath of <40 °C.
Instrumentation
NMR spectra were acquired at ambient temperature with a Bruker DMX-400 Avance spectrometer (Bruker AXS, Madison, WI, 1H, 400.1 MHz; 13C, 100.6 MHz; 31P, 162.0 MHz) at the National Magnetic Resonance Facility at Madison (NMRFAM). 13C and 31P spectra were proton-decoupled. Oligonucleotide A260 values were measured with a Varian Cary 50 ultraviolet–visible spectrometer (Agilent Technologies, Santa Clara, CA), Thermo Fisher Nano-Drop 1000 instrument (Thermo Fisher Scientific, Walham, MA), or GE NanoVue instrument (GE Healthcare, Piscataway, NJ). Confocal microscopy was performed with a Nikon Eclipse C1 laser scanning confocal microscope (Nikon, Melville, NY). Flow cytometry was done using a LSRII (BD Biosciences, San Jose, CA) at the University of Wisconsin– Madison Carbone Cancer Center Flow Cytometry Facility. MALDI–TOF mass spectrometry was performed with a Voyager DE-Pro MALDI–TOF instrument (Applied Biosystems, Carlsbad, CA) at the University of Wisconsin–Madison Biophysics Instrumentation Facility.
Synthesis of Alkylphosphoramidites
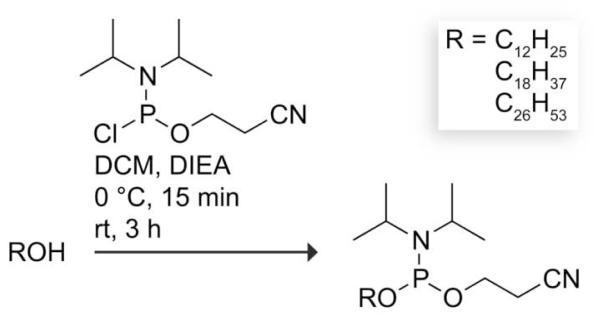
Alkylphoshoramidites were synthesized by the route in Scheme 1.10 As an example, 2-cyanoethyl N,N-diisopropyloctadecylphosphoramidite (R = C18H37) was synthesized as follows. Octadecanol (294 mg, 1.09 mmol) was dissolved in anhydrous DCM (13 mL) in a flask under Ar(g). DIEA (350 μL, 2 mmol) was added dropwise, and the reaction mixture was cooled to 0 °C. 2-Cyanoethyl N,N-diisopropylchlorophosphoramidite (350 μL, 1.6 mmol) was added dropwise using a glass luer-tipped syringe. After 15 min, the reaction mixture was allowed to warm to room temperature, and then stirred for 3 h. The organic layer was washed with saturated aqueous NaHCO3, dried over MgSO4(s), filtered, and concentrated under reduced pressure. The product was purified by flash chromatography on silica gel (mesh: 230–400 ASTM), eluting with 10% ethyl acetate/1% triethylamine/hexanes, using silica packed with triethylamine (20% v/v) in hexanes. The product was concentrated under reduced pressure. 2-Cyanoethyl N,N-diisopropyloctadecylphosphoramidite (262 mg, 0.56 mmol, 51%) was isolated as a clear oil and stored under Ar(g) at −20 °C until used. 1H NMR (400 MHz, CDCl3) δ = 3.90–3.78 (m, 2H), 3.72–3.53 (m, 4H), 2.64 (t, 2H, J = 6.71 Hz), 1.60 (t, 2H, J = 6.68 Hz), 1.39–1.22 (m, 30H), 1.18 (t, 12H, J = 5.26 Hz), 0.88 (t, 3H, J = 6.45 Hz). 13C NMR (100 MHz, CDCl3) δ = 117.6, 63.6, 58.2, 43.0, 31.9, 31.2, 29.6, 29.4, 25.9, 24.6, 22.7, 20.3, 14.1. 31P NMR (162 MHz, CDCl3) δ = 146.3.
Scheme 1.
Synthesis, Purification, and Analysis of Lipid– Oligonucleotide Conjugates
LOs and DNA oligonucleotides were synthesized with an Applied Biosystems ABI 394 DNA synthesizer at the University of Wisconsin–Madison Biotechnology Center, where an alkylphosphoramidite was the last phosphoramidite to undergo coupling. Fluorescein-conjugated oligonucleotides were synthesized by elongation on 1-dimethoxytrityloxy-3-[O-(N-carboxy-(di-O-pivaloyl-fluorescein)-3-aminopropyl)]-propyl-2-O-succinoyl-long chain alkylamino-CPG (which is 3′-(6-FAM) CPG from Glen Research, Sterling, VA). Reverse DNA synthesis was required to conjugate lipids to the 3′ end. After synthesis, the controlled pore glass was placed in a 4-mL glass vial with 1 mL of undiluted NH4OH solution and incubated at 70 °C for 2 h. The solution was then passed through a 0.45-μm filter, and dried overnight with a SpeedVac Concentrator (Thermo Scientific, Waltham, MA). The oligonucleotides were dissolved in 0.1 M TEAA in NH4OH solution (5% v/v) and sonicated briefly to break up aggregates. The solution was then passed through a 0.2-μm filter and purified by HPLC using an Ultimate 3000 instrument (Dionex Corporation, Sunnyvale, CA) equipped with a Varian PLRP-S column (100 Å, 8 μm, 300 × 75 mm) heated to 50 °C. Product was eluted at 3 mL/min with a linear gradient (40– 95%) of buffer A (MeOH containing 0.1 M aqueous TEAA) and buffer B (H2O containing 0.1 M aqueous TEAA and 1% v/v NH4OH solution). Each fraction was analyzed by mass spectrometry to ensure that n – 1 “failure” sequences were not pooled with the intended product. Mass spectrometry was performed using 1 μL of DNA solution, 1 μL of 113 mg/mL ammonium citrate in H2O, and 2 μL of 50 mg/mL 3-hydroxypicolinic acid in 1:1 H2O/acetonitrile. Each LO had an observed mass within 30 Da of its expected mass. LOs and oligonucleotides were stored at −20 °C as a lyophilized powder until used.
Cell Culture
Cell lines were obtained from American Type Culture Collection (Rockville, MD) and were maintained according to the recommended guidelines. Cells were grown in flat-bottomed culture flasks at 37 °C under 5% v/v CO2(g). Cell medium was supplemented with fetal bovine serum (FBS) from Invitrogen (Carlsbad, CA) (10% v/v), penicillin (100 units/mL), and streptomycin (100 μg/mL) in the appropriate cellular medium as follows: HeLa, Dulbecco’s modified Eagle’s medium (DMEM); K-562, Roswell Park Memorial Institute 1640; Pro-5, Minimum Essential Medium (MEM) α + ribonucleosides + deoxyribonucleosides; Lec-2, MEM α – ribonucleosides – deoxyribonucleosides; Chinese hamster ovary (CHO)-1, F-12; and CHO-745, F-12. Cells were counted by hemocytometry for dispensing into 6-well plates, 12-well plates (Corning Costar, Lowell, MA), or 8-well chambered coverglass slides (Nuc Lab-Tek II, Thermo Scientific).
Incorporation of LOs into the Plasma Membrane
On the day prior to an experiment, lyophilized stocks of purified DNA were suspended in autoclaved water, and DNA concentrations were determined by absorbance at 260 nm using extinction coefficients calculated with the program SciTools OligoAnalyzer 3.1 (Integrated DNA Technologies, Coralville, IA), with the assumption that the lipid tails do not alter the absorbance of the conjugates. Aliquots of the DNA were put into microcentrifuge tubes and dried overnight with a SpeedVac Concentrator. Fifteen minutes prior to incubation with cells, LO aliquots were suspended in 400 μL of cell medium giving a final concentration of 10 μM LO (unless indicated otherwise), and these solutions were warmed to 37 °C.
Non-adherent Cells
One day prior to the experiment, 6 × 10⁵ cells were placed into each well of a 6-well plate. On the day of the experiment, cells were washed twice with phosphate-buffered saline (PBS), as follows. Cells were removed from the well, and collected by centrifugation in a 1.7-mL tube for 5 min at 1000 rpm. The supernatant was removed, and the cells were suspended in 1.5 mL of phosphate-buffered saline (PBS). This process was repeated once more. Then, cells were suspended in 400 μL of cell medium containing LO at the indicated final concentration, and incubated for 10 min at 37 °C. The cells were collected by centrifugation at 1000 rpm for 5 min, washed twice with phosphate-buffered saline (PBS) as described previously, suspended in 400 μL of medium, added to flow cytometry tubes, and stored on ice until analyzed by flow cytometry.
Adherent Cells
One day prior to the experiment, approximately 2 × 10⁵ cells were added to the wells of 6-well plates. On the day of the experiment, the medium was removed, and the cells were rinsed twice with 1 mL of PBS. After the PBS was removed, a 400 μL suspension of LO in cell medium (unless indicated otherwise) was incubated with the cells at 37 °C for 15 min. The LO suspension was then removed, and the cells were rinsed twice with 1 mL of PBS, and incubated with 400 μL of 0.05% w/v trypsin with EDTA for 10 min at 37 °C. The cell suspension was removed from the 6-well plate, added to flow cytometry tubes containing 80 μL of FBS, and stored on ice until analyzed by flow cytometry.
Lipofectamine™
LOs were incorporated into the plasma membrane of adherent cells as described above except that after the first two PBS washings, the cells were incubated for 15 min with 400 μL of cell medium and the indicated amount of Lipofecamine 2000 (Invitrogen), washed twice with PBS, and then incubated with 400 μL of cell medium containing LO. The remainder of the experiment was done as described above.
Retention of LOs in the Plasma Membrane
Cells were labeled as described previously except that after the 15-min incubation period, the cells were washed twice with 1 mL of PBS and incubated for the indicated time in medium containing FBS (10% v/v). After the incubation period, the cells were washed twice with 1 mL of PBS, placed directly in flow cytometry tubes, and stored on ice until analyzed by flow cytometry. If the cells were adherent, then they were washed twice with 1 mL of PBS and incubated with 400 μL of trypsin/EDTA (Invitrogen) for 10 min at 37 °C. The cell suspensions were removed and added to flow cytometry tubes containing 80 μL of FBS, and stored on ice until analyzed by flow cytometry.
Confocal Microscopy
HeLa cells were plated on Nunc Labtek II 8-well chambered coverglass 24 h before use and grown to 80% confluency. Cells were incubated with the LO at the indicated concentrations, medium conditions, and times. Cell nuclei were stained with Hoechst 33342 (Invitrogen; 2 μg/mL) for the final 15 min of incubation. Cells were then washed twice with PBS, suspended in PBS, and examined with confocal microscopy.
Flow Cytometry
Fluorescein was excited with a 488-nm solid-state laser, and the emission was collected with a 530/30 band-pass filter. To collect comparable data in each flow cytometry experiment, the sensitivity (i.e., voltage) of the photomultiplier tube was set for all data collections using mid-range Rainbow beads (Spherotech, Lake Forest, IL) to give a predetermined fluorescence target value of 2511. At least 10,000 cellular events were acquired for each sample. Additionally, at least 5,000 events ofQuantum™ FITC MESF (fluorescein isothiocyanate molecules of equivalent soluble fluorochrome) high beads (Bangs Laboratories, Fishers, IN) were acquired for each experiment. Data were analyzed with FlowJo 8.1.3 software (Treestar, Ashland, OR). The relative fluorescence units (RFU) of the LO FITC fluorescence was normalized to MESF beads to calculate how many FITC molecules were affiliated with each cell. There was one FITC molecule per LO, enabling quantification of LOs/cell.
siRNA Transfection
The transfection efficiency of Lec-2 and Pro-5 cells was assessed with a TransIT®-siPAK Plus Kit (Mirus Bio, Madison, WI). The day prior to the experiment, 105 cells/well were plated in a 12-well plate, which gave ~80% cell confluency on the day of the experiment. Transfection of fluorescently labeled siRNA (25 nM) was assessed by using TransIT-siQUEST concentrations 1× (that is, 1 μL) and 6× (6 μL), and TransIT-TKO concentrations 1× (2 μL) and 4× (8 μL).
RESULTS
LO and Medium Attributes that Affect Incorporation
Our initial experiments used confocal microscopy to observe the interaction of synthetic LOs (Table 1) with live mammalian cells. We found that LOs were incorporated into the plasma membrane in a concentration-dependent manner that relied on the presence of the lipid tail (Figure S1, panel A). LO-incorporation occurred within an hour of incubation, regardless of the presence of serum in the medium (Figure S1, panel B).
Table 1.
Synthetic DNA oligonucleotides used in this work
| Sequence (5′→3′) | |
|---|---|
| LO 1 | L18AAAAAAAAAAAAAAAAAAAAF |
| 2 | AAAAAAAAAAAAAAAAAAAAF |
| LO 3 | L18GCGGCTAGCAAAAAAAAAAAAAAAF |
| LO 4 | L18AAAAAAAAAAAAAAAAAAAAAAAAAAAAAAAAAAAAAF |
| LO 5 | L18AAAAAAAAAAF |
| LO 6 | L18AAAAAAAAAAAAAAAF |
| LO 7 | L18AAGAACGAAAGAAAAGTAACCAAAF |
| LO 8 | L18ATCTTAGGGAATCTATGCTCCTTGGGACAGAAACACTF |
| 9 | GCGGCTAGCAAAAAAAAAAAAAAAF |
| LO 10 | L12GCGGCTAGCAAAAAAAAAAAAAAAF |
| LO 11 | L26GCGGCTAGCAAAAAAAAAAAAAAAF |
| LO 12 | TTTTTTTTTTTTTTTCCAAGCCGCL18 |
| 13 | GCGGCTTGGAAAAAAAAAAAAAAAF |
F = 6-carboxyfluorescein; Ln = alkyl chain with n carbons.
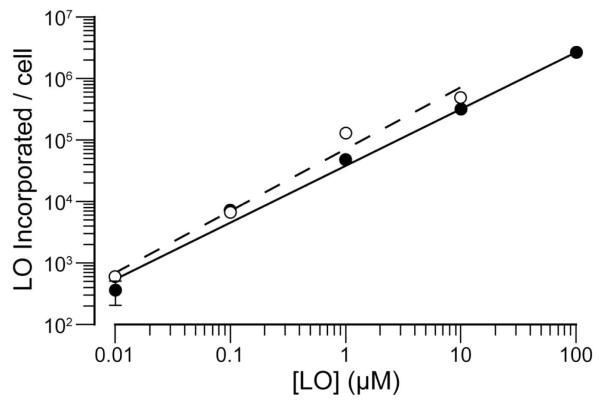
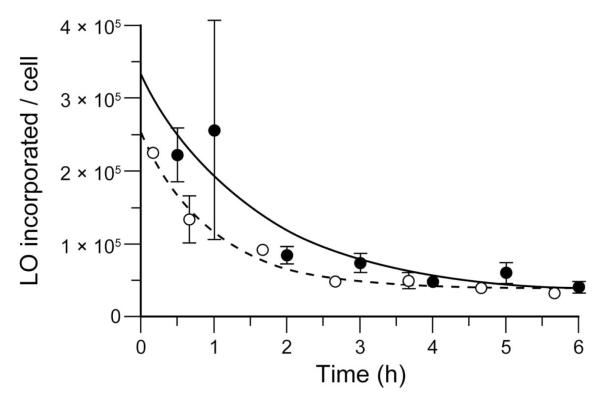
Next, we used flow cytometry to obtain quantitative data on the interaction of LOs with cells. We found the concentration-dependence of LO-incorporation to be indistinguishable in two distinct cell types (Figure 2) and the rate of LO-incorporation to decrease with time, indicative of steady-state equilibration (Figure S2). The extent of LO-incorporation depends on the medium, decreasing in the order: PBS > DMEM > PBS containing FBS (10% v/v) > DMEM containing FBS (10% v/v) (Figure S3). To confirm that LOs partition between the aqueous phase and the cell surface, we replaced the medium from LO-labeled cells and observed a gradual loss of LO incorporated/cell as LOs diffused out of the plasma membrane and into the fresh medium to establish a new equilibrium (Figure 3). A LO containing 24 nucleotides and a 1,2-O-dioctadecyl-rac-glycerol lipid (which contains two C18 tails) was retained only ~3-fold longer by HeLa cells than was LO 3 (data not shown). We note that this intrinsic instability could confound efforts to exploit LOs incorporated into cellular membranes.9
Figure 2.
Cellular incorporation of a LO depends on concentration. Fluoresent LO 3 was incubated with HeLa cells (● n = 3) and K-562 cells (○; n = 1) for 15 min, and incorporation was measured by flow cytometry. Error bars: ±SD (which were all smaller than the “○” symbols).
Figure 3.
Cells release a LO after incorporation. Fluorescent LO 3 (10 μM) was incorporated into the plasma membrane of HeLa cells (● n = 3) and K-562 cells (○; n = 3). The cells were then washed and incubated with cell medium containing FBS (10% v/v) for the indicated time. Cellular retention was measured by flow cytometry. Error bars: ±SD.
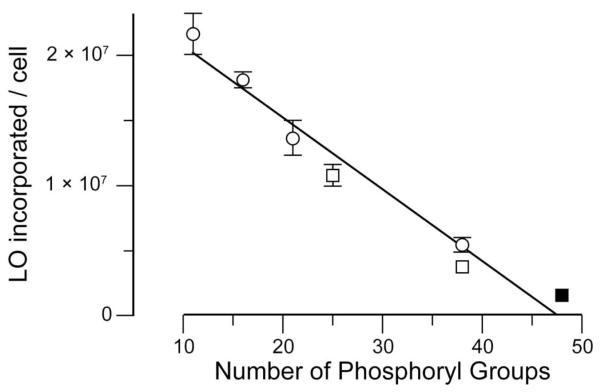
We sought to discern whether the anionic components of the cell surface repel LOs. We did so by measuring the dependence of LO-incorporation on the length of the oligonucleotide. Regardless of its sequence, the incorporation of a LO correlates inversely with the number of its phosphoryl groups (Figure 4). Tan and coworkers observed a similar trend, concluding that longer LOs form larger micelles and that larger micelles fuse less well with the cell surface.9d We favor an alternative explanation—longer oligonucleotides contain more anionic phosphoryl groups that are repelled by the anionic glycocalyx. For example, we observed this correlation for duplex oligonucleotides formed by preincubation of a LO (12) with its reverse-complement oligonucleotide (13) (Figure 4).
Figure 4.
Cellular incorporation of LOs depends on charge but not sequence. LOs (10 μM, n = 3) of varying length and sequence were incubated with HeLa cells. (○) LOs 5, 6, 1, and 4 contained poly(2′-deoxyadenylic acid) sequences of 10, 15, 20, and 37 nucleotides, respectively. (□) LOs 7 and 8 contained random sequences of 24 and 37 nucleotides, respectively. (■) LO 12 was co-incubated with oligonucleotide 13 to give a duplex with 48 phosphoryl groups. Error bars: ±SD.
We also sought to determine whether the hydrophobic effect11 drives LO-incorporation into the plasma membrane. We found that LO-incorporation correlates strongly with lipid length: no lipid < C12 < C18 << C26 (Figure S4). Moreover, an LO (11) containing a long lipid tail (C26) still displays characteristic re-equilibration aftermedium replacement (Figure S5).
Cellular Attributes that Affect Incorporation
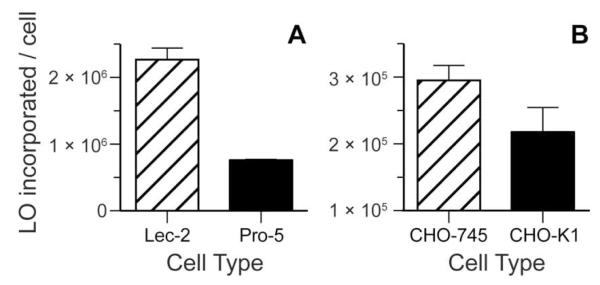
The major anionic components of the glycocalyx are sialic acid and GAGs. To assess their effect on LO-incorporation into cellular membranes, we used mutant cell lines deficient in sialic acid and GAG expression (Figure 5). Lec-2 cells are Pro-5 CHO cells with a mutation in the gene encoding a sialyltransferase, the transporter of CMP–sialic acid from the cytosol to Golgi vesicle.12 These cells have diminished sialic acid in their glycans. As shown in Figure 5A, sialic acid hinders LO-incorporation into cells.13 Like-wise, CHO-745 cells have lowered expression of heparan sulfate and chondroitin sulfate due to a mutation in xylosyltransferase, the enzyme that initiates the biosynthesis of these GAGs.14,15 As shown in Figure 5B, these GAGs diminish LO-incorporation.13
Figure 5.
Cellular incorporation of LOs is deterred by cell-surface sialic acid and GAGs. (A) LO 4 (10 μM, n = 3) was incubated with CHO cells deficient in sialic acid (Lec-2) and wild-type cells (Pro-5). (B) LO 3 (10 μM, n = 3) was incubated with CHO cells deficient in heparan sulfate and chondroitin sulfate (CHO-745) and wild-type cells (CHO-K1). Error bars: ±SD. Student’s t-test gave two-tailed p-values of 0.0001 and 0.0371 for panels A and B, respectively.
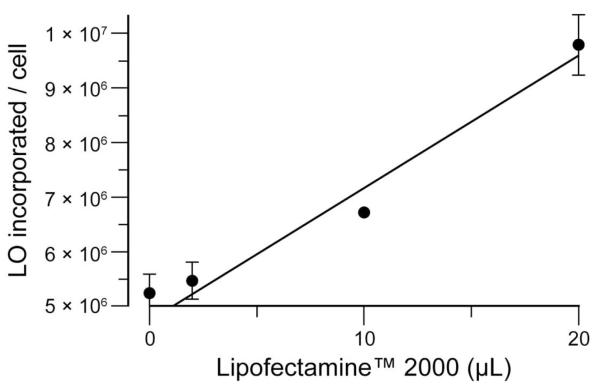
To validate that the anionic glycocalyx repels LOs from the cell surface, we used a chemical approach. Specifically, we reduced the net anionic charge of the glycocalyx by preincubating HeLa cells with varying amounts of Lipofectamine™ 2000, and then observed LO-incorporation (Figure 6). We observed a direct correlation between the amounts of Lipofectamine™ 2000 pre-incubated with the cells and LO-incorporation.13 The results of this chemical experiment, in addition to those from the genetic experiment, led us to conclude that the anionic components of the glycocalyx deter nucleic acids from mammalian cells.
Figure 6.
Cellular incorporation of LOs is facilitated by increasing the cationicity of the glycocalyx. HeLa cells were incubated with various volumes of Lipofectamine™ 2000, a highly cationic lipid. Then, the cells were washed with PBS and incubated with LO 4 (● 10 μM, n = 3). Error bars: ±SD.
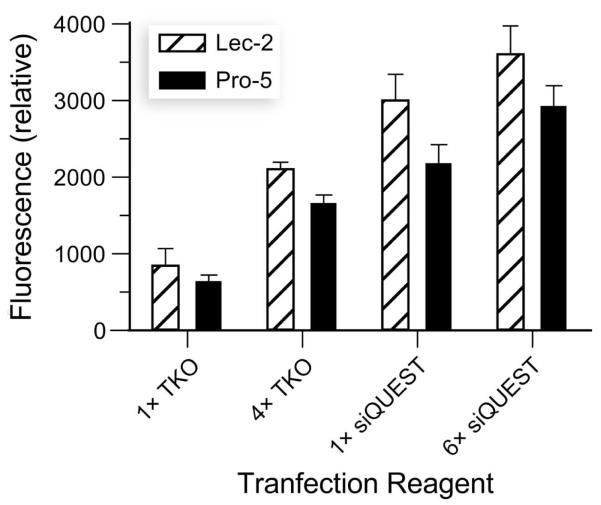
Finally, we were aware that cell-surface GAGs are known to diminish the efficiency of transfection.15 To complete our analysis, we investigated the effect of sialic acid on the efficiency of siRNA delivery. Even though these experiments were performed in the presence of a transfection reagent that masks deleterious Coulombic interactions, we found that sialic acid, like GAGs (Figure 5), diminishes the efficiency of transfection (Figure 7).13
Figure 7.
Sialic acid hinders siRNA delivery. Delivery of fluorescently labeled siRNA was assessed with CHO cells deficient in sialic acid (Lec-2) and wild-type cells (Pro-5) using the TransIT-TKO and TransIT-siQUEST transfection reagents, each tested in triplicate at two concentrations. Error bars: ±SD.
DISCUSSION
Many important biomolecules contain phosphoryl groups, which are hydrophilic and anionic.16 The plasma membrane of mammalian cells presents two potential barriers to the entry of such groups: a bilayer of lipids and anionic glycans (Figure 1). Our data indicate that the anionic glycocalyx repels the phosphoryl groups of nucleic acids.
The “double barrier” encountered by extracellular DNA and RNA could serve to facilitate the evolution and maintenance of stable genomes. Conversely, organisms that do not express anionic components of the glycocalyx could have more vulnerable genomes and should be more susceptible to gene knockdown by RNAi. Interestingly, Caenorhabditis elegans nematodes do not express the enzymes necessary for sialic acid production. They also do not express keratan sulfate, dermatan sulfate, or hyaluronan, and they lack the sulfotransferases and epimerases necessary to add sulfuryl groups to chondroitin sulfate.5 Thus, the cells of C. elegans could have a substantially less anionic glycocalyx than those of mammals. C. elegans is the prototypical organism for gene knockdown by RNAi.17 This capability has been attributed to its SID-1 protein, which shuttles siRNA across cellular membranes.18 We propose that C. elegans is especially susceptible to RNAi because of diminished Coulombic repulsion between its glycocalyx and RNA, enabling RNA to diffuse more readily to the SID-1 transporter.
Most species, including mice and humans, have orthologs to SID-1.19 Yet, systemic knockdown of gene expression by RNAi is facile only in C. elegans, flatworms, and a few insect species.17,20 The human SID-1 homologue SIDT1 is expressed in most tissues.21 When overproduced in pancreatic ductal adenocarcinoma-cells, SIDT1 delivers siRNA into cells more efficiently than do transfection reagents.22 Additionally, SIDT1 has been demonstrated to be essential for siRNA delivery into human primary hepatocytes in vitro.23 To access SIDT1, siRNA must diffuse through the anionic glycocalyx. Our data suggest that a small-molecule inhibitor of sialic acid biosynthesis could enable siRNA to reach SIDT1 more efficiently.
Conclusions
We have provided a detailed analysis of the interaction of a nucleic acid with the canopy of mammalian cells— the glycocalyx. We demonstrated that the anionic charge associated with a nucleic acid correlates inversely with its affinity for the glycocalyx. Additionally, we established that reduction of the anionic charge on the cell surface (genetically with the Lec-2 and CHO-745 cell lines, or chemically upon addition of Lipofectamine™ 2000) enhances LO incorporation into cellular membranes, providing direct evidence that the anionic glycocalyx repels nucleic acids. We propose that an evolutionary imperative of the anionic glycocalyx is to ensure genomic stability by deterring the approach of exogenous nucleic acids while retaining endogenous ones. Finally, we encourage a search for small-molecule inhibitors of sialic-acid biosynthesis, which could enhance the efficiency of the cellular delivery of nucleic acids.
Supplementary Material
ACKNOWLEDGMENTS
We are grateful to S. Kennedy, N. Burton, B. R. Caes, and A. Choudhary for contributive discussions. M.J.P. was supported by Molecular and Cellular Pharmacology Training Grant T32 GM008688 (NIH) and predoctoral fellowship 09PRE2260125 (American Heart Association). This work was supported by Grants R01 CA073808 and R01 GM044783 (NIH).
Footnotes
Supporting Information. Figures S1–S5 and NMR spectra. This material is available free of charge via the Internet at http://pubs.acs.org.
REFERENCES
- (1)(a).Wolff JA. Nat. Biotechnol. 2002;20:768–769. doi: 10.1038/nbt0802-768. [DOI] [PubMed] [Google Scholar]; (b) Patil SD, Rhodes DG, Burgess DJ. AAPS J. 2005;7:E61–E77. doi: 10.1208/aapsj070109. [DOI] [PMC free article] [PubMed] [Google Scholar]
- (2)(a).Fire AZ. Angew. Chem. Int. Ed. 2007;46:6966–6984. doi: 10.1002/anie.200701979. [DOI] [PubMed] [Google Scholar]; (b) Mello CC. Angew. Chem. Int. Ed. 2007;46:6985–6994. doi: 10.1002/anie.200701713. [DOI] [PMC free article] [PubMed] [Google Scholar]
- (3)(a).Lares MR, Rossi JJ, Ouellet DL. Trends Biotechnol. 2010;28:570–579. doi: 10.1016/j.tibtech.2010.07.009. [DOI] [PMC free article] [PubMed] [Google Scholar]; (b) Shim MS, Kwon YJ. FEBS J. 2010;277:4814–4827. doi: 10.1111/j.1742-4658.2010.07904.x. [DOI] [PubMed] [Google Scholar]; (c) Pecot CV, Calin GA, Coleman RL, Lopez-Berestein G, Sood AK. Nat. Rev. Cancer. 2011;11:59–67. doi: 10.1038/nrc2966. [DOI] [PMC free article] [PubMed] [Google Scholar]
- (4)(a).Loke SL, Stein CA, Zhang XH, Mori K, Nakanishi M, Subasinghe C, Cohen JS, Neckers LM. Proc. Natl. Acad. Sci. USA. 1989;86:3474–3478. doi: 10.1073/pnas.86.10.3474. [DOI] [PMC free article] [PubMed] [Google Scholar]; (b) Hawley P, Gibson I. Antisense Nucleic Acid Drug Dev. 1996;6:185–195. doi: 10.1089/oli.1.1996.6.185. [DOI] [PubMed] [Google Scholar]; (c) Beck GF, Irwin WJ, Nicklin PL, Akhtar S. Pharm. Res. 1996;13:1028–1037. doi: 10.1023/a:1016002606705. [DOI] [PubMed] [Google Scholar]; (d) Stein CA. Antisense Nucleic Acid Drug Dev. 1997;7:207–209. doi: 10.1089/oli.1.1997.7.207. [DOI] [PubMed] [Google Scholar]; (e) Takagi T, Hashiguchi M, Mahato RI, Tokuda H, Takakura Y, Hashida M. Biochem. Biophys. Res. Commun. 1998;245:729–733. doi: 10.1006/bbrc.1998.8521. [DOI] [PubMed] [Google Scholar]; (f) McCoy SL, Hausman FA, Deffebach ME, Bakke A, Merkens LS, Bennett RM, Hefeneider SH. J. Immunol. Methods. 2000;241:141–146. doi: 10.1016/s0022-1759(00)00205-2. [DOI] [PubMed] [Google Scholar]
- (5).Varki A, Cummings RD, Esko JD, Freeze HH, Stanley P, Bertozzi CR, Hart GW, editors. Essentials of Glycobiology. 2nd ed. Cold Spring Harbor Laboratory Press; Cold Spring Harbor, NY: 2009. [PubMed] [Google Scholar]
- (6)(a).Coulomb CA. Collection de Mémoires Relatifs a la Physique. Gauthier–Villars; Paris: 1884. [Google Scholar]; (b) Gillmor CS. Coulomb and the Evolution of Physics and Engineering in Eighteenth-Century France. Princeton University Press; Princeton, NJ: 1971. [Google Scholar]
- (7)(a).Schultz C. Bioorg. Med. Chem. 2003;11:885–898. doi: 10.1016/s0968-0896(02)00552-7. [DOI] [PubMed] [Google Scholar]; (b) Wolff JA, Rozema DB. Mol. Ther. 2007;16:8–15. doi: 10.1038/sj.mt.6300326. [DOI] [PubMed] [Google Scholar]; (c) Fuchs SM, Raines RT. ACS Chem. Biol. 2007;2:167–170. doi: 10.1021/cb600429k. [DOI] [PMC free article] [PubMed] [Google Scholar]; (d) Fuchs SM, Rutkoski TJ, Kung VM, Groeschl RT, Raines RT. Protein Eng. Des. Select. 2007;20:505–509. doi: 10.1093/protein/gzm051. [DOI] [PubMed] [Google Scholar]; (e) Johnson RJ, Chao T-Y, Lavis LD, Raines RT. Biochemistry. 2007;46:10308–10316. doi: 10.1021/bi700857u. [DOI] [PMC free article] [PubMed] [Google Scholar]; (f) Eguchi A, Dowdy SF. Trends Pharmacol. Sci. 2009;30:341–345. doi: 10.1016/j.tips.2009.04.009. [DOI] [PubMed] [Google Scholar]; (g) McNaughton BR, Cronican JJ, Thompson DB, Liu DR. Proc. Natl. Acad. Sci. USA. 2009;106:6111–6116. doi: 10.1073/pnas.0807883106. [DOI] [PMC free article] [PubMed] [Google Scholar]; (h) Cronican JJ, Thompson DB, Beier KT, McNaughton BR, Cepko CL, Liu DR. ACS Chem. Biol. 2010;5:747–752. doi: 10.1021/cb1001153. [DOI] [PMC free article] [PubMed] [Google Scholar]
- (8).Felgner PL, Gadek TR, Holm M, Roman R, Chan HW, Wenz M, Northrop JP, Ringold GM, Danielsen M. Proc. Natl. Acad. Sci. USA. 1987;84:7413–7417. doi: 10.1073/pnas.84.21.7413. [DOI] [PMC free article] [PubMed] [Google Scholar]
- (9)(a).Chandra RA, Douglas ES, Mathies RA, Bertozzi CR, Francis MB. Angew. Chem. Int. Ed. 2006;45:896–901. doi: 10.1002/anie.200502421. [DOI] [PubMed] [Google Scholar]; (b) Hsiao SC, Crow AK, Lam WA, Bertozzi CR, Fletcher DA, Francis MB. Angew. Chem. Int. Ed. 2008;47:8473–8477. doi: 10.1002/anie.200802525. [DOI] [PMC free article] [PubMed] [Google Scholar]; (c) Borisenko GG, Zaitseva MA, Chuvilin AN, Pozmogova GE. Nucleic Acids Res. 2009;37:e28. doi: 10.1093/nar/gkn1034. [DOI] [PMC free article] [PubMed] [Google Scholar]; (d) Liu HP, Zhu Z, Kang HZ, Wu YR, Sefan K, Tan WH. Chem.—Eur. J. 2010;16:3791–3797. doi: 10.1002/chem.200901546. [DOI] [PMC free article] [PubMed] [Google Scholar]; (e) Patwa A, Gissot A, Bestel I, Barthélémy P. Chem. Soc. Rev. 2011;40:5844–5854. doi: 10.1039/c1cs15038c. [DOI] [PubMed] [Google Scholar]; (f) Selden NS, Todhunter ME, Jee NY, Liu JS, Broaders KE, Gartner ZJ. J. Am. Chem. Soc. 2012;134:765–768. doi: 10.1021/ja2080949. [DOI] [PMC free article] [PubMed] [Google Scholar]
- (10)(a).Chan YH, van Lengerich B, Boxer SG. Biointerphases. 2008;3:FA17. doi: 10.1116/1.2889062. [DOI] [PubMed] [Google Scholar]; (b) Chan YH, van Lengerich B, Boxer SG. Proc. Natl. Acad. Sci. USA. 2009;106:979–984. doi: 10.1073/pnas.0812356106. [DOI] [PMC free article] [PubMed] [Google Scholar]
- (11)(a).Kauzmann W. Adv. Protein Chem. 1959;14:1–63. doi: 10.1016/s0065-3233(08)60608-7. [DOI] [PubMed] [Google Scholar]; (b) Tanford C. The Hydrophobic Effect: Formation of Micelles and Biological Membranes. John Wiley & Sons; New York: 1973. [Google Scholar]
- (12).Deutscher SL, Nuwayhid N, Stanley P, Briles EI, Hirschberg CB. Cell. 1984;39:295–299. doi: 10.1016/0092-8674(84)90007-2. [DOI] [PubMed] [Google Scholar]
- (13).A significant change was observed, even though these experiments were conducted in cell-culture medium that has a high ionic strength.
- (14)(a).Esko JD, Stewart TE, Taylor WH. Proc. Natl. Acad. Sci. USA. 1985;82:3197–3201. doi: 10.1073/pnas.82.10.3197. [DOI] [PMC free article] [PubMed] [Google Scholar]; (b) Esko JD, Weinke JL, Taylor WH, Ekborg G, Roden L, Anantharamaiah G, Gawish A. J. Biol. Chem. 1987;262:12189–12195. [PubMed] [Google Scholar]; (c) Chao T-Y, Lavis LD, Raines RT. Biochemistry. 2010;49:10666–10673. doi: 10.1021/bi1013485. [DOI] [PMC free article] [PubMed] [Google Scholar]
- (15).Ruponen M, Honkakoski P, Tammi M, Urtti A. J. Gene Med. 2004;6:405–14. doi: 10.1002/jgm.522. [DOI] [PubMed] [Google Scholar]
- (16).Westheimer FH. Science. 1987;235:1173–1178. doi: 10.1126/science.2434996. [DOI] [PubMed] [Google Scholar]
- (17).Timmons L, Fire A. Nature. 1998;395:854. doi: 10.1038/27579. [DOI] [PubMed] [Google Scholar]
- (18)(a).Winston WM, Molodowitch C, Hunter CP. Science. 2002;295:2456–2459. doi: 10.1126/science.1068836. [DOI] [PubMed] [Google Scholar]; (b) May RC, Plasterk RH. Methods Enzymol. 2005;392:308–315. doi: 10.1016/S0076-6879(04)92018-6. [DOI] [PubMed] [Google Scholar]; (c) Grishok A. FEBS Lett. 2005;579:5932–5939. doi: 10.1016/j.febslet.2005.08.001. [DOI] [PubMed] [Google Scholar]; (d) Shih JD, Fitzgerald MC, Sutherlin M, Hunter CP. RNA. 2009;15:384–390. doi: 10.1261/rna.1286409. [DOI] [PMC free article] [PubMed] [Google Scholar]
- (19).Li H, Coghlan A, Ruan J, Coin LJ, Heriche JK, Osmotherly L, Li R, Liu T, Zhang Z, Bolund L, Wong GK, Zheng W, Dehal P, Wang J, Durbin R. Nucleic Acids Res. 2006;34:D572–D580. doi: 10.1093/nar/gkj118. [DOI] [PMC free article] [PubMed] [Google Scholar]
- (20)(a).Alvarado A. Sanchez, Newmark PA. Proc. Natl. Acad. Sci. USA. 1999;96:5049–5054. doi: 10.1073/pnas.96.9.5049. [DOI] [PMC free article] [PubMed] [Google Scholar]; (b) Bucher G, Scholten J, Klingler M. Curr. Biol. 2002;12:R85–R86. doi: 10.1016/s0960-9822(02)00666-8. [DOI] [PubMed] [Google Scholar]; (c) Amdam GV, Simoes ZL, Guidugli KR, Norberg K, Omholt SW. BMC Biotechnol. 2003;3:1. doi: 10.1186/1472-6750-3-1. [DOI] [PMC free article] [PubMed] [Google Scholar]; (d) Dong Y, Friedrich M. BMC Biotechnol. 2005;5:25. doi: 10.1186/1472-6750-5-25. [DOI] [PMC free article] [PubMed] [Google Scholar]
- (21).Su AI, Wiltshire T, Batalov S, Lapp H, Ching KA, Block D, Zhang J, Soden R, Hayakawa M, Kreiman G, Cooke MP, Walker JR, Hogenesch JB. Proc. Natl. Acad. Sci. USA. 2004;101:6062–6067. doi: 10.1073/pnas.0400782101. [DOI] [PMC free article] [PubMed] [Google Scholar]
- (22).Duxbury MS, Ashley SW, Whang EE. Biochem. Biophys. Res. Commun. 2005;331:459–463. doi: 10.1016/j.bbrc.2005.03.199. [DOI] [PubMed] [Google Scholar]
- (23).Wolfrum C, Shi S, Jayaprakash KN, Jayaraman M, Wang G, Pandey RK, Rajeev KG, Nakayama T, Charrise K, Ndungo EM, Zimmermann T, Koteliansky V, Manoharan M, Stoffel M. Nat. Biotechnol. 2007;25:1149–1157. doi: 10.1038/nbt1339. [DOI] [PubMed] [Google Scholar]
Associated Data
This section collects any data citations, data availability statements, or supplementary materials included in this article.


