Abstract
This study was designed to determine whether the 24-h rhythms of clock gene expression and vascular smooth muscle (VSM) contractile responses are altered in type 2 diabetic db/db mice. Control and db/db mice were euthanized at 6-h intervals throughout the day. The aorta, mesenteric arteries, heart, kidney, and brain were isolated. Clock and target gene mRNA levels were determined by either real-time PCR or in situ hybridization. Isometric contractions were measured in isolated aortic helical strips, and pressor responses to an intravenous injection of vasoconstrictors were determined in vivo using radiotelemetry. We found that the 24-h mRNA rhythms of the following genes were suppressed in db/db mice compared with control mice: the clock genes period homolog 1/2 (Per1/2) and cryptochrome 1/2 (Cry1/2) and their target genes D site albumin promoter-binding protein (Dbp) and peroxisome proliferator-activated receptor-γ (Pparg) in the aorta and mesenteric arteries; Dbp in the heart; Per1, nuclear receptor subfamily 1, group D, member 1 (Rev-erba), and Dbp in the kidney; and Per1 in the suprachiasmatic nucleus. The 24-h contractile variations in response to phenylephrine (α1-agonist), ANG II, and high K+ were significantly altered in the aortas from db/db mice compared with control mice. The diurnal variations of the in vivo pressor responses to phenylephrine and ANG II were lost in db/db mice. Moreover, the 24-h mRNA rhythms of the contraction-related proteins Rho kinase 1/2, PKC-potentiated phosphatase inhibitory protein of 17 kDa, calponin-3, tropomyosin-1/2, and smooth muscle protein 22-α were suppressed in db/db mice compared with control mice. Together, our data demonstrated that the 24-h rhythms of clock gene mRNA, mRNA levels of several contraction-related proteins, and VSM contraction were disrupted in db/db mice, which may contribute to the disruption of their blood pressure circadian rhythm.
Keywords: circadian rhythms, thin filament-binding proteins, blood pressure, aorta
a significantly higher proportion of human diabetic patients than normal individuals have disrupted blood pressure circadian rhythm with a reduced nocturnal blood pressure dip (25). Such blood pressure nondipping, independent from the average blood pressure value itself, is associated with increased vascular complications and worsened cardiovascular outcomes in diabetic patients (28, 41). However, the molecular mechanisms that link diabetes to the disruption of blood pressure circadian rhythm are largely unknown, although autonomic neuropathy (4), impaired kidney function (9), and angiotensin-converting enzyme polymorphism (6) have been proposed or shown to correlate with blood pressure nondipping. Recent evidence has implicated an important role for clock genes in physiological blood pressure circadian rhythm regulation (33), but their role in diabetes-associated blood pressure circadian rhythm disruption has been largely unexplored.
A hierarchy of interacting, tissue-based clocks control circadian physiology and behavior (40). The mammalian circadian clock is composed of at least 10 core circadian clock proteins. The core of the circadian clock mechanism are the transcription factors circadian locomotor output cycles kaput (CLOCK) and brain and muscle aryl hydrocarbon receptor nuclear translocator-like protein (BMAL1; also named Mop3 and ARNTL). Upon heterodimerization, CLOCK and BMAL1 bind to E boxes in the promoters of various target genes, including those encoding for negative [e.g., period homolog 1 (Per1), Per2, cryptochrome 1 (Cry1), and Cry2] or positive (e.g., Bmal1) loop components, as well as target genes, including D site albumin promotor-binding protein (Dbp), nuclear receptor subfamily 1, group D, member 1 (Rev-erb), and peroxisome proliferator-activated receptor-γ (Pparg). It has long been known that clock genes are expressed rhythmically in the suprachiasmatic nucleus (SCN) of the hypothalamus, the master circadian pacemaker in mammals, which is critical for regulating various circadian rhythms. Recently, it has become clear that clock genes are also expressed and function in various peripheral tissues (44). In particular, clock genes exhibit circadian expression patterns in organs that play critical roles in blood pressure homeostasis, including the vasculature [specifically, the mouse aorta (34)], heart (35, 48–49), and kidney (35, 48). However, it is unknown whether clock gene expression levels and diurnal oscillations are altered in these organs in type 2 diabetic db/db mice. In addition, it is unknown whether clock genes are also expressed and exhibit diurnal oscillation in small arteries/resistance arterioles, such as those in the mesentery artery bed, that are directly relevant to blood pressure regulation.
Vascular smooth muscle (VSM) is a major component of the vessel wall, and its contractile state is primarily responsible for maintaining normal vascular tone and blood pressure. Interestingly, the contractile responses of VSM to various stimuli have been demonstrated to exhibit time of day variations under normal physiological conditions (1, 10, 13, 22, 45). However, it is unknown whether such time of day variation in the VSM contractile response is altered in diabetes.
The db/db mouse is an extensively used monogenic type 2 diabetes model. An inactivating mutation in the leptin receptor leads to obesity, insulin resistance, and marked hyperglycemia in db/db mice (3, 5). We first reported that the db/db mouse manifests severely disrupted blood pressure circadian rhythm (39), which was soon confirmed by independent groups (11, 30, 36). While dysfunctions in multiple systems are likely involved in the disruption of blood pressure circadian rhythm in db/db mice, the present study focused on clock gene expression and time of day variations of VSM contraction. Our results demonstrate that the daily variations of both clock gene expression and contraction are altered in db/db mice.
MATERIALS AND METHODS
Animals and reagents.
All experiments were performed using 9- to 10-wk-old male diabetic db/db (−/−) or age/sex-matched nondiabetic (+/−) C57BL/KsJ control mice (The Jackson Laboratories, Bar Harbor, ME). All animal protocols were approved by the Institutional Animal Care and Use Committee. Mice were fed a standard diet (Teklad Global 18% Protein Rodent Diet, catalog no. 2918, Harlan Laboratories) and reverse osmosis ultra-filtered water ad libitum under a 12:12-h light-dark cycle. Nonfasting blood glucose levels were determined using a One Touch Ultra Blood Glucose Meter with a glucose test strip (LifeScan, Milpitas, CA). Other chemicals and reagents were purchased from Sigma (St. Louis, MO) or Fisher (Pittsburgh, PA).
Real-time PCR determination of clock gene mRNA.
Twenty pairs of db/db and control mice were euthanized at Zeitgeber time (ZT)5, 11, 17, and 23, respectively (ZT0: lights on and ZT12: lights off). The aorta and mesenteric artery bed were removed immediately and placed in RNAlater solution. The mesentery artery bed contains the entire mesenteric artery tree from the superior mesentery artery just branched out from abdominal aorta to the fourth-order branches just before entering the intestinal wall. After careful removal of the surrounding fat and connective tissues under a stereomicroscope, RNA was extracted using an RNeasy mini-kit (Qiagen, Valencia, CA). The RNA extraction, cDNA synthesis, and real-time PCR were carried out as previously described (14, 46). The PCR primers used have been demonstrated to be specific for each of the genes and are shown in Table 1. The mRNA of each gene was normalized to 36b4 mRNA and quantified by standard curve analysis.
Table 1.
Real-time PCR primer information
| Primer Sequence |
||||
|---|---|---|---|---|
| Gene | Abbreviation | Accession Number | Forward | Reverse |
| Clock genes | ||||
| Circadian locomotor output cycles kaput | CLOCK | NM_007715 | 5′-TTTACAGGCGTTGTTGATTGGA-3′ | 5′-ACGCAAGGCCGTCTTCTG-3′ |
| Brain and muscle aryl hydrocarbon receptor nuclear translocator-like protein 1 | BMAL1 | NM_007489 | 5′-CACTGTCCCAGGCATTCCA-3′ | 5′-TTCCTCCGCGATCATTCG-3′ |
| Period homolog 1 | Per1 | NM_011065 | 5′-TCGAAACCAGGACACCTTCTCT-3′ | 5′-GGGCACCCCGAAACACA-3′ |
| Period homolog 2 | Per2 | NM_011066 | 5′-GCTCGCCATCCACAAGAAG-3′ | 5′-GCGGAATCGAATGGGAGAATA-3′ |
| Cryptochrome 1 | Cry1 | NM_007771 | 5′-TCGCCGGCTCTTCCAA-3′ | 5′-TCAAGACACTGAAGCAAAAATCG-3′ |
| Cryptochrome 2 | Cry2 | NM_009963 | 5′-CCTCGTCTGTGGGCATCAA-3′ | 5′-GCTTTCTTAAGCTTGTGTCCAGATC-3′ |
| Target genes | ||||
| Nuclear receptor subfamily 1, group D, member 1 | Rev-erb-α | NM_145434 | 5′-CCCTGGACTCCAATAACAACACA-3′ | 5′-GCCATTGGAGCTGTCACTGTAG-3′ |
| D site albumin promoter-binding protein | DBP | NM_016974 | 5′-ACCGTGGAGGTGCTAATG-3′ | 5′-ATGGCCTGGAATGCTTGA-3′ |
| Peroxisome proliferator-activated receptor-γ | PPARγ | NM_011146 | 5′-GAGAAGCTGTTGGCGGAGAT-3′ | 5′-GCTCGCAGATCAGCAGACTCT-3′ |
| Contraction-related genes | ||||
| Calponin-1 | NM_009922 | 5′-AGCTGCAGCCGGGTTCT-3′ | 5′-TTCTCCAGCTGGTGCCAGTT-3′ | |
| Calponin-2 | NM_007725 | 5′-GCTCCCCCACTGCATCAG-3′ | 5′-TCCAAACACAAAACACAATGAAAAC-3′ | |
| Calponin-3 | NM_028044 | 5′-AGGCAGAATACCCCGATGAA-3′ | 5′-GGTCGTCGCCATACTGGTACTC-3′ | |
| Smooth muscle protein 22-α | SM22α | NM_011526 | 5′-ACCGTGGAGATCCCAACTGGTTTA-3′ | 5′-CATTTGAAGGCCAATGACGTGCT-3′ |
| Tropomyosin 1 (α) | NM_024427 | 5′-GAAGCCTCATGAGAACAGAACCA-3′ | 5′-CTTCCTGCTGATCCCACCAT-3′ | |
| Tropomyosin 2 (β) | NM_009416 | 5′-AGGCCACCGACGCTGAA-3′ | 5′-CCTGTGCCCGATCCAACT-3′ | |
| Ca2+-independent phospholipase A2-β | iPLA2β | NM_001199023 | 5′-TCAGGATCTCATGCCCATCTCT-3′ | 5′-TGGTCGTGACTCCGCTTCTC-3′ |
| RhoA | NM_016802 | 5′-GTGCCCACGGTGTTTGAAA-3′ | 5′-CCATAAAGCCAACTCTACCTGCTT-3′ | |
| Rho kinase-1 | ROCK-1 | NM_009071 | 5′-TGCCCTGCGGCTACAAA-3′ | 5′-GCGGAAAGCAAGTTCAACCA-3′ |
| Rho kinase-2 | ROCK-2 | NM_009072 | 5′-GCGGAAGACTATGATGTTGTAAAAGT-3′ | 5′-CTTCTGTGATGCCTTATGACGAA-3′ |
| PKC-potentiated phosphatase inhibitory protein of 17 kDa | CPI-17 | NM_026731 | 5′-AGAAGTGGATCGACGGATGCT-3′ | 5′-GACCTCGTCCGGCATGTCT-3′ |
| Control gene | ||||
| Mus acidic ribosomal phosphoprotein P0 | NM_007475 | 5′-CCCTGAAGTGCTCGACATCA-3′ | 5′-TGCGGACACCCTCCAGAA-3′ | |
In situ hybridization determination of SCN Per1 expression.
Twelve pairs of db/db and control mice were euthanized at ZT11 and ZT23, and brains were carefully removed, frozen with powdered dry ice, and stored at −80°C. Sections (20 μm thick) through the SCN were cut with a cryostat, mounted onto negatively charged slides, and stored at −80°C until processed by in situ hybridization as previously described (7). Antisense RNA probes for Per1 were made from the linearized hamster cDNA clone in pBluescript (KS-) (Stratagene, La Jolla, CA). Slide-mounted tissue sections were fixed in paraformaldehyde-phosphate buffer, acetylated, dehydrated, delipidated, and air dried. Sections were then hybridized with a saturating concentration of [35S]UTP-labeled riboprobes in a humid chamber at 55°C for 18 h. After hybridization, sections were treated with RNAse A and incubated at 63°C in dilute SSC. Sections were then rinsed, quickly dehydrated, and air dried. Autoradiograms were generated by apposing the sections to X-ray film (Kodak Biomax-MR). To ascertain that the autoradiographic images did not represent film saturation, radioactive standards ([14C]microscales, Amersham, Piscataway, NJ) were included in each cassette. The autoradiographic images were captured with a charge-coupled device video camera interfaced with a computer running imaging software (M4: Imaging). The signal in each SCN was determined by comparing the optical density of the sampling area to a standard curve created by the imaging software from the optical densities generated by the radioactive standards.
Isometric tension measurements.
Abdominal aortas were removed from 40 pairs of db/db and control mice euthanized at ZT5, ZT11, ZT17, and ZT23. Aortas were dissected free from connective tissues and cut into small spiral strips (∼3 mm in length and 1.6 mm in width). The endothelium was denuded by gentle scrapes with a razor blade, and successful denudation was verified by the loss of maximal-dose ACh (1 μM)-induced relaxation. Isometric contractions were determined using a “bubble chamber” as previously described (12, 18). The total time from vessel excision to completion of the contraction experiment was ∼5–6 h.
Blood pressure measurement with radiotelemetry.
Eight pairs of db/db and control mice were chronically instrumented in the left common carotid artery with a telemetry probe as previously described (39). After 10 days of recovery from the surgery, basal blood pressure data were collected for 3 consecutive days under conscious free-moving conditions. At ∼11–12 wk of age, mice were anesthetized either at ZT5 or ZT17, and basal blood pressure data were collected for 10 min. Various doses of phenylephrine or ANG II were then injected in a random order via the femoral vein in a volume of <20 μl. There were 5- to 10-min intervals between each injection, which allowed the blood pressure to mostly return to the prior injection level. The maximal blood pressure reached after each injection was taken for the quantification of the blood pressure response.
Statistical analysis.
All data are expressed as means ± SE. For the comparison of body weight and blood glucose levels between db/db and control mice, statistical analysis was performed using a Student's t-test. For the comparison of mRNA levels and contraction between db/db and control mice across various ZT time points, statistical analysis was performed with two-way ANOVA, and a post hoc Bonferroni analysis was carried out when appropriate. Differences were considered significant at P values of <0.05.
RESULTS
General characterization of db/db and C57BL/KsJ mice.
A total of 46 pairs of 9- to 10-wk old male db/db and control (db/−) mice were used for the study. Body weights (26.5 ± 0.29 g in control mice vs. 41.5 ± 0.51 g in db/db mice, P < 0.0001) and nonfasting blood glucose levels (164.6 ± 3.53 mg/dl in control mice vs. 475.6 ± 14.6 mg/dl in db/db mice, P < 0.0001) were significantly higher in db/db mice compared with control mice. The 24-h mean arterial pressure in conscience free-moving mice was 115.1 ± 1.01 mmHg in control mice and 122.4 ± 0.91 mmHg in db/db mice (n = 10 each, P < 0.0001).
Altered mRNA expressions of clock and target genes in the db/db mouse aorta, mesenteric arteries, heart, kidney, and SCN.
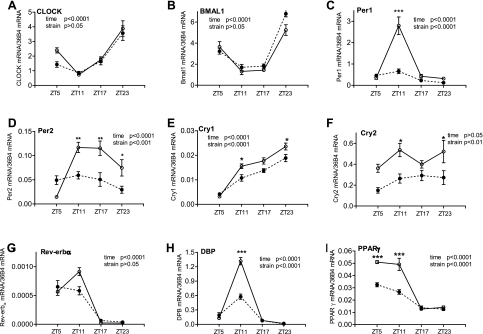
To investigate whether the 24-h profile of clock gene expression is altered in peripheral tissues and the SCN under diabetic conditions, we determined and compared the mRNA levels of multiple clock and target genes at four ZTs in the db/db and control mouse aorta, mesenteric arteries, heart, kidney, and SCN. ZT is a standardized 24-h notation of the phase in an entrained circadian cycle in which ZT0 indicates the beginning of the day, or the light phase, and ZT12 is the beginning of the night, or the dark phase. As shown in Fig. 1, in the control mouse aorta, most of the genes investigated exhibited time of day-dependent variations at the expression level. In db/db mice, the mRNA level or the diurnal oscillations of these genes were altered or unchanged depending on the specific gene. For Clock and Bmal1, neither the diurnal oscillations nor the expression levels exhibited significant differences between db/db and control mice (Fig. 1, A and B). For Per1 and Per2, the diurnal oscillations across the four ZT points were abolished in the db/db mouse aorta (Fig. 1, C and D). In particular, the expression levels were significantly suppressed at ZT11 (Per1 and Per2) and at ZT17 and ZT23 (Per2). For Cry1 and Cry2, the expression levels were significantly suppressed at ZT11 and ZT23 in the db/db mouse aorta compared with the control mouse aorta (Fig. 1, E and F), but the diurnal oscillations of Cry1 seemed to be retained in db/db mice.
Fig. 1.
Daily mRNA expression profiles of clock and target genes in aortas isolated from diabetic db/db mice and control mice. Male 9- to 10-wk-old db/db mice (● and dotted lines) and control mice (○ and solid lines) were euthanized at Zeitgeber time (ZT)5, ZT11, ZT17, and ZT23. Aortas were harvested and cleaned, and mRNAs were quantified using real-time PCR. A: circadian locomotor output cycles kaput (CLOCK). B: brain and muscle aryl hydrocarbon receptor nuclear translocator-like protein 1 (BMAL1). C: period homolog 1 (Per1). D: Per2. E: cryptochrome 1 (Cry1). F: Cry2. G: nuclear receptor subfamily 1, group D, member 1 (Rev-erb-α). H: D site albumin promoter-binding protein (DBP). I: peroxisome proliferator-activated receptor-γ (PPAR-γ). n = 5 for each mouse strain at each time point. *P < 0.05, **P < 0.01, and ***P < 0.001 when compared between db/db mice and control mice at the same time point in the post hoc analysis.
To further investigate the function of the core clock genes, we analyzed the mRNA expression of several clock target genes, including Dbp and Pparg. The results demonstrated that Dbp and Pparg expression levels were dramatically suppressed at ZT5 (Pparg) and at ZT11 (Dbp and Pparg) in the db/db mouse aorta compared with the control mouse aorta (Fig. 1, H and I). Consequently, the amplitudes of Dbp and Pparg diurnal oscillations were significantly suppressed (Fig. 1, H and I). For Rev-erba, the diurnal oscillation and expression level at ZT11 showed a trend of suppression, but the change did not reach statistical significance (Fig. 1G). Taken together, the expression levels and diurnal oscillations of clock and target genes exhibited gene specific alterations in the db/db mouse aorta.
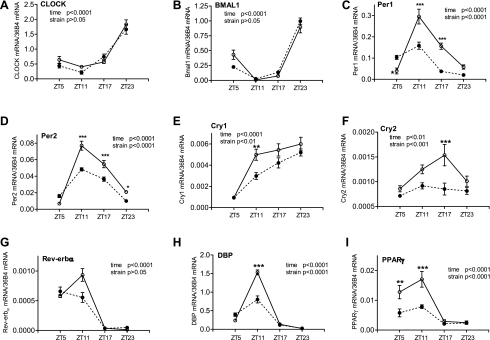
We then investigated the clock and target gene mRNA profiles in mesenteric arteries to determine whether they also exhibit diurnal oscillation and whether their expression level and diurnal oscillation are altered in diabetic db/db mice. The results demonstrated that, in control mice, the diurnal oscillation patterns of the clock and target genes were very similar to those of the aorta, although the relative expression levels differed in most of the genes investigated (Fig. 2). Moreover, the alterations in db/db mouse mesenteric arteries regarding diurnal oscillations and expression levels were very similar to those of the aorta (compare Fig. 2 with Fig. 1).
Fig. 2.
Daily mRNA expression profiles of clock and target genes in mesentery arteries isolated from diabetic db/db mice and control mice. Male 9- to 10-wk-old db/db mice (● and dotted lines) and control mice (○ and solid lines) were euthanized at ZT5, ZT11, ZT17, and ZT23. Mesenteric artery beds were harvested and cleaned free of fat, and mRNAs were quantified using real-time PCR. A: CLOCK. B: BMAL1. C: Per1. D: Per2. E: Cry1. F: Cry2. G: Rev-erb-α. H: DBP. I: PPAR-γ. n = 5 for each mouse strain at each time point. *P < 0.05, **P < 0.01, and ***P < 0.001 when compared between db/db mice and control mice at the same time point in the post hoc analysis.
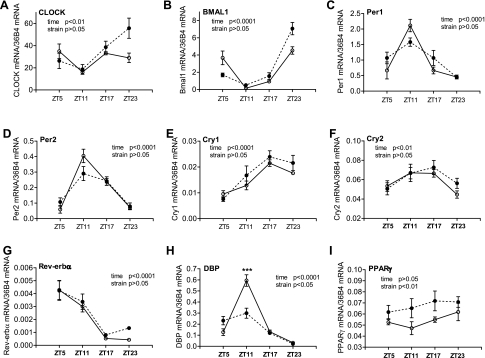
In the hearts of control mice, most of the clock and target genes excerpt for Pparg showed similar 24-h variations as observed in the aorta and mesenteric arteries (Fig. 3). However, distinct from the vasculature, no significant differences were detected between control and diabetic db/db mice in canonical clock genes, including Per1/2, Cry1/2, and Rev-erba (Fig. 3, A–G). The normal Dbp 24-h oscillation was significantly suppressed in db/db mice (Fig. 3H). Interestingly, no 24-h oscillation was detected in Pparg in the normal heart, but its expression levels were increased in db/db mice in all four time points investigated (Fig. 3I).
Fig. 3.
Daily mRNA expression profiles of clock and target genes in hearts isolated from diabetic db/db mice and control mice. Hearts were isolated from 9- to 10-wk-old male db/db mice (● and dashed lines) and control mice (○ and solid lines), and the mRNAs of specific genes were quantified using real-time PCR. A: CLOCK. B: BMAL1. C: Per1. D: Per2. E: Cry1. F: Cry2. G: Rev-erb-α. H: DBP. I: PPAR-γ. ***P < 0.001 when compared between db/db mice and control mice at the same time point in the post hoc analysis.
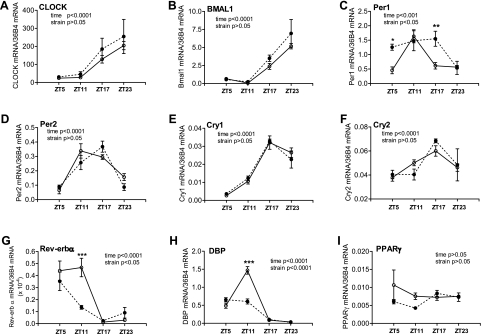
In kidneys from control mice, clock and target genes except for Pparg showed 24-h oscillation similar those of the vasculature and heart (Fig. 4). In the db/db mouse kidney, two of the canonical clock genes exhibited significant alterations: Per1 expression levels were significantly increased at ZT5 and ZT17, such that the peak of daily expression was expanded, compared with control mouse kidneys (Fig. 4C), whereas Rev-erba expression was significantly suppressed at ZT11, such that the daily peak of expression was curtailed compared with the control mouse kidney (Fig. 4G). No significant differences between control and db/db mice in Clock, Bmal1, Per2, Cry1, and Cry2 were observed (Fig. 4, A, B, and D–F). Dbp showed similar suppression in the db/db mouse kidney as in the aorta, mesenteric arteries, and heart (Fig. 4H). Pparg showed no significant 24-h oscillation in control mice, and no significant changes were detected in db/db mice (Fig. 4I).
Fig. 4.
Daily mRNA expression profiles of clock and target genes in kidneys isolated from diabetic db/db mice and control mice. Kidneys were isolated from 9- to 10-wk-old male db/db mice (● and dotted lines) and control mice (○ and solid lines), and the mRNAs of specific genes were quantified using real-time PCR. A: CLOCK. B: BMAL1. C: Per1. D: Per2. E: Cry1. F: Cry2. G: Rev-erb-α. H: DBP. I: PPAR-γ. n = 5 for each mouse strain at each time point. *P < 0.05, **P < 0.01, and ***P < 0.001 when compared between db/db mice and control mice at the same time point in the post hoc analysis.
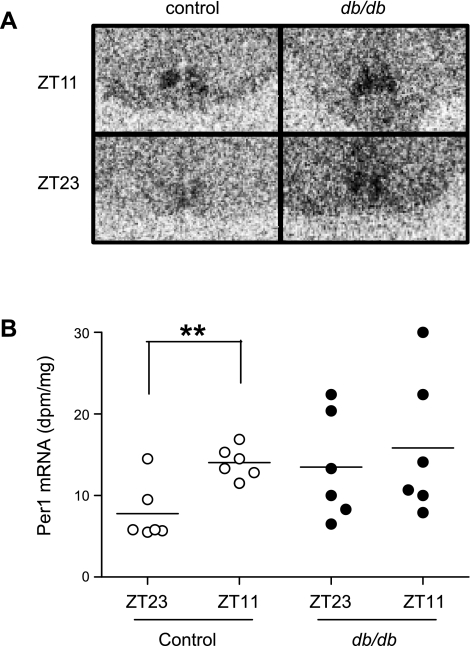
To test whether clock gene expression is selectively altered in periphery in db/db mice, we investigated Per1 expression in the SCN at ZT11 and ZT23 by in situ hybridization. The results demonstrated that the variation in expression levels between ZT23 and ZT11 in control mice was absent in db/db mice (Fig. 5). This finding suggests that the amplitude or phase of the Per1 expression rhythm in the db/db master circadian pacemaker may be altered, although the variability in expression and small number of time points examined limit the strength of this conclusion.
Fig. 5.
Time of day variation in suprachiasmatic nucleus (SCN) Per1 mRNA expression is altered in diabetic db/db mice compared with control mice. Brains were isolated from 9- to 10-wk-old male db/db mice and control mice and cut into slides. Per1 mRNA expression was quantified by in situ hybridization. A: representative autoradiogram. B: quantification of the data. n = 6 for each mouse strain at each time point. **P < 0.01 when compared between the two time points of the same strain of mice.
Altered diurnal contractile variations in the db/db mouse aorta.
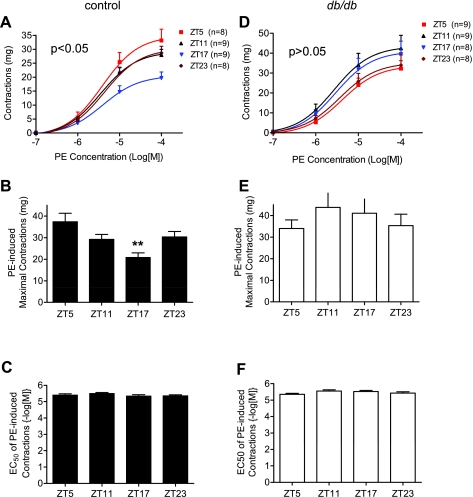
To investigate whether the extensive alterations in vascular clock and target gene mRNA are associated with changes in VSM diurnal contractile variations in db/db mice, we isolated abdominal aortas from db/db and control mice at the four ZT points and measured agonist-induced isometric contractions. We found that, in aortas isolated from control mice, the maximal contractile responses to the α1-receptor agonist phenylephrine exhibited variations according the time of day when the mice were euthanized. The maximal contraction was lowest at ZT17 and highest at ZT5 (Fig. 6, A and B). No differences were detected in EC50 among the four ZT points (Fig. 6C). In contrast, in aortas isolated from db/db mice, no statistic significant differences were detected in the maximal responses to phenylephrine among the four ZT points (Fig. 6, D and E). In fact, the contractile response at ZT17 seemed to be higher than the responses at ZT5 and ZT23 in tissues isolated from db/db mice (Fig. 6, D and E). Interestingly, no differences in EC50 were observed among the four ZT points in db/db mice (Fig. 6F) and between control and db/db mice (compare Fig. 6, C vs. F).
Fig. 6.
The diurnal variation of the contractile response to phenylephrine (PE) is altered in db/db compared with control mouse abdominal aorta strips. Male 9- to 10-wk-old control mice (A–C) and db/db mice (D–F) were euthanized at ZT5, ZT11, ZT17, and ZT23. Isometric contractions in response to cumulative does of PE were determined in endothelium-denuded abdominal aortic helical strips. **P < 0.01 compared with the corresponding ZT5 point in the post hoc analysis.
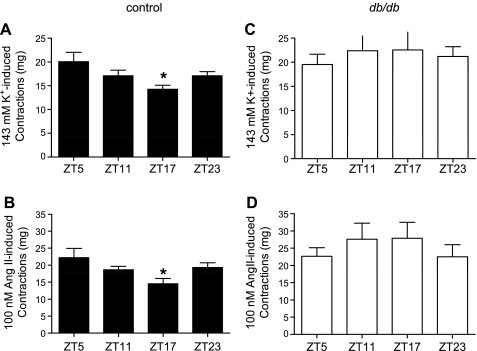
To test whether the alterations in aorta diurnal contractile variation are selective for phenylephrine-induced contraction, we investigated contractions at the four ZT points to supramaximal concentrations of high K+ (143 mM) or ANG II (100 nM). Similar to phenylephrine-induced contractions, there were diurnal variations in the contractile responses to high K+ and ANG II in aortas from control mice (Fig. 7, A and B). Such diurnal contractile variations were abolished in aortas isolated from db/db mice (Fig. 7, C and D).
Fig. 7.
Diurnal variations of maximal contractile responses to high K+ and ANG II are altered in db/db compared with control mouse abdominal aorta strips. Male 9- to 10-wk-old control mice (A and B) and db/db mice (C and D) were euthanized at ZT5, ZT11, ZT17, and ZT23. Isometric contractions in response to maximal does of high K+ depolarization (143 mM; A and C) or ANG II (100 nM; B and D) were determined in endothelium-denuded abdominal aortic helical strips. n = 8–9 for each time point. *P < 0.05 compared with the corresponding ZT5 point in the post hoc analysis.
Loss of the diurnal variation of in vivo pressor responses in db/db mice.
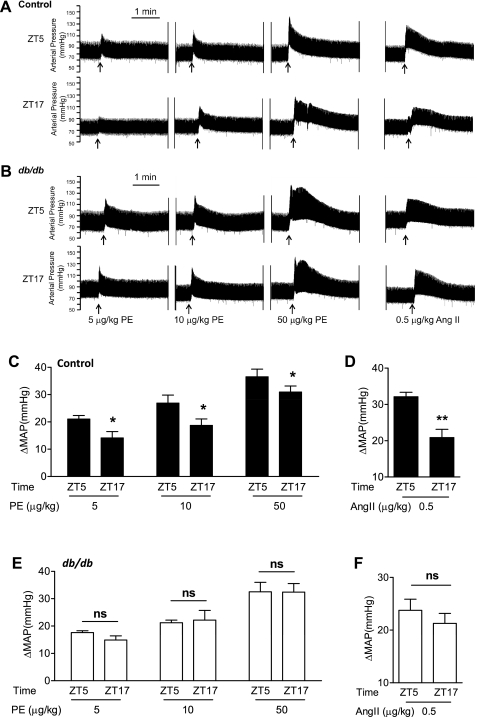
To further verify that the circadian variations observed in the isolated aorta also operate in resistance arterioles, we determined, in vivo, the instant blood pressure increase in response to a bolus intravenous injection of phenylephrine and ANG II. We found that, in both control and db/db mice, phenylephrine increased blood pressure in a dose-dependent manner at either ZT5 or ZT17 (Table 2 and Fig. 8, A and C). Importantly, in control mice, the amplitude of the blood pressure increase was higher at ZT5 than that observed at ZT17 at all three doses of phenylephrine tested (Table 2 and Fig. 8, A and C). In contrast, in db/db mice, no differences were detected in the amplitude of the blood pressure increase between ZT5 and ZT17 (Table 2 and Fig. 8, B and E).
Table 2.
Mean arterial pressure before and after vasoconstrictor injections
| Control Mice |
db/db Mice |
|||||||
|---|---|---|---|---|---|---|---|---|
| ZT5 |
ZT17 |
ZT5 |
ZT17 |
|||||
| Treatment | Basal | Injection | Basal | Injection | Basal | Injection | Basal | Injection |
| Phenylephrine | ||||||||
| 5 μg/kg | 74.0 ± 6.1 | 95.1 ± 6.7 | 70.7 ± 5.7 | 84.8 ± 6.9 | 76.4 ± 2.5 | 94.0 ± 2.7 | 82.6 ± 3.0 | 97.5 ± 2.5 |
| 10 μg/kg | 71.9 ± 5.8 | 98.8 ± 5.5 | 68.8 ± 6.7 | 87.5 ± 7.8 | 76.3 ± 2.8 | 97.6 ± 3.0 | 78.7 ± 4.3 | 100.9 ± 4.5 |
| 15 μg/kg | 73.3 ± 5.5 | 109.8 ± 5.6 | 66.5 ± 8.2 | 87.3 ± 9.6 | 73.6 ± 3.1 | 106.1 ± 5.4 | 78.1 ± 4.7 | 110.5 ± 5.0 |
| ANG II | ||||||||
| 0.5 μg/kg | 74.7 ± 4.0 | 106.9 ± 3.7 | 73.0 ± 2.7 | 99.8 ± 5.7 | 74.9 ± 3.6 | 98.7 ± 3.1 | 74.8 ± 4.6 | 96.1 ± 5.2 |
Values are means ± SE (in mmHg); n = 3–6. ZT, Zeitgeber time. The pressure after the injection is the maximal pressure, and it was usually reached within several seconds after the injection.
Fig. 8.
Diurnal variations of in vivo pressor responses to intravenous PE and ANG II injection were lost in db/db mice. Male 10-wk-old control mice and db/db mice were instrumented with radiotelemetry, recovered for 10 days, and underwent basal blood pressure collection for 3 days. Mice were then anesthetized with isoflurane, and various doses of PE or ANG II were injected via a femoral vein. A and B: representative original blood pressure recordings. C–F: quantification of maximal net blood pressure increases in response to PE and ANG II injections. MAP, mean arterial pressure; ns, not significant. n = 3–6. *P < 0.05. **P < 0.01.
In addition, in control mice, the pressor response to an ANG II injection was also significantly higher at ZT5 than that at ZT17 (Table 2 and Fig. 8, A and D), and such diurnal differences were lost in db/db mice (Table 2 and Fig. 8, B and F).
Such loss of diurnal variations in the in vivo pressor responses in db/db mice was associated with a significant suppression of the diurnal difference in mean arterial pressure between the dark and light phase: 6.8 ± 1.3 mmHg in db/db mice and 16.2 ± 0.94 mmHg in control mice (P < 0.0001).
Altered mRNA expressions and circadian variations of contraction regulatory proteins in the db/db mouse aorta and mesenteric arteries.
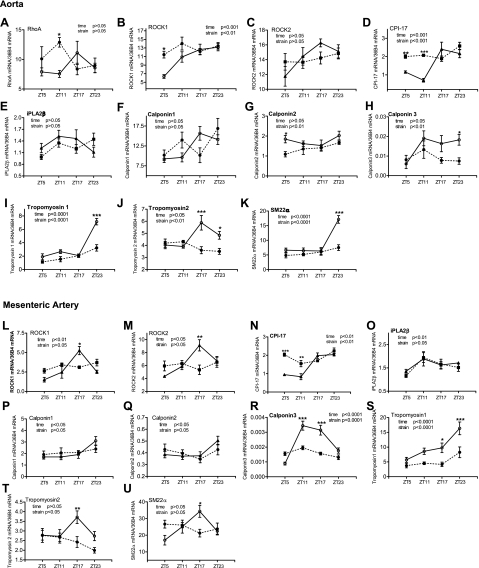
To begin exploring the molecular mechanisms underlying diurnal VSM contractile variations, we determined the mRNA expression profile of several contraction regulatory proteins. The mRNAs of several genes that are critical in regulating myosin regulatory light chain (MLC20) phosphorylation and contraction were determined: RhoA, Rho kinase-1/2 (ROCK-1/2), PKC-potentiated phosphatase inhibitory protein of 17 kDa (CPI-17), and Ca2+-independent phospholipase A2-β (iPLA2β). In addition, the mRNAs of several thin filament-binding proteins that have been shown to exhibit circadian variations in the mouse aorta and regulate smooth muscle contraction via a MLC20 phosphorylation-independent mechanism (34) were determined: calponin-1/2/3, tropomyosin-1/2, and smooth muscle protein-22α (SM22α). In the aorta, among the genes that regulate MLC20 phosphorylation and contraction, we found that ROCK-1 (Fig. 9B) and CPI-17 (Fig. 9D) showed time of day-dependent variations in control mice and that such variations were suppressed in db/db mice. Among the three calponin isoforms investigated (Fig. 9, F–H), the smooth muscle dominant isoform calponin-1 showed diurnal variation, but no statistic significance differences were detected between db/db and control mice. For calponin-2, no diurnal oscillation was detected in control mice, and no dramatic differences were detected between db/db and control mice (Fig. 9G). For calponin-3, whereas no statistic significant diurnal oscillation was detected in control tissue, the expression level was decreased in db/db mice compared with control mice (Fig. 9H). The diurnal variations of tropomyosin-1 (Fig. 9I), tropomyosin-2 (Fig. 9J), and SM22α (Fig. 9K) in control tissues were abolished in db/db tissues (Fig. 9, I–K).
Fig. 9.
Daily mRNA expression profiles of contraction-related proteins in aortas (A–K) and mesenteric arteries (L–U) isolated from diabetic db/db mice and control mice. Male 9- to 10-wk-old db/db mice (● and dotted lines) and control mice (○ and solid lines) were euthanized at ZT5, ZT11, ZT17, and ZT23. Aortas and mesenteric arteries were harvested and cleaned, and mRNAs were quantified using real-time PCR. A: RhoA. B and L: Rho kinase 1 (ROCK-1). C and M: ROCK-2. D and N: PKC-potentiated phosphatase inhibitory protein of 17 kDa (CPI-17). E and O: Ca2+-independent phospholipase A2-β (iPLA2β). F and P: calponin-1. G and Q: calponin-2. H and R: calponin-3. I and S: tropomyosin-1. J and T: tropomyosin-2. K and U: smooth muscle protein 22-α (SM22α). n = 5 for each mouse strain at each time point. *P < 0.05; **P < 0.01, and ***P < 0.001 when compared between db/db mice and control mice at the same time point in the post hoc analysis.
To check whether the alterations of these contraction-related proteins in the db/db mouse aorta are also manifested in small arteries, we determined their mRNA expression profiles in mesenteric arteries. As shown in Fig. 9, L–U, in control tissues, the ROCK-1/2, CPI-17, and iPLA2β expression patterns were very similar between mesenteric arteries and the aorta. Moreover, time of day-dependent variations in ROCK1/2 and CPI-17 were significantly suppressed in db/db mouse tissues. In addition, in control tissues, the three calponin isoform expression patterns were very similar between mesenteric arteries and the aorta. Whereas no significant differences were detected between control and db/db mice in calponin-1 and calponin-2, the expression level and diurnal oscillation of calponin-3 were significantly suppressed in db/db mesenteric arteries compared with control meseneric arteries. The alterations in tropomyosin-1 and tropomyosin-2 expression levels and diurnal oscillations in db/db mice were very similar between the aorta and mesenteric arteries (Fig. 9, S and T). In terms of SM22α expression, the peak phase of diurnal oscillation seemed to be shifted from ZT23 in the aorta to ZT17 in the mesenteric artery. However, in both vascular tissues, the diurnal oscillations of SM22α were abolished in db/db mice (Fig. 9, K and U).
DISCUSSION
The major novel findings of the present study were that in type 2 diabetic db/db mice, 1) the clock and target gene mRNA daily oscillations exhibited organ-specific alterations in the aorta, mesenteric arteries, heart, kidney, and SCN; 2) the VSM diurnal contractile variations to phenylephrine, high K+, and ANG II were disrupted in isolated aortas and in vivo; and 3) the mRNA diurnal oscillations of contraction regulatory proteins ROCK-1/2, CPI-17, calponin, tropomyosin-1/2, and SM22α were diminished in the aorta and/or mesenteric arteries. These findings are potentially significant as the observed alterations in the 24-h rhythms of clock gene expression and VSM contractility in db/db mice may serve as the molecular mechanisms linking type 2 diabetes and disruption of blood pressure circadian rhythm.
Clock gene expressions in the vasculature exhibited extensive changes in db/db mice. Among them, the most dramatic change detected was the loss of Per1/2 and Cry2 diurnal oscillations. In cultured fibroblast cells, high glucose has been reported to suppress Per1/2 transcription (17), whereas insulin has been reported to stimulate Per1/2 transcription (2). In addition, glucose feeding has been shown entrain diurnal clock in vivo (38). Thus, the hyperglycemia and decreased insulin function due to insulin resistance and/or loss of insulin protein in db/db mice could cause the observed loss of Per1/2 diurnal oscillation. It is well recognized that Per1/2 and Cry1/2 are regulated by CLOCK and BMAL1. Thus, it is surprising that we found that Per1/2 and Cry1/2 showed a dramatic suppression in the overall oscillation amplitude and expression level at some time points, but no significant changes were observed in Clock and Bmal1 mRNAs (Figs. 1, A and B, and 2, A and B) in db/db mice. This suggests that the transcriptional activity of the CLOCK and BMAL1 heterodimer was inhibited in the db/db mouse vasculature at a step(s) downstream from their transcription. In line with this possibility, recent data have emphasized the critical importance of multiple posttranslational modifications including phosphorylation, acetylation, sumoylation, and ubiquitylation in the regulation of BMAL1 activity (40). Thus, it is conceivable that there are alterations in BMAL1 posttranslational modifications in the db/db mouse vasculature that resulted in consequent suppression of its transcriptional activity. Alternatively, hyperglycemia and lose of insulin function initially cause Per1/2 mRNA alterations in 9- to 10-wk-old db/db mice, as detected in the present study, and subsequently the more severe hyperglycemia and loss of insulin function cause Bmal1 mRNA alterations in 14- to 16-wk-old db/db mice, as we have previously reported (39).
In hearts and kidneys from db/db mice, there were some significant changes in the expression of canonical clock and target genes, but the changes seem to be less extensive compared with that in the vasculature. In streptozotocin-induced type 1 diabetic models, it has been reported that there is an ∼3-h phase advance in the expression of several core clock genes in the heart (26, 50) and a suppression of Per2 mRNA in the kidney (27). The present study did not detect such alterations in db/db mice. The difference between the previous and present studies is likely related to the different pathologies between type 1 and type 2 diabetes.
In addition to peripheral clock genes, we also found that the central SCN Per1 variation between ZT11 and ZT23 was abrogated in db/db mice, suggesting that either the amplitude of the clock gene oscillation is suppressed and/or the phase of the oscillation is shifted. A larger study with more time points is needed to confirm this genotype effect and differentiate between these possible interpretations. Such an alteration in the master circadian pacemaker could contribute to the disruption in blood pressure diurnal rhythm directly and/or indirectly by promoting disruption in peripheral clock genes. An alteration in the master pacemaker is consistent with the observation that the diurnal variations of locomotor activity are suppressed in db/db mice (8, 39), since the circadian locomotor activity rhythm is controlled by the SCN. We note that, in contrast to our observation, Kudo et al. (23) found no significant differences in the SCN Per1 diurnal rhythm between control and db/db mice. Further study is required to resolve the cause(s) underlying this discrepancy.
While the basic molecular components of the circadian clock are similar in various mammalian tissues, their regulation in normal conditions or alterations in diabetes seems to be organ specific. In contrast to the lack of Clock mRNA diurnal oscillation in the SCN under normal conditions (32), we observed that Clock mRNA oscillates in all the peripheral organs investigated, including the vasculature, heart, and kidney, which is consistent with previous reports (48). This suggests divergent regulation between central and peripheral circadian clocks. Moreover, in the db/db mouse peripheral organs investigated, the alterations in clock and target genes varied enormously in terms of which and how many of the genes changed and the amplitude of changes. Such diverse changes of clock genes in db/db mice suggests a critical role of the specific local environment or regulatory mechanisms in controlling the clock gene expression. Moreover, the diverse changes raise the possibility that desynchronization among the multiple peripheral organs that are critical in blood pressure regulation may ultimately contribute to the disruption of the blood pressure diurnal rhythm in db/db mice and perhaps also in diabetic patients.
Diurnal variations in the vascular contractile reactivity to various agonists have been demonstrated in situ in isolated blood vessels and in vivo in rodents and human (1, 10, 13, 19, 22, 24, 45). We (14, 47) and others (20–21, 29, 31) have demonstrated that VSM contractile responses at one time point of day are enhanced in the aorta and mesenteric arteries isolated from db/db mice compared with nondiabetic control mice. However, it is unknown whether the diurnal variation of VSM contractile responses is also altered in the db/db mouse vasculature. The present study, for the first time, demonstrates that the diurnal variations in the maximal contractile responses to phenylephrine, high K+, and ANG II were disrupted in isolated type 2 diabetic db/db mouse aortas and in vivo compared with nondiabetic control mice. However, further experiments are required to establish whether the clock gene disruptions are responsible for the disruption of contractile diurnal variations.
The observed loss of VSM diurnal contractile variation in db/db mice could be one linker connecting diabetes and the disruption of the blood pressure circadian rhythm. To our surprise, the amplitude of the VSM contractile response does not directly correlate with the blood pressure level. In control mice, the highest contractile response within our detection limit was observed during the light phase at ZT5 (Figs. 6 and 7), when the blood pressure was at a low level (39), and the lowest contractile responses were observed during the dark phase at ZT17 (Figs. 6 and 7), when the blood pressure was at a high level (39). This unexpected observation is unlikely to be caused by the use of the conduit vessel aorta versus resistance arterioles or by the 5- to 6-h delay from mouse euthanization to the finish of the isometric contraction measurement, because our in vivo study also found large increases in blood pressure in response to intravenous phenylephrine or ANG II injection during the inactive light phase and small blood pressure increases during the active dark phase (Fig. 8). While the physiological significance of such an “antiphase” temporal relationship between the intrinsic VSM contractile reactivity and blood pressure remains to be elucidated, we speculate that the diminished intrinsic VSM contractility during the active dark phase works to prevent dangerously high blood pressure and large blood pressure fluctuations as a result of the heightened sympathetic tone and elevated vasoconstrictive hormones, such as epinephrine and ANG II.
The molecular mechanisms responsible for the VSM diurnal contractile oscillation are mostly unknown. The present study demonstrates that, in the abdominal aorta of wild-type mice, the maximal contractile responses to phenylephrine, ANG II, and high K+ show a similar pattern of diurnal variations, peak around ZT5, and nadir around ZT17. This suggests the mechanisms that responsible for the diurnal contractile variation is likely downstream of the receptor at a step where various upstream stimuli have converged. It is well established that VSM contraction is primarily regulated by the reversible phosphorylation of MLC20 (16, 37). In addition, VSM uses a “thin filament-based regulatory system” to regulate contraction independent of MLC20 phosphorylation. While it has been demonstrated that the mRNAs of several thin filament-binding proteins, including calponin, tropomyosin, and SM22α, oscillate within a 24-h period in the normal mouse aorta (34), our results revealed that ROCK-1, ROCK-2 and CPI-17, three critical proteins in regulating MLC20 phosphorylation and thereby smooth muscle contraction also exhibit variations within a 24-h period in the normal mouse aorta and mesenteric arteries. Moreover, our results further demonstrated that, associated with the suppression of diurnal contractile variation, the diurnal mRNA oscillation of ROCK-1, ROCK-2, CPI-17, tropomyosin-1/2, SM22α, and calponin 3 were suppressed in the diabetic db/db mouse aorta and/or mesenteric arteries. These results are consistent with the scenario that both MLC20-dependent and -independent mechanisms are involved in VSM diurnal contractile variations under normal conditions and the loss of diurnal contractile variations in diabetes. However, additional data on whether the observed mRNA alterations translate into protein alterations and MLC20 phosphorylation alterations are required to support a causal role of these genes in the diurnal variation of VSM contraction. In addition, PPAR-γ may also contribute to VSM contractile diurnal variations and their disruption in diabetes. Inhibition of PPAR-γ in smooth muscle by genetic deletion (42) or by overexpression of a dominant negative mutation (15) has been demonstrated to enhance VSM contractile responses and diminish the blood pressure circadian rhythm (43). Our data clearly demonstrated that PPAR-γ mRNA oscillates within a 24-h period in vasculature and that the oscillations were suppressed in the diabetic db/db mouse aorta and mesenteric arteries.
In summary, the present study demonstrated multiple deficits in the diurnal rhythm of clock and target genes in multiple sites and of VSM contractile function in type 2 diabetic db/db mice. These findings implicate a potential role of clock genes in the loss of the diurnal blood pressure rhythm and increased risk of heart attack and stroke that are characteristic of patients with type 2 diabetes.
GRANTS
This work was supported by National Heart, Lung, and Blood Institute Grants HL-082791 (to M. C. Gong) and HL-088389 (to Z. Guo). Part of the work has been previously published in abstract form at the National Institute of Diabetes and Digestive and Kidney Diseases “Circadian Rhythms and Metabolic Disease” workshop (April 12–13, Bethesda, MD).
DISCLOSURES
No conflicts of interest, financial or otherwise, are declared by the author(s).
AUTHOR CONTRIBUTIONS
Author contributions: W.S., Z.X., and J.L. performed experiments; W.S., Z.X., J.L., and M.C.G. analyzed data; W.S., Z.X., Z.G., M.J.D., J.L., and M.C.G. interpreted results of experiments; W.S., Z.X., and M.C.G. prepared figures; W.S., Z.X., Z.G., M.J.D., J.L., and M.C.G. approved final version of manuscript; Z.G., M.J.D., and M.C.G. conception and design of research; Z.G., M.J.D., and M.C.G. edited and revised manuscript; M.C.G. drafted manuscript.
ACKNOWLEDGMENTS
The authors thank Dr. Kathleen Franklin for the excellent assistance with the in situ hybridization and image analysis.
REFERENCES
- 1. Andreotti F, De Luca L, Renda G, Ferro A, Mongiardo R, Zecchi P, Maseri A. Circadianicity of hemostatic function and coronary vasomotion. Cardiologia 44, Suppl 1: 245–249, 1999 [PubMed] [Google Scholar]
- 2. Balsalobre A, Marcacci L, Schibler U. Multiple signaling pathways elicit circadian gene expression in cultured Rat-1 fibroblasts. Curr Biol 10: 1291–1294, 2000 [DOI] [PubMed] [Google Scholar]
- 3. Bell RH, Jr, Hye RJ. Animal models of diabetes mellitus: physiology and pathology. J Surg Res 35: 433–460, 1983 [DOI] [PubMed] [Google Scholar]
- 4. Cardoso CR, Leite NC, Freitas L, Dias SB, Muxfeld ES, Salles GF. Pattern of 24-hour ambulatory blood pressure monitoring in type 2 diabetic patients with cardiovascular dysautonomy. Hypertens Res 31: 865–872, 2008 [DOI] [PubMed] [Google Scholar]
- 5. Chen H, Charlat O, Tartaglia LA, Woolf EA, Weng X, Ellis SJ, Lakey ND, Culpepper J, Moore KJ, Breitbart RE, Duyk GM, Tepper RI, Morgenstern JP. Evidence that the diabetes gene encodes the leptin receptor: identification of a mutation in the leptin receptor gene in db/db mice. Cell 84: 491–495, 1996 [DOI] [PubMed] [Google Scholar]
- 6. Czupryniak L, Mlynarski W, Pawlowski M, Saryusz-Wolska M, Borkowska A, Klich I, Bodalski J, Loba J. Circadian blood pressure variation in normotensive type 2 diabetes patients and angiotensin converting enzyme polymorphism. Diabetes Res Clin Pract 80: 386–391, 2008 [DOI] [PubMed] [Google Scholar]
- 7. Duncan MJ, Franklin KM, Davis VA, Grossman GH, Knoch ME, Glass JD. Short-term constant light potentiation of large-magnitude circadian phase shifts induced by 8-OH-DPAT: effects on serotonin receptors and gene expression in the hamster suprachiasmatic nucleus. Eur J Neurosci 22: 2306–2314, 2005 [DOI] [PubMed] [Google Scholar]
- 8. Esser KA, Su W, Matveev S, Wong V, Zeng L, McCarthy JJ, Smart EJ, Guo Z, Gong MC. Voluntary wheel running ameliorates vascular smooth muscle hyper-contractility in type 2 diabetic db/db mice. Appl Physiol Nutr Metab 32: 711–720, 2007 [DOI] [PubMed] [Google Scholar]
- 9. Fukuda M, Goto N, Kimura G. Hypothesis on renal mechanism of non-dipper pattern of circadian blood pressure rhythm. Med Hypotheses 67: 802–806, 2006 [DOI] [PubMed] [Google Scholar]
- 10. Gohar M, Daleau P, Atkinson J, Gargouil YM. Ultradian variations in sensitivity of rat aorta rings to noradrenaline. Eur J Pharmacol 229: 69–73, 1992 [DOI] [PubMed] [Google Scholar]
- 11. Goncalves AC, Tank J, Diedrich A, Hilzendeger A, Plehm R, Bader M, Luft FC, Jordan J, Gross V. Diabetic hypertensive leptin receptor-deficient db/db mice develop cardioregulatory autonomic dysfunction. Hypertension 53: 387–392, 2009 [DOI] [PubMed] [Google Scholar]
- 12. Gong MC, Cohen P, Kitazawa T, Ikebe M, Masuo M, Somlyo AP, Somlyo AV. Myosin light chain phosphatase activities and the effects of phosphatase inhibitors in tonic and phasic smooth muscle. J Biol Chem 267: 14662–14668, 1992 [PubMed] [Google Scholar]
- 13. Gorgun CZ, Keskil ZA, Hodoglugil U, Ercan ZS, Abacioglu N, Zengil H. In vitro evidence of tissue susceptibility rhythms. I. Temporal variation in effect of potassium chloride and phenylephrine on rat aorta. Chronobiol Int 15: 39–48, 1998 [DOI] [PubMed] [Google Scholar]
- 14. Guo Z, Su W, Allen S, Pang H, Daugherty A, Smart E, Gong MC. COX-2 up-regulation and vascular smooth muscle contractile hyperreactivity in spontaneous diabetic db/db mice. Cardiovasc Res 67: 723–735, 2005 [DOI] [PubMed] [Google Scholar]
- 15. Halabi CM, Beyer AM, de Lange WJ, Keen HL, Baumbach GL, Faraci FM, Sigmund CD. Interference with PPARγ function in smooth muscle causes vascular dysfunction and hypertension. Cell Metab 7: 215–226, 2008 [DOI] [PMC free article] [PubMed] [Google Scholar]
- 16. Hartshorne DJ. In: Physiology of the Gastrointestinal Tract, edited by Johnson LR. New York: Raven, 1987, p. 423–482. [Google Scholar]
- 17. Hirota T, Okano T, Kokame K, Shirotani-Ikejima H, Miyata T, Fukada Y. Glucose down-regulates Per1 and Per2 mRNA levels and induces circadian gene expression in cultured Rat-1 fibroblasts. J Biol Chem 277: 44244–44251, 2002 [DOI] [PubMed] [Google Scholar]
- 18. Horiuti K. Mechanism of contracture on cooling of caffeine-treated frog skeletal muscle fibres. J Physiol 398: 131–148, 1988 [DOI] [PMC free article] [PubMed] [Google Scholar]
- 19. Hossmann V, Fitzgerald GA, Dollery CT. Circadian rhythm of baroreflex reactivity and adrenergic vascular response. Cardiovasc Res 14: 125–129, 1980 [DOI] [PubMed] [Google Scholar]
- 20. Kamata K, Kojima S. Characteristics of contractile responses of aorta to norepinephrine in db/db mice. Res Commun Mol Pathol Pharmacol 96: 319–328, 1997 [PubMed] [Google Scholar]
- 21. Kanie N, Kamata K. Contractile responses in spontaneously diabetic mice. I. Involvement of superoxide anion in enhanced contractile response of aorta to norepinephrine in C57BL/KsJ(db/db) mice. Gen Pharmacol 35: 311–318, 2002 [DOI] [PubMed] [Google Scholar]
- 22. Keskil Z, Gorgun CZ, Hodoglugil U, Zengil H. Twenty-four-hour variations in the sensitivity of rat aorta to vasoactive agents. Chronobiol Int 13: 465–475, 1996 [DOI] [PubMed] [Google Scholar]
- 23. Kudo T, Akiyama M, Kuriyama K, Sudo M, Moriya T, Shibata S. Night-time restricted feeding normalises clock genes and Pai-1 gene expression in the db/db mouse liver. Diabetologia 47: 1425–1436, 2004 [DOI] [PubMed] [Google Scholar]
- 24. Masuki S, Todo T, Nakano Y, Okamura H, Nose H. Reduced α-adrenoceptor responsiveness and enhanced baroreflex sensitivity in Cry-deficient mice lacking a biological clock. J Physiol 566: 213–224, 2005 [DOI] [PMC free article] [PubMed] [Google Scholar]
- 25. Nakano S, Uchida K, Kigoshi T, Azukizawa S, Iwasaki R, Kaneko M, Morimoto S. Circadian rhythm of blood pressure in normotensive NIDDM subjects. Its relationship to microvascular complications. Diabetes Care 14: 707–711, 1991 [DOI] [PubMed] [Google Scholar]
- 26. Oishi K, Kasamatsu M, Ishida N. Gene- and tissue-specific alterations of circadian clock gene expression in streptozotocin-induced diabetic mice under restricted feeding. Biochem Biophys Res Commun 317: 330–334, 2004 [DOI] [PubMed] [Google Scholar]
- 27. Oishi K, Ohkura N, Kasamatsu M, Fukushima N, Shirai H, Matsuda J, Horie S, Ishida N. Tissue-specific augmentation of circadian PAI-1 expression in mice with streptozotocin-induced diabetes. Thromb Res 114: 129–135, 2004 [DOI] [PubMed] [Google Scholar]
- 28. Palmas W, Pickering T, Teresi J, Schwartz JE, Eguchi K, Field L, Weinstock RS, Shea S. Nocturnal blood pressure elevation predicts progression of albuminuria in elderly people with type 2 diabetes. J Clin Hypertens (Greenwich) 10: 12–20, 2008 [DOI] [PMC free article] [PubMed] [Google Scholar]
- 29. Pannirselvam M, Verma S, Anderson TJ, Triggle CR. Cellular basis of endothelial dysfunction in small mesenteric arteries from spontaneously diabetic (db/db−/−) mice: role of decreased tetrahydrobiopterin bioavailability. Br J Pharmacol 136: 255–263, 2002 [DOI] [PMC free article] [PubMed] [Google Scholar]
- 30. Park S, Bivona BJ, Feng Y, Lazartigues E, Harrison-Bernard LM. Intact renal afferent arteriolar autoregulatory responsiveness in db/db mice. Am J Physiol Renal Physiol 295: F1504–F1511, 2008 [DOI] [PMC free article] [PubMed] [Google Scholar]
- 31. Piercy V, Taylor SG. A comparison of spasmogenic and relaxant responses in aortae from C57/BL/KsJ diabetic mice with those from their non-diabetic litter mates. Pharmacology 56: 267–275, 1998 [DOI] [PubMed] [Google Scholar]
- 32. Reppert SM, Weaver DR. Coordination of circadian timing in mammals. Nature 418: 935–941, 2002 [DOI] [PubMed] [Google Scholar]
- 33. Rudic RD, Fulton DJ. Pressed for time: the circadian clock and hypertension. J Appl Physiol 107: 1328–1338, 2009 [DOI] [PMC free article] [PubMed] [Google Scholar]
- 34. Rudic RD, McNamara P, Reilly D, Grosser T, Curtis AM, Price TS, Panda S, Hogenesch JB, FitzGerald GA. Bioinformatic analysis of circadian gene oscillation in mouse aorta. Circulation 112: 2716–2724, 2005 [DOI] [PubMed] [Google Scholar]
- 35. Sakamoto K, Nagase T, Fukui H, Horikawa K, Okada T, Tanaka H, Sato K, Miyake Y, Ohara O, Kako K, Ishida N. Multitissue circadian expression of rat period homolog (rPer2) mRNA is governed by the mammalian circadian clock, the suprachiasmatic nucleus in the brain. J Biol Chem 273: 27039–27042, 1998 [DOI] [PubMed] [Google Scholar]
- 36. Senador D, Kanakamedala K, Irigoyen MC, Morris M, Elased KM. Cardiovascular and autonomic phenotype of db/db diabetic mice. Exp Physiol 94: 648–658, 2009 [DOI] [PMC free article] [PubMed] [Google Scholar]
- 37. Somlyo AP, Somlyo AV. Ca2+ sensitivity of smooth muscle and nonmuscle myosin II: modulated by G proteins, kinases, and myosin phosphatase. Physiol Rev 83: 1325–1358, 2003 [DOI] [PubMed] [Google Scholar]
- 38. Stephan FK, Davidson AJ. Glucose, but not fat, phase shifts the feeding-entrained circadian clock. Physiol Behav 65: 277–288, 1998 [DOI] [PubMed] [Google Scholar]
- 39. Su W, Guo Z, Randall DC, Cassis L, Brown DR, Gong MC. Hypertension and disrupted blood pressure circadian rhythm in type 2 diabetic db/db mice. Am J Physiol Heart Circ Physiol 295: H1634–H1641, 2008 [DOI] [PMC free article] [PubMed] [Google Scholar]
- 40. Takahashi JS, Hong HK, Ko CH, McDearmon EL. The genetics of mammalian circadian order and disorder: implications for physiology and disease. Nat Rev Genet 9: 764–775, 2008 [DOI] [PMC free article] [PubMed] [Google Scholar]
- 41. Verdecchia P. Prognostic value of ambulatory blood pressure: current evidence and clinical implications. Hypertension 35: 844–851, 2000 [DOI] [PubMed] [Google Scholar]
- 42. Wang N, Symons JD, Zhang H, Jia Z, Gonzalez FJ, Yang T. Distinct functions of vascular endothelial and smooth muscle PPARγ in regulation of blood pressure and vascular tone. Toxicol Pathol 37: 21–27, 2009 [DOI] [PMC free article] [PubMed] [Google Scholar]
- 43. Wang N, Yang G, Jia Z, Zhang H, Aoyagi T, Soodvilai S, Symons JD, Schnermann JB, Gonzalez FJ, Litwin SE, Yang T. Vascular PPARγ controls circadian variation in blood pressure and heart rate through Bmal1. Cell Metab 8: 482–491, 2008 [DOI] [PMC free article] [PubMed] [Google Scholar]
- 44. Welsh DK, Yoo SH, Liu AC, Takahashi JS, Kay SA. Bioluminescence imaging of individual fibroblasts reveals persistent, independently phased circadian rhythms of clock gene expression. Curr Biol 14: 2289–2295, 2004 [DOI] [PMC free article] [PubMed] [Google Scholar]
- 45. Witte K, Hasenberg T, Rueff T, Hauptfleisch S, Schilling L, Lemmer B. Day-night variation in the in vitro contractility of aorta and mesenteric and renal arteries in transgenic hypertensive rats. Chronobiol Int 18: 665–681, 2001 [DOI] [PubMed] [Google Scholar]
- 46. Xie Z, Gong MC, Su W, Turk J, Guo Z. Group VIA phospholipase A2 (iPLA2β) participates in angiotensin II-induced transcriptional up-regulation of regulator of G-protein signaling-2 in vascular smooth muscle cells. J Biol Chem 282: 25278–25289, 2007 [DOI] [PMC free article] [PubMed] [Google Scholar]
- 47. Xie Z, Su W, Guo Z, Pang H, Post SR, Gong MC. Up-regulation of CPI-17 phosphorylation in diabetic vasculature and high glucose cultured vascular smooth muscle cells. Cardiovasc Res 69: 491–501, 2006 [DOI] [PubMed] [Google Scholar]
- 48. Yamamoto T, Nakahata Y, Soma H, Akashi M, Mamine T, Takumi T. Transcriptional oscillation of canonical clock genes in mouse peripheral tissues. BMC Mol Biol 5: 18, 2004 [DOI] [PMC free article] [PubMed] [Google Scholar]
- 49. Young ME, Razeghi P, Taegtmeyer H. Clock genes in the heart: characterization and attenuation with hypertrophy. Circ Res 88: 1142–1150, 2001 [DOI] [PubMed] [Google Scholar]
- 50. Young ME, Wilson CR, Razeghi P, Guthrie PH, Taegtmeyer H. Alterations of the circadian clock in the heart by streptozotocin-induced diabetes. J Mol Cell Cardiol 34: 223–231, 2002 [DOI] [PubMed] [Google Scholar]


