

Abstract
Purpose
To identify mechanisms and mediators of resistance to anti-angiogenic therapy in human glioblastoma.
Experimental Design
We performed microarray gene expression analysis and immunohistochemistry comparing 21 recurrent glioblastomas progressing during anti-angiogenic treatment with VEGF neutralizing antibody bevacizumab to paired pre-treatment tumors from the same patients.
Results
Microarray analysis revealed that bevacizumab-resistant glioblastomas (BRGs) had 2 clustering patterns defining subtypes that reflect radiographic growth patterns. Enhancing BRGs (EBRGs) exhibited MRI enhancement, a long-established criterion for glioblastoma progression, and expressed mitogen-activated protein kinases, neural cell adhesion molecule-1 (NCAM-1), and aquaporin 4. Compared to their paired pre-treatment tumors, EBRGs had unchanged vascularity and hypoxia, with increased proliferation. Non-enhancing BRGs (NBRGs) exhibited minimal MRI enhancement but had FLAIR-bright expansion, a newer criterion for glioblastoma recurrence since the advent of anti-angiogenic therapy, and expressed integrin α5, laminin, fibronectin1, and PDGFRβ. NBRGs had less vascularity, more hypoxia, and unchanged proliferation than their paired pre-treatment tumors. Primary NBRG cells exhibited more stellate morphology with a 3-fold increased shape factor and were nearly 4-fold more invasive in matrigel chambers than primary cells form EBRGs or bevacizumab-naïve glioblastomas (P<0.05).
Conclusion
Using microarray analysis, we found two resistance patterns during anti-angiogenic therapy with distinct molecular profiles and radiographic growth patterns. These studies provide valuable biologic insight into the resistance that has limited anti-angiogenic therapy to date.
Keywords: bevacizumab, progression, glioblastoma, invasion, angiogenesis
INTRODUCTION
Recognition of the role of vascular endothelial growth factor (VEGF) in developing the vascularity of glioblastomas, which contributes to their growth and treatment resistance has led to clinical trials of humanized monoclonal VEGF antibody bevacizumab as monotherapy or combined with DNA damaging agents like irinotecan in glioblastoma patients (1–4). Two trials showing efficacy of bevacizumab monotherapy (3, 4) led to the 2009 FDA approval of bevacizumab for recurrent glioblastoma, making bevacizumab just the third FDA-approved glioblastoma treatment in nearly four decades. Randomized trials stemming from these results are studying bevacizumab in newly diagnosed glioblastomas, potentially allowing bevacizumab to join standard treatment regimens for newly diagnosed and recurrent glioblastomas.
Unfortunately, as with other cancers (5), the response to anti-angiogenic therapy in glioblastoma is often transient, with 40–60% radiographic progression rates after initially successful bevacizumab treatment in phase II clinical trials (1, 2). Glioblastomas progressing during bevacizumab therapy can exhibit non-enhancing FLAIR-bright growth (6) or restricted diffusion (7) on MRI. While these growth patterns were initially considered common after anti-angiogenic therapy, subsequent analyses have shown them to occur in less than half of glioblastomas progressing during anti-angiogenic therapy (6, 8, 9). Thus, imaging after resistance to anti-angiogenic therapy suggests heterogeneous resistance mechanisms, and illustrates the biology of anti-angiogenic therapy resistance, as FLAIR bright non-enhancing growth is thought to represent tumor infiltration, while restricted diffusion is believed to represent hypoxia. This pattern of increased hypoxia and invasiveness has also been described in preclinical models of VEGF blockade (10–12). Uncircumscribed growth after anti-angiogenic therapy often limits the benefit of surgery (13) and tumor hypoxia after anti-angiogenic therapy reduces response to available chemotherapies.
Preclinical studies suggest that tumors become resistant to anti-angiogenic therapy by transcriptional reprogramming allowing tumor cells to grow while the anti-angiogenic target remains inhibited (14). This paradigm represents a departure from resistance to traditional DNA damaging chemotherapy, which typically involves gene mutations. Because anti-angiogenic therapy resistance reflects transcriptional changes more readily generated than mutations characterizing traditional chemotherapy resistance (14), these responses may occur to some extent in all tumors treated with anti-angiogenic therapy, with tumors with the greatest transcriptional changes exhibiting anti-angiogenic therapy resistance.
To identify mediators of glioblastoma resistance to anti-angiogenic therapy, we performed comprehensive microarray transcriptional analysis, immunohistochemistry, and matrigel invasion assays comparing bevacizumab-resistant glioblastomas (BRGs) to their paired primary tumors, allowing us to define changes occurring in tumor cells and the microenvironment as patients’ tumors progressed from bevacizumab-responsive to bevacizumab-resistant.
MATERIALS AND METHODS
Case selection
Review of the UCSF Brain Tumor Research Center (BTRC) database identified glioblastomas meeting 2 inclusion criteria: (1) after initial responsiveness, tumor radiographic progression during bevacizumab therapy required surgery, with response and progression defined per Response Assessment in Neuro-Oncology (RANO) criteria (Supplementary Methods) (15); and (2) paired pre-treatment and bevacizumab-resistant tissue was available for comparison.
MRIs
Every 4–6 weeks during treatment, patients underwent MRIs with T1 post-gadolinium images and T2-weighted fluid attenuated inversion recovery (FLAIR) sequences (Supplementary Methods). FLAIR and T1 gadolinium-enhanced MRI scans revealing radiographic progression during bevacizumab treatment were loaded into aidScans software (AnyIntelli; Ukraine) for calculating volumes by an observer blinded to other analyses.
Immunohistochemistry
Immunostaining is described in Supplementary Methods. Vessel densities were counted from 10 representative 40× fields of vWF immunostainings by 2 observers blinded to treatment group. Stainings were quantified by converting images to binary using ImageJ software (NIH; Bethesda, MD) (16).
Matrigel invasion assay
Matrigel invasion assay is described in the Supplementary Methods.
Microarray analysis
RNA was extracted from paraffin blocks with the RecoverAll Total Nucleic Acid Isolation Kit (AM1975; Ambion, Inc., Austin, TX), using 60–120 μm of paraffin-embedded slices. RNA of sufficient quality and concentration was hybridized to multiple chips (7 distinct lots) to reduce batch or chip effect. Microarray analysis utilized the whole-Genome DASL Assay with HumanRef-8 BeadChips (Illumina, Inc.; San Diego, CA), a platform for FFPE-extracted samples. To validate primary dataset results, three additional paired specimens were analyzed on Whole Human Genome Oligo Microarray 4×44K (Agilent) and Human HT-12 v4 Expression BeadChip Kits (Illumina; San Diego, CA). Two chips whose samples clustered differently from others on cluster dendrogram heatmaps were excluded due to chip effect. After eliminating samples with insufficient gene-profile signal detection, 9 pairs underwent further analysis. Additional microarray details, microarray statistics, and gene set enrichment analysis (GSEA) are described in Supplementary Methods. Microarray data was deposited in the ArrayExpress database (accession no. E-MEXP-3296).
Real time RT-PCR
Real time RT-PCR is described in Supplementary Methods.
Statistics
Microarray statistics are described above. Immunohistochemistry was analyzed by paired t-tests. Kaplan-Meier analysis was used to compare survival between patient groups. Wilcoxon rank sum test was used for nonparametric comparisons of paired PCR and immunohistochemistry data. Student’s t-test was used for parametric comparisons. Fisher’s exact test was used to compare proportions.
Comparisons of over 2 groups utilized analysis of variance (ANOVA) with post hoc testing for further paired analysis. P<0.05 was statistically significant.
RESULTS
Patient characteristics
Twenty one glioblastoma patients met our inclusion criteria, having a period of initial bevacizumab responsiveness followed by radiographic progression during bevacizumab treatment, along with archived tissue from surgeries before and after bevacizumab treatment (Supplementary Table S1). These 21 patients underwent BRG resection an average of 31 days after their last bevacizumab dose (range=14–49 days). Nine patients received bevacizumab monotherapy, while 12 received bevacizumab combined with carboplatin, temozolomide, or CPT-11 (Supplementary Table S1).
Radiographic volumetric analysis suggests 2 BRG subtypes
We quantified the portion of each bevacizumab-resistant glioblastoma (BRG) that was non-enhancing by measuring the percent of the FLAIR-bright volume that was enhancing on the MRI revealing tumor progression during bevacizumab treatment and found a significant pattern of clustering into 2 groups, a tendency not existing in the pre-treatment specimens (Figure 1A). We called the BRGs (n=9) with a low percentage of FLAIR-bright volume exhibiting gadolinium enhancement (average=5%; range=1–10%; Figure 1A) non-enhancing BRGs (NBRGs). We called BRGs (n=12) with a higher percentage of FLAIR-bright volume exhibiting gadolinium enhancement (average=70%; range=50–97%) enhancing BRGs (EBRGs) (Figures 1A-B; Supplementary Figures S1–2).
Figure 1. Two types of bevacizumab-resistant glioblastomas (BRGs).

(A) T1 gadolinium-enhanced volumes as percentages of FLAIR-bright volume in BRGs clustered into 2 groups – enhancing bevacizumab-resistant glioblastomas (EBRGs) had enhancing volumes that were 50–97% of their FLAIR-bright volume, while non-enhancing bevacizumab-resistant glioblastomas (NBRGs) had enhancing volumes that were 0–10% of their FLAIR-bright volumes. Optimal partitioning of tumors based on the percentage of FLAIR bright volume that enhanced (Supplementary Methods) was obtained by division into groups of 11 (high percentage of enhancement) and 10 cases (low percentage of enhancement). (B) T1-gadolinium enhanced axial images from 3 representative EBRGs are shown, with a hematoxylin and eosin staining of the brain-tumor interface to the right at low and high magnification. (C) T1-gadolinium enhanced (upper row) and FLAIR (lower row) axial images from 3 representative non-enhancing bevacizumab-resistant glioblastomas (NBRGs) are shown, with a hematoxylin and eosin staining of the less well defined brain-tumor interface to the right in low (50x, scale bar 200 μm) and high (200x, scale bar 50 μm) power. (D) Example of perivascular tumor invasion (arrow), seen in 2/5 NBRGs and 0/6 EBRGs with tissue from the brain-tumor interface available; 200x; scale bar, 20 μm. (E) mean distance of furthest discontinuous invasion site from the tumor edge was higher in NBRGs than EBRGs (P<0.001).
To investigate the hypothesis that the non-enhancing FLAIR-bright growth seen in NBRGs reflected infiltrative growth, we analyzed cases where tumor-brain interface was part of the specimen. NBRGs (n=5) had more infiltrative borders than EBRGs (n=6) (Figures 1B–D) with nearly 5-fold greater distance of furthest discontinuous tumor invasion site from the continuous tumor edge (P<0.001; Figure 1D). Two NBRGs also contained perivascular tumor cell invasion (Figure 1C), a phenomenon previously reported in VEGF knockout murine gliomas (10). EBRGs were treated with bevacizumab for the same duration before progressing as NBRGs (mean 23 weeks each; P=1.0).
Patients with EBRGs versus NBRGs were equally likely to receive bevacizumab as monotherapy or with another agent (P=0.4). EBRG patients had equal median survival as NBRG patients after starting bevacizumab (P=0.2; Supplementary Figure S3A) and from time of progression during bevacizumab treatment (P=0.1; Supplementary Figure S3B). EBRG patients had comparable overall survival (OS) from time of diagnosis as NBRG patients (median 92 weeks NBRGs; 85 weeks EBRGs; P=0.3).
Because bevacizumab-treated glioblastomas sometimes exhibit restricted diffusion on MRI (7), we investigated BRG diffusion weighted imaging. Nine of 21BRGs exhibited restricted diffusion. EBRGs and NBRGs were equally likely to exhibit restricted diffusion (P=0.4). For patients with and without restricted diffusion, OS measured from diagnosis (median 79 versus 93 weeks; P=0.9) and from progression on bevacizumab (median 20 versus 28 weeks; P=0.4) were comparable.
Characterizing the microenvironment of bevacizumab-resistant glioblastomas
We used immunohistochemistry of tissue from BRGs and their paired pre-treatment specimens to characterize their hypoxia and vessel density, two tumor microenvironment characteristics potentially affected by anti-angiogenic therapy. Compared to their paired specimens before bevacizumab treatment, NBRGs exhibited reduced vessel density, from 26 vessels per high powered field (hpf) down to 10 vessels/hpf (P<0.05) and increased hypoxia, evidenced by over 60% increased tissue expressing hypoxia marker CA9 (17) (P<0.01) and increased HIF-1α staining (P<0.05) compared to before bevacizumab treatment (Figure 2; Supplementary Figures S4–6). Conversely, compared to their paired specimens from before bevacizumab treatment, EBRGs exhibited unchanged vessel density (P=0.2) and unchanged hypoxia, as evidenced by CA9 (P=0.9) and HIF-1α staining (P=0.4) (Figure 2; Supplementary Figures S7–9). Like EBRGs, control paired primary and recurrent bevacizumab-naïve glioblastomas exhibited unchanged vessel density and hypoxia (P=0.5–0.9; Supplementary Figure S10).
Figure 2. The microenvironment of bevacizumab-resistant glioblastomas (BRGs) compared to before bevacizumab treatment.
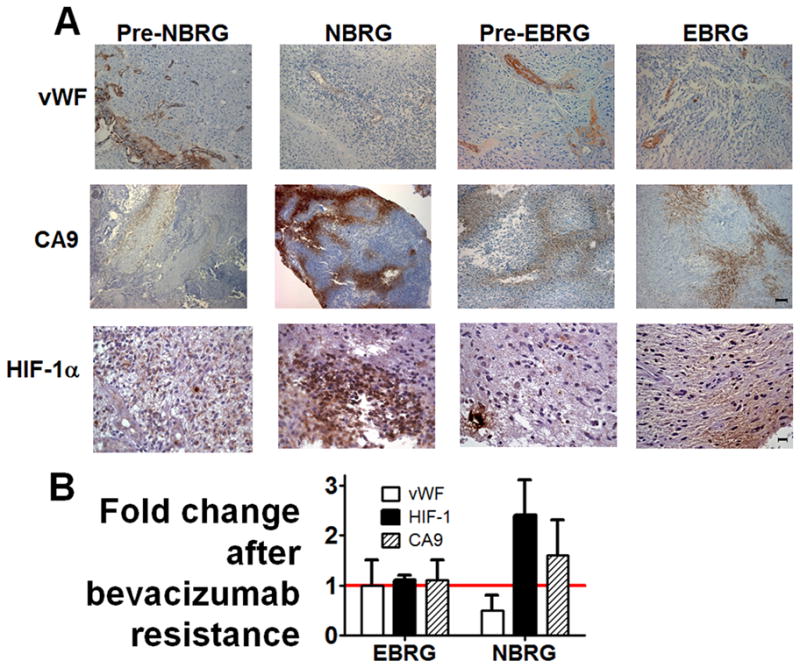
(A) representative paired immunostainings of vWF (endothelial marker; first row), CA9 (hypoxia marker; second row), and HIF-1α (hypoxia marker, third row) are shown from tumors that went on to become NBRGs (“pre-NBRG,” first column), NBRGs (second column), tumors that went on to become EBRGs (“pre-EBRG,” third column), and EBRGs (fourth column). (B) fold change in vessel density, percentage of CA9-positive tissue, and HIF-1α staining is shown for NBRGs and EBRGs, with standard deviations. Magnification/scale bars, 100×/100μm (vWF, CA9) or 400×/20 μm (HIF-1α).
Molecular profiling of common glioblastoma alterations in bevacizumab-resistant glioblastomas
Profiling BRGs for common glioblastoma genetic alterations, including epidermal growth factor receptor (EGFR) amplification, p53 mutations, isocitrate dehydrogenase 1 (IDH1) mutations, and loss of phosphatase and tensin homolog (PTEN) revealed no tendency for any alteration in pre-treatment specimens to be associated with a resistance pattern and no changes in any alteration after bevacizumab resistance (P>0.05; Supplementary Table S2).
Characterizing tumor cells in bevacizumab-resistant glioblastomas
We analyzed proliferation, density, morphology, and invasiveness of tumor cells before and after bevacizumab resistance. Using paired analysis from before and after bevacizumab resistance, NBRGs exhibited unchanged tumor cell staining with proliferation marker Ki-67 (P=0.7), while EBRGs exhibited increased Ki-67-staining (P<0.05) (Figures 3A–B). EBRGs and NBRGs both exhibited non-significant increases in cell density after bevacizumab resistance (P=0.2–0.4; Figure 3C). Like BRGs, cell density did not change in recurrent versus primary bevacizumab-naïve glioblastomas and, like NBRGs, Ki-67-staining did not change in recurrent versus primary bevacizumab-naïve glioblastomas (P=0.8–0.9; Supplementary Figure S10).
Figure 3. Properties of tumor cells isolated from bevacizumab-resistant glioblastomas (BRGs).

(A) Representative Ki-67 immunostainings are shown for a pre-treatment tumor that became an NBRG (“pre-NBRG,” first column), an NBRG (second column), a pre-treatment tumor that became an EBRG (“pre-EBRG,” third column), and an EBRG (fourth column). 400×, scale bar 50 μm. (B) Fold change in the percentage of Ki-67-positive cells in NBRGs and EBRGs after bevacizumab resistance compared to pre-treatment. (C) Tumor cell density increased in a non-significant (P=0.2–0.4) manner in EBRGs and NBRGs after bevacizumab resistance. (D) Image guided biopsies were taken from enhancing (n=2) or non-enhancing (n=2) regions of bevacizumab-naïve glioblastomas, as well as from EBRGs (n=2) and NBRGs (n=2). Axial T1 gadolinium-enhanced and FLAIR images are shown from one representative case of each of the 4 groups with locations of the image-guided biopsies in green. Primary cultures of glioblastoma cells from these 4 groups stained with DAPI and phalloidin revealed that tumor cells from NBRGs (n=2; right hand column) exhibited round enlarged cytoplasm with abundant actin-positive extensions, consistent with pseudopodia, while tumor cells from enhancing or non-enhancing regions of bevacizumab-naïve glioblastomas (n=2 each; left hand most 2 columns) or EBRGs (n=2; third column from left) exhibited more polarized stellate central morphology with fewer actin-positive extensions. Shown is a representative cell from the image-guided biopsy shown on the MRI images. 400×; Scale bar, 10 μm. (E) Inverse shape factor, a measure of cell dendricity calculated from micrographs representatively illustrated in (D) was elevated in NBRG cells versus EBRG cells or cells from enhancing or non-enhancing regions of bevacizumab-naïve recurrent glioblastomas (P<0.05).
Furthermore, cultured NBRG cells exhibited round enlarged cytoplasm with abundant actin-positive extensions, while bevacizumab-naïve glioblastoma and EBRG cells exhibited more polarized stellate morphology with fewer actin-positive extensions (Figure 3D). These differences were quantified by measuring cell dendricity, a unitless value also called inverse shape factor that describes two-dimensional shape (18) (Supplementary Methods). Dendricity was elevated in NBRG cells compared to bevacizumab-naïve or EBRG cells (P<0.05; Figure 3E).
These morphologic differences were further investigated by immunostaining GBM tissue for cadherins, adhesion molecules whose altered expression can impact cell morphology (19). Epithelial cadherin (E-cadherin) was not expressed by 10 bevacizumab-naïve glioblastomas, 8 NBRGs, or 10 EBRGs (data not shown), consistent with rarity of glioblastoma E-cadherin expression reported elsewhere (20). Neuronal cadherin (N-cadherin), whose expression can alter cell morphology, increase invasiveness, and occurs during epithelial to mesenchymal transitions (EMTs) in cancer (21), was expressed by 20% of bevacizumab-naïve glioblastomas, 20% of EBRGs, and 100% of NBRGs (P<0.001; Supplementary Figure S11).
Given the potential impact of these cell morphology differences on tumor cell migration, which involves reorganizing the cytoskeleton to contract through tight spaces, or invasion, which involves extracellular matrix degradation, and our finding of greater tumor cell infiltration at the brain-tumor interface in NBRGs, we used Boyden chambers coated with control or matrigel inserts to measure the migration or invasion, respectively, of primary cells from NBRGs, EBRGs, and cells taken by image-guided biopsies from non-enhancing or enhancing regions of bevacizumab-naïve glioblastomas, and found nearly 4-fold more invasiveness in NBRG cells compared to EBRG cells or cells from non-enhancing versus enhancing regions of bevacizumab-naïve glioblastomas (P<0.05; Figure 4), with unchanged migration between the 4 groups (P=0.6; Figure 4).
Figure 4. Invasion and migration of tumor cells isolated from bevacizumab-naïve and bevacizumab-resistant glioblastomas (BRGs).
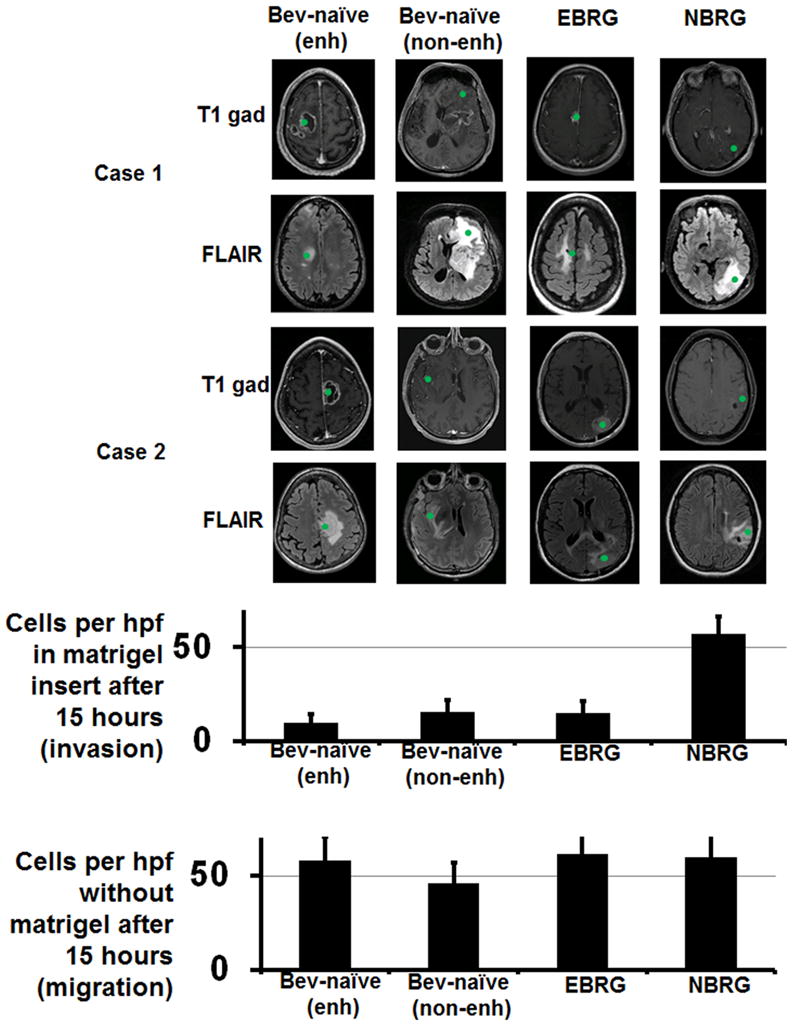
Cells were isolated from image-guided biopsies (green spots on MRIs) taken from the enhancing versus non-enhancing regions of bevacizumab-naïve glioblastomas, and from non-enhancing regions of an NBRG and enhancing regions of an EBRG (n=2 per group; location of biopsies from both patients in each of the 4 groups are shown on T1 gadolinium-enhanced and FLAIR axial MRI images). Shown in the upper graph are the number of cells from enhancing and non-enhancing areas of bevacizumab-naïve recurrent glioblastomas, EBRGs (n=2), and NBRGs invading through matrigel-coated Boyden chambers 15 hours after plating cells from fresh tissue specimens, a measure of invasion, with NBRG cells showing more invasion than cells from EBRGs or enhancing or non-enhancing areas of bevacizumab-naïve recurrent glioblastomas (P<0.05). Shown in the lower graph are the number of cells from these same 4 groups invading through matrigel-coated Boyden chambers 15 hours after plating cells taken from fresh tissue specimens, a measure of migration, with no change between groups (P=0.6).
Microarray analysis of bevacizumab-resistant glioblastomas and their paired pre-treatment specimens verifies 2 distinct phenotypes
Microarray analysis was used to analyze BRGs and their paired pre-bevacizumab-treatment tumors to identify gene expression changes associated with resistance. The 9 paired specimens (4 NBRGs and 5 EBRGs) from which RNA could be extracted were analyzed by microarrays. Unsupervised clustering of all 18 samples revealed no clustering tendency (Figure 5A). An unbiased gene selection approach in which differential gene expression data for each of the 9 pairs was clustered on high variance probes (top 98th percentile and above, 491 probes encompassing 478 unique genes) revealed two clustering patterns (Figures 5B–C). Analysis of the two clustering patterns revealed one to contain NBRGs and the other to contain EBRGs (Figures 5B–C), suggesting that these clustering patterns reflected differences in BRG gadolinium enhancement. After adjusting for multiple testing, 43 genes were differentially expressed in NBRGs versus EBRGs and 146 in EBRGs versus NBRGs with adjusted P<0.05, including NBRG expression of integrin α5, laminin, fibronectin1, and PDGFRβ, and EBRGs expressing mitogen- activated protein kinases 4 and 10, neural cell adhesion molecule-1 (NCAM-1), and aquaporin 4 (oncologically pertinent genes and gene subsets in Table 1; complete list of differentially expressed genes in Supplementary Tables S3–S4). Gene set enrichment analysis (GSEA) revealed that, relative to EBRGs, NBRGs exhibited significant (q-value adjusted for false discovery<0.01) increased expression of 245 of 13375 gene sets, including those describing wound healing, collagen production, and chemokine and cytokine-mediated inflammation, while, relative to NBRGs, EBRGs exhibited significant upregulation of 61 gene sets, including those describing central nervous system development (Table 1).
Figure 5. Microarray analysis of bevacizumab-resistant glioblastomas (BRGs).

(A) Unsupervised clustering of 18 tumor samples (9 before bevacizumab treatment and 9 after developing bevacizumab resistance) revealed no particular pattern of clustering. (B) An unbiased gene selection approach in which 9 differential gene expressions in 9 BRGs compared to their pre-treatment paired specimens were clustered on the high variance probes (top 98th percentile and above, 491 probes encompassing 478 unique genes; plotted data is median-centered) revealed that NBRGs clustered distinctly from EBRGs. There were 43 genes differentially expressed in NBRGs and 146 in EBRGs with adjusted P<0.05, including integrin α5, fibronectin1, laminin, and PDGFRβ in NBRGs and NCAM-1, aquaporin 4, and MAP kinases 4 and 10 in EBRGs. (C) Hierarchical clustering of the patterns of differential gene expression in BRGs compared to their paired pre-treatment specimens. Values at branches are AU p-values (left), BP values (right), and cluster labels (bottom). Clusters with AU≥95 are indicated by red rectangles. Case numbers in blue. (D) Real-time RT-PCR confirmed differential expression of integrin β1 (ITGB1) and CXCL12 in NBRGs (n=5) compared to EBRGs (n=6) (P<0.05).
Table 1. Differentially expressed genes and gene subets found in microarray analysis of EBRGs and NBRGs.
For comparisons of expression of specific genes in EBRGs versus NBRGs, P-values adjusted for multiple testing by controlling the false discovery rate are listed for representative genes with adjusted p<0.05. For comparisons of EBRGs and NBRGs to pre-treatment specimens (pre-EBRGs and pre-NBRGs), shown are representative genes (negative log FC = downregulated; positive log FC = upregulated) with raw p < 0.002, along with supportive references. For gene subsets, q values are adjusted for false discovery and representative subsets with q < 0.01 are shown.
| UPREGULATED GENES BY SUBTYPE | Log2 (fold change) | Adjusted P | Ref |
|---|---|---|---|
| EBRG genes (n=5; relative to 4 NBRGs) | |||
| 1. Mitogen activated protein kinase 4 | 3.3 | 0.01 | |
| 2. Mitogen activated protein kinase 10 | 2.1 | 0.01 | |
| 3. NCAM-1 | 1.8 | 0.03 | |
| 4. Aquaporin 4 | 3.3 | 0.02 | |
| NBRG genes (n=4; relative to 5 EBRGs) | |||
| 1. Integrin α5 | 1.4 | 0.03 | |
| 2. Fibronectin1 | 2.2 | 0.01 | |
| 3. Laminin, alpha 4 chain | 1.2 | 0.04 | |
| 4. Platelet Derived Growth Factor Receptor β (PDGFRβ) | 1.6 | 0.03 | |
| EBRG genes (n=5; relative to paired pre-EBRGs) | |||
| 1. angiopoietin 2 | −1.3 | 0.0001 | (45) |
| 2. integrin β1 | −1.0 | 0.0015 | (46) |
| 3. integrin α8 | −1.0 | 0.0010 | (47) |
| NBRG genes (n=4; relative to paired pre-NBRGs) | |||
| 1. Fibronectin1 | 1.4 | 0.0006 | (40) |
| 2. Neutrophin 3 | 1.5 | 0.001 | (43) |
| 3. Integrin α5 | 1.0 | 0.002 | (44) |
| 4. TWIST1 | 1.0 | 0.002 | (40) |
| 5. PDGFRβ | 1.1 | 0.002 | (28) |
| 6. CXCL12 | 1.1 | 0.002 | (42) |
| 7. Interleukin 6 | 1.1 | 0.002 | (48) |
| GENE SET ENRICHMENT ANALYSIS | q value |
|---|---|
| EBRGs (n=5; upregulated relative to 5 NBRGs) | |
| Central nervous system development | 1 × 10⁻⁵ |
| NBRGs (n=4; upregulated relative to 4 EBRGs) | |
| Regulation of wound healing | 3 × 10⁻³ |
| Collagen biosynthetic process | 9 × 10⁻³ |
| Collagen metabolic process | 3 × 10⁻³ |
| Collagen fibril organization | 2 × 10⁻³ |
| Inflammation mediated by chemokine and cytokine signaling pathways | 2 × 10⁻³ |
| EBRGs (n=5; altered relative to pre-EBRGs) | |
| Cell junctions (upregulated) | 3 × 10⁻⁴ |
| Intermediate filaments (downregulated) | 1 × 10⁻⁴ |
| Fibrillar collagen (downregulated) | 7 × 10⁻³ |
| NBRGs (n=4; altered relative to pre-NBRGs) | |
| Integrin signaling pathway (upregulated) | 5 × 10⁻⁹ |
| Extracellular matrix (upregulated) | 3 × 10⁻¹¹ |
| Collagen (upregulated) | 4 × 10⁻⁵ |
| Integrin binding (upregulated) | 9 × 10⁻⁴ |
| Metallopeptidase activity (upregulated) | 9.5 × 10⁻³ |
| Metalloendopeptidase activity (upregulated) | 8 × 10⁻³ |
| Response to wounding (upregulated) | 8 × 10⁻¹⁰ |
| Regulation of cell migration (upregulated) | 8 × 10⁻⁷ |
| Regulation of cell motility (upregulated) | 8 × 10⁻⁷ |
| Cell-matrix adhesion (upregulated) | 8 × 10⁻⁶ |
| Chemotaxis (upregulated) | 1 × 10⁻⁴ |
| Wnt receptor signaling pathway (upregulated) | 8 × 10⁻⁴ |
| M phase (downregulated) | 5 × 10⁻⁴ |
| M phase of mitotic cell cycle (downregulated) | 2 × 10⁻³ |
Abbreviations used – Ref = Reference.
We then identified transcriptional changes after bevacizumab resistance compared to before bevacizumab treatment in EBRGs and NBRGs. Compared to their pre-bevacizumab paired specimens, in EBRGs, 58 genes were upregulated and 64 downregulated with raw p values below 0.002 (Supplementary Table S5), including downregulated angiopoietin 2 and integrins β1 and α8 (Table 1). In NBRGs, 48 upregulated and 196 downregulated genes met this criterion (Supplementary Table S6), including upregulated integrinα5, fibronectin, TWIST1, and CXCL12 (Table 1). GSEA revealed that, relative to their pre-bevacizumab treated paired specimens, NBRGs exhibited significant (q-value adjusted for false discovery<0.01) increased expression of 348 of 13375 gene sets, including those describing integrin signaling, the extracellular matrix, invasion, and wound healing, with decreased expression of 40 gene sets, including those describing the mitotic phase of the cell cycle (Table 1). Relative to their pre-bevacizumab treated specimens, EBRGs upregulated 73 gene sets, including those describing cell junctions, and downregulated 50 gene sets, including those describing intermediate filaments and collagen (Table 1).
We then analyzed the expression of the 176 genes differentially expressed between EBRGs versus NBRGs for which adjusted p-values were below 0.05 in a control data set of previously published microarray data from 16 glioblastomas and their paired bevacizumab-naïve recurrences (22). No paired control cases exhibited differential gene expression of the 189 genes differentially expressed between EBRGs versus NBRGs in an EBRG or NBRG pattern, suggesting that these phenotypes might be BRG-specific rather than merely reflecting enhancing or non-enhancing growth patterns (Supplementary Figure S12).
Confirming gene expression changes using real time RT-PCR
Real time RT-PCR was used to confirm the differential expression of genes distinguishing EBRGs from NBRGs by microarray. Integrin β1, a downregulated invasion-mediating gene (23) in EBRGs identified by microarray, was upregulated in NBRGs and downregulated in EBRGs versus paired pre-treatment specimens (P<0.05), with no change in bevacizumab-naïve recurrent GBMs relative to their paired primary specimens (P>0.05) (Figure 5D). CXCL12, an invasion-mediating gene (24) upregulated in NBRGs by microarray was upregulated in NBRGs (P<0.05) and unchanged in EBRGs (P>0.05) versus paired pre-treatment specimens, with no change in bevacizumab-naïve recurrent GBMs relative to their paired primary specimens (P>0.05) (Figure 5D). We then used RT-PCR to measure expression of VEGF, VEGF receptor 2 (VEGFR2), and basic fibroblast growth factor (bFGF), factors that could influence anti-angiogenic therapy resistance (25) but were unaltered in microarray analysis. Expression of these factors was unchanged in BRGs compared to before bevacizumab treatment, and did not differ between EBRGs and NBRGs (P=0.5–0.8; Supplementary Figure S13). VEGF and VEGFR2 expression were further investigated at the protein level, with immunohistochemistry revealing no alteration in VEGF (P=0.7–0.8; Supplementary Figures S14A–B) or VEGFR2 (P=0.8–0.9, Supplementary Figures S15) staining in EBRGs or NBRGs versus paired pre-treatment specimens and Western blot revealing no alteration in VEGF expression in EBRGs versus NBRGs versus bevacizumab-naïve glioblastomas (Supplementary Figure S14C).
Validating the gene set whose expression changes reflected bevacizumab resistance pattern with additional paired specimens
To validate whether changes in expression of the 478 genes above reflected bevacizumab resistance patterns, 3 additional paired samples from glioblastomas before and after bevacizumab resistance underwent independent microarray analysis and radiographic volumetric analysis. MRI analysis revealed that all 3 tumors after bevacizumab resistance had gadolinium-enhancing volumes over 50% of their FLAIR-bright volumes (Supplementary Figure S16), consistent with EBRG numbers. Transcriptional profiling revealed that the differential expression of our 478 gene set in all 3 tumors matched the EBRG pattern from our primary dataset (Supplementary Figure S16).
Identifying genes whose pre-treatment expression predicted resistance patterns or survival after bevacizumab resistance
To investigate whether the pre-treatment transcriptional profile predicts the subsequent pattern of bevacizumab resistance, we identified the top 100 genes whose pre-treatment expression associated with the development of EBRG versus NBRG resistance patterns (Supplementary Table S7). To test these pre-treatment genes as predictors of resistance patterns, we compiled a secondary dataset of 15 bevacizumab-treated glioblastomas, whose pre-treatment tumors were transcriptionally profiled in a previous study (26). Five of these tumors were treated for 12 months before stopping bevacizumab electively without radiographic progression, while 10 progressed during bevacizumab treatment, with tissue from the bevacizumab-resistant tumors not available for these cases. Volumetric analysis of secondary dataset MRIs before and after progression during bevacizumab treatment confirmed that, in some tumors, over 50% of the FLAIR bright volume was enhancing (n=3), consistent with EBRGs, while, in the remaining tumors (n=7), less than 10% of the FLAIR-bright volume was enhancing, consistent with NBRGs. As with our primary dataset, in our secondary dataset, pre-treatment MRIs lacked a non-enhancing pattern (Supplementary Figure S17A) and EBRGs and NBRGs exhibited similar bevacizumab treatment duration (24 weeks NBRGs versus 19 weeks EBRGs; P=0.5).
The top 100 genes in pre-treatment tumors associating with EBRG versus NBRG development in our primary dataset (Supplementary Table S7) failed to predict resistance patterns in our secondary dataset (Supplementary Figure S17B). Furthermore, the top 100 pre-treatment genes associating with resistance pattern in the secondary dataset (Supplementary Table S8) failed to predict resistance pattern in our primary dataset (Supplementary Figure S17C). There was one common gene between the top 100 genes predicting resistance pattern in our primary and secondary datasets, VHLL, a Von Hippel-Lindau tumor suppressor homologue, with expression elevated in pre-treatment EBRGs versus pre-treatment NBRGs. VHLL expression increased in each tumor developing non-enhancing resistance and decreased in each tumor developing enhancing bevacizumab resistance (Supplementary Figure S17D). Thus, while there was a gene set whose differential expression after bevacizumab resistance versus before was associated with resistance pattern, there was no pre-treatment gene set predicting which resistance pattern would develop or whether a complete treatment course could be completed without resistance.
We also investigated whether pre-treatment gene expression correlated with survival after starting bevacizumab treatment by identifying the top 1000 genes associated with OS in our primary (Supplementary Table S9) and secondary datasets (Supplementary Table S10), of which only 14 genes were in common (Supplementary Table S11), with one, transforming growth factor, beta-induced (TGFBI), promoting decreased OS with increased pre-treatment expression and possessing oncologic functions as an extracellular matrix protein (27). Similar analysis identifying the top 1000 genes associated with progression free survival (PFS) in our primary and secondary datasets revealed 10 common genes (Supplementary Table S12), with one oncologically pertinent gene, neurofibromin (merlin) (28), promoting decreased PFS with increased pre-treatment expression.
Gene expression-based classification of BRGs and their paired pre-treatment specimens into molecular subtypes
Classification of tumors with sufficient genetic material into the 3 glioblastoma subtypes described by Phillips et al. (22) revealed that, after bevacizumab resistance, 3 EBRGs transitioned from mesenchymal to proneural and 3 NBRGs transitioned from proneural or proliferative to mesenchymal. BRG classification per the 4 subtypes defined using The Cancer Genome Atlas (TCGA) (28) did not change after bevacizumab resistance (Supplementary Table S2).
DISCUSSION
Despite encouraging results in clinical trials (1, 2), the benefit of bevacizumab in glioblastoma is typically transient, followed by tumor growth resumption, a phenomenon found in other cancers treated with anti-angiogenic therapy (5) and associated with a poor prognosis (13). Anti-angiogenic therapy resistance has been associated with increased tumor cell invasion (10, 11), although other mechanisms, including recruitment of bone marrow-derived cells to tumors (29), have also been suggested.
In our radiographic analysis of 21 bevacizumab-resistant glioblastomas, over half, which we called enhancing bevacizumab-resistant glioblastomas (EBRGs), exhibited enhancing growth on MRI that has defined glioblastoma recurrence since the 1990 advent of the Macdonald response criteria (30). The remaining cases, termed non-enhancing bevacizumab-resistant glioblastomas (NBRGs), were characterized by non-enhancing FLAIR-bright growth on MRI which has been associated with glioblastoma recurrence since revised treatment response criteria were put forth by the Response Assessment in Neuro-Oncology (RANO) group in 2010 (15) to recognize changes in the presentation of recurrent glioblastoma since the advent of anti-angiogenic therapy. While the initial identification of non-enhancing recurrence after bevacizumab treatment led some to suggest that the phenomenon was common, subsequent studies (6, 8) and review of 74 glioblastomas progressing during anti-angiogenic therapy at our institution (unpublished observations) showed that 60–75% of glioblastomas progressing during anti-angiogenic therapy are enhancing local recurrences.
Other investigators have correlated glioblastoma PFS and OS after bevacizumab with the pre-treatment ratio of the FLAIR bright volume to the T1 gadolinium enhanced volume (31). Our analysis expands upon these observations by finding 2 radiographic subtypes of glioblastomas progressing during bevacizumab treatment and showing distinct transcriptional phenotypes for each subtype, with the functional correlate of increased cellular invasiveness in one subtype. Invasion, proliferation, and hypoxia have not correlated well in prior glioblastoma studies (32, 33) and did not correlate well in our bevacizumab-naïve glioblastomas, so it is possible that the trend we observed of NBRGs becoming more hypoxic, more invasive, and equally proliferative relative to pre-treatment may occur specifically after resistance to anti-angiogenic therapy.
An unbiased gene selection approach in which differential gene expression measuring changes in expression after bevacizumab resistance compared to before was clustered on high variance probes revealed two clustering patterns, analysis of which confirmed one to be NBRGs and the other EBRGs. Immunohistochemistry showed that NBRGs, which exhibit FLAIR-bright non-enhancing tumor progression on MRI that has been associated with devascularized infiltration (6), maintained the hypoxia and reduced vascularity reported after successful bevacizumab treatment (34), and showed unchanged proliferation marker expression compared to before bevacizumab treatment. The unchanged tumor cell proliferation in NBRGs could reflect reliance on invasion, particularly perivascular invasion, to reduce angiogenesis dependence by allowing cellular migration away from devascularized areas into areas closer to blood vessels, rather than continuing the nodular enhancing exponential growth that is difficult to sustain during VEGF blockade. Conversely, EBRGs, which exhibit MRI enhancement potentially consistent with neovascularization, reacquired the reduced hypoxia and increased vascularity seen before bevacizumab treatment, which may have contributed to the observed increased cell proliferation compared to before bevacizumab treatment.
These differences in tumor cells and the tumor microenvironment between EBRGs and NBRGs were reflected in the genes found to be differentially transcribed between EBRGs versus NBRGs. Specifically, the transcriptional data showed upregulation in NBRGs of integrin α5β1 and two of its ligands, fibronectin and laminin. Increased tumor cell expression of α5β1 could bind upregulated fibronectin or laminin in the vascular basement membrane, possibly promoting perivascular invasion as a mechanism of anti-angiogenic therapy resistance. Conversely, EBRGs exhibited increased expression of aquaporin 4, which promotes vascular proliferation (35), possibly allowing EBRGs to reacquire their pre-treatment vessel densities and obtain the blood supply needed for the increased cellular proliferation we found in EBRGs, as evidenced by increased Ki-67 staining and increased MAPK4 and MAPK10 expression. We confirmed a functional impact of these molecular differences identified in the microarray analysis by demonstrating NBRG cells to be more invasive in matrigel-coated Boyden chambers than EBRG cells. The hypothesis that the transcriptional reprogramming we identified is specific to bevacizumab resistance rather than merely reflecting differences between non-enhancing versus enhancing glioblastoma is supported by 3 lines of evidence. First, array data on glioblastomas and their paired bevacizumab-naïve recurrences did not cluster towards either an EBRG or NBRG pattern using the gene set we compiled by microarray analysis. Second, confirmatory RT-PCR showed no alteration in bevacizumab-naïve recurrent glioblastomas relative to their paired initial tumors of transcripts altered in NBRGs or EBRGs. Third, genes we identified to be differentially expressed between EBRGs versus NBRGs did not overlap with previously reported genes differentially expressed between enhancing versus non-enhancing glioblastoma, such as the 79 genes differentially expressed between incompletely versus completely enhancing glioblastomas (36) or the 643 genes differentially expressed between the enhancing periphery and the central necrotic core of glioblastoma (37).
It has been suggested that EMT, a phenomenon recognized in non-CNS malignancies and associated with a worsened prognosis, metastases, and chemotherapy resistance (21), can occur after anti-angiogenic therapy (38). Some have proposed EMT in glioblastoma (39), but it remains unclear what the equivalent of a non-migratory epithelial state or a mesenchymal state with metastatic potential is in glioblastoma. While the glioblastoma subtypes of Phillips et al. (22) and the TCGA subtypes (28) included a mesenchymal subtype, it is unclear whether these mesenchymal subtypes embody EMT features, and the unchanging nature of TCGA subtypes implies that they do not detect EMT. Regardless, our findings that NBRGs had (i) examples that converted to the Phillips et al. (22) mesenchymal subtype after bevacizumab resistance; (ii) increased frequency of N-cadherin expression, a feature of EMT in non-CNS tumors (21); (iii) increased expression of TWIST1, an EMT-regulating transcription factor (40); and (iv) mesenchymal morphology with structures resembling pseudopodia (41) suggest that further work to determine what constitutes EMT in glioblastoma and under what conditions anti-angiogenic therapy promotes EMT is warranted.
While immunostaining primary tumor cells from BRGs revealed differences in N-cadherin expression between NBRGs and EBRGs, N-cadherin gene expression was unaltered by adjusted p-value in microarray analysis. This discrepancy between microarray data and immunostaining suggests possible post-transcriptional or translational regulation in addition to the transcriptional differences we identified, a possible subject for future work.
There are limitations to any study utilizing infrequently available clinical specimens. The first limitation, present in over half the cases analyzed, is that bevacizumab is usually combined with other treatments. However, there was no differential tendency for combination treatment in EBRGs versus NBRGs. Furthermore, the large number of genes changes in common between tumors, regardless of other treatments received, along with evidence supporting these genes as potential mediators of anti-angiogenic therapy resistance (28, 40, 42–48), suggests that additional treatments did not confound our analysis. A second limitation is small sample size, reflecting the few cases undergoing surgery after progression during bevacizumab treatment for which pre-treatment tissue was available. While it is possible that an expanded sample size could uncover other resistance patterns with mediators distinct from those listed here, our sample size was large enough to uncover statistically significant clustering of tumors resistant to anti-angiogenic therapy by differentially expressed genes and provides a platform to guide further efforts to define and disrupt resistance to anti-angiogenic therapy. A third limitation is that our study selected BRGs amenable to surgical resection. While one might hypothesize that selecting surgically resectable cases would bias our study towards enhancing local recurrences, we found 57% of resected recurrences to be EBRGs, less than the 74% of overall progressions on bevacizumab treatment that were enhancing local during this time period (unpublished observations). Regardless, by studying cases of bevacizumab resistance leading to surgery, a necessity to study this tissue, our findings may not be applicable to unresectable bevacizumab-resistant tumors. A fourth limitation is that, while a comparison of NBRGs to EBRGs revealed several genes with adjusted p values below 0.05, no differentially expressed oncologically pertinent transcripts in NBRGs or EBRGs relative to their paired pre-bevacizumab-treated tumors had significant adjusted p-values, despite having significant raw p-values, and some exhibited low upregulation (Table 1). However, these oncologically pertinent transcripts had prior evidence (28, 40, 42–48) supporting their potential involvement in anti-angiogenic therapy resistance, reducing concerns about needing to adjust for multiple testing (49) and suggesting that their raw p-values being statistically significant is sufficient to render them appropriate for further investigation, while the fold changes we detected by real time RT-PCR were higher than those detected by microarray and, have been suggested by some to better reflect changes in individual transcript levels (49).
Thus, just as prolonged treatment with temozolomide, the current standard of care for newly diagnosed glioblastoma, can create a “hypermutator” phenotype associated with recurrence (50), VEGF-targeted treatments like bevacizumab may cause “hyperinvasive” (NBRG) or “hyperproliferative” (EBRG) phenotypes associated with glioblastoma recurrence. These findings provide important biologic insight into how tumors counteract anti-angiogenic treatments, responses that have unfortunately limited the efficacy of anti-angiogenic therapies used in patients to date.
Supplementary Material
STATEMENT OF TRANSLATIONAL RELEVANCE.
Initial successes of angiogenesis inhibitors were tempered by their failure to produce enduring anticancer responses. Here, we describe 2 phenotypes of glioblastomas developing resistance to anti-angiogenic therapy with distinct molecular and radiographic profiles. The first exhibited enhancing nodular MRI growth; expressed mitogen activated protein kinases and aquaporin 4; and exhibited unchanged vascularity and hypoxia and increased proliferation compared to paired pre-treatment tumors. The second had non-enhancing poorly circumscribed MRI growth; expressed α5β1 integrin, laminin, and fibronectin; and exhibited less vascularity, more hypoxia, and unchanged proliferation compared to paired pre-treatment tumors. The translational significance of these findings is twofold. First, our data reveal heterogeneous tumor responses to hypoxia induced by anti-angiogenic therapy – some respond with neovascularization and proliferation, others with perivascular invasion. Second, targeting mediators of these responses that we identified could disrupt resistance to anti-angiogenic therapy, allowing these treatments to fulfill their therapeutic promise.
Acknowledgments
This work was supported in part by funding to the laboratory of MKA from the American Brain Tumor Association, the James S. McDonnell Foundation, the American Cancer Society, the NIH (5K02NS64167-2), and the UCSF Brain Tumor SPORE CA097257. Joanna S. Phillips provided neuropathology assistance, and Claudia Petritsch and Susan Chang reviewed the manuscript. The secondary pre-treatment dataset arose from work supported by Genentech (South San Francisco, CA) and the State of California through the University of California Industry-University Cooperative Research Discovery Grant (Bio05-10501). A.J. is an HHMI Research Fellow.
References
- 1.Vredenburgh JJ, Desjardins A, Herndon JE, 2nd, Marcello J, Reardon DA, Quinn JA, et al. Bevacizumab plus irinotecan in recurrent glioblastoma multiforme. J Clin Oncol. 2007;25:4722–9. doi: 10.1200/JCO.2007.12.2440. [DOI] [PubMed] [Google Scholar]
- 2.Vredenburgh JJ, Desjardins A, Herndon JE, 2nd, Dowell JM, Reardon DA, Quinn JA, et al. Phase II trial of bevacizumab and irinotecan in recurrent malignant glioma. Clin Cancer Res. 2007;13:1253–9. doi: 10.1158/1078-0432.CCR-06-2309. [DOI] [PubMed] [Google Scholar]
- 3.Friedman HS, Prados MD, Wen PY, Mikkelsen T, Schiff D, Abrey LE, et al. Bevacizumab alone and in combination with irinotecan in recurrent glioblastoma. J Clin Oncol. 2009;27:4733–40. doi: 10.1200/JCO.2008.19.8721. [DOI] [PubMed] [Google Scholar]
- 4.Kreisl TN, Kim L, Moore K, Duic P, Royce C, Stroud I, et al. Phase II trial of single-agent bevacizumab followed by bevacizumab plus irinotecan at tumor progression in recurrent glioblastoma. J Clin Oncol. 2009;27:740–5. doi: 10.1200/JCO.2008.16.3055. [DOI] [PMC free article] [PubMed] [Google Scholar]
- 5.Jain RK, Duda DG, Clark JW, Loeffler JS. Lessons from phase III clinical trials on anti-VEGF therapy for cancer. Nat Clin Pract Oncol. 2006;3:24–40. doi: 10.1038/ncponc0403. [DOI] [PubMed] [Google Scholar]
- 6.Norden AD, Young GS, Setayesh K, Muzikansky A, Klufas R, Ross GL, et al. Bevacizumab for recurrent malignant gliomas: efficacy, toxicity, and patterns of recurrence. Neurology. 2008;70:779–87. doi: 10.1212/01.wnl.0000304121.57857.38. [DOI] [PubMed] [Google Scholar]
- 7.Gerstner ER, Frosch MP, Batchelor TT. Diffusion magnetic resonance imaging detects pathologically confirmed, nonenhancing tumor progression in a patient with recurrent glioblastoma receiving bevacizumab. J Clin Oncol. 2009;28:e91–3. doi: 10.1200/JCO.2009.25.0233. [DOI] [PubMed] [Google Scholar]
- 8.Pope WB, Xia Q, Paton VE, Das A, Hambleton J, Kim HJ, et al. Patterns of progression in patients with recurrent glioblastoma treated with bevacizumab. Neurology. 2011;76:432–7. doi: 10.1212/WNL.0b013e31820a0a8a. [DOI] [PubMed] [Google Scholar]
- 9.Jain R, Scarpace LM, Ellika S, Torcuator R, Schultz LR, Hearshen D, et al. Imaging response criteria for recurrent gliomas treated with bevacizumab: role of diffusion weighted imaging as an imaging biomarker. J Neurooncol. 2010;96:423–31. doi: 10.1007/s11060-009-9981-6. [DOI] [PubMed] [Google Scholar]
- 10.Du R, Lu KV, Petritsch C, Liu P, Ganss R, Passegue E, et al. HIF1alpha induces the recruitment of bone marrow-derived vascular modulatory cells to regulate tumor angiogenesis and invasion. Cancer Cell. 2008;13:206–20. doi: 10.1016/j.ccr.2008.01.034. [DOI] [PMC free article] [PubMed] [Google Scholar]
- 11.Paez-Ribes M, Allen E, Hudock J, Takeda T, Okuyama H, Vinals F, et al. Antiangiogenic therapy elicits malignant progression of tumors to increased local invasion and distant metastasis. Cancer Cell. 2009;15:220–31. doi: 10.1016/j.ccr.2009.01.027. [DOI] [PMC free article] [PubMed] [Google Scholar]
- 12.Rubenstein JL, Kim J, Ozawa T, Zhang M, Westphal M, Deen DF, et al. Anti-VEGF antibody treatment of glioblastoma prolongs survival but results in increased vascular cooption. Neoplasia. 2000;2:306–14. doi: 10.1038/sj.neo.7900102. [DOI] [PMC free article] [PubMed] [Google Scholar]
- 13.Clark AJ, Lamborn KR, Butowski NA, Chang SM, Prados MD, Clarke JL, et al. Neurosurgical management and prognosis of patients with glioblastoma that progress during bevacizumab treatment. Neurosurgery. 2011 doi: 10.1227/NEU.0b013e3182314f9d. [DOI] [PubMed] [Google Scholar]
- 14.Bergers G, Hanahan D. Modes of resistance to anti-angiogenic therapy. Nat Rev Cancer. 2008;8:592–603. doi: 10.1038/nrc2442. [DOI] [PMC free article] [PubMed] [Google Scholar]
- 15.Wen PY, Macdonald DR, Reardon DA, Cloughesy TF, Sorensen AG, Galanis E, et al. Updated response assessment criteria for high-grade gliomas: response assessment in neuro-oncology working group. J Clin Oncol. 2010;28:1963–72. doi: 10.1200/JCO.2009.26.3541. [DOI] [PubMed] [Google Scholar]
- 16.Collins TJ. ImageJ for microscopy. Biotechniques. 2007;43:25–30. doi: 10.2144/000112517. [DOI] [PubMed] [Google Scholar]
- 17.Wykoff CC, Beasley NJ, Watson PH, Turner KJ, Pastorek J, Sibtain A, et al. Hypoxia-inducible expression of tumor-associated carbonic anhydrases. Cancer Res. 2000;60:7075–83. [PubMed] [Google Scholar]
- 18.Levi-Schaffer F, Slovik D, Armetti L, Pickholtz D, Touitou E. Activation and inhibition of mast cells degranulation affect their morphometric parameters. Life Sci. 2000;66:PL283–90. doi: 10.1016/s0024-3205(00)00538-5. [DOI] [PubMed] [Google Scholar]
- 19.Handschuh G, Candidus S, Luber B, Reich U, Schott C, Oswald S, et al. Tumour-associated E-cadherin mutations alter cellular morphology, decrease cellular adhesion and increase cellular motility. Oncogene. 1999;18:4301–12. doi: 10.1038/sj.onc.1202790. [DOI] [PubMed] [Google Scholar]
- 20.Lewis-Tuffin LJ, Rodriguez F, Giannini C, Scheithauer B, Necela BM, Sarkaria JN, et al. Misregulated E-cadherin expression associated with an aggressive brain tumor phenotype. PLoS One. 2010;5:e13665. doi: 10.1371/journal.pone.0013665. [DOI] [PMC free article] [PubMed] [Google Scholar]
- 21.Thiery JP. Epithelial-mesenchymal transitions in tumour progression. Nat Rev Cancer. 2002;2:442–54. doi: 10.1038/nrc822. [DOI] [PubMed] [Google Scholar]
- 22.Phillips HS, Kharbanda S, Chen R, Forrest WF, Soriano RH, Wu TD, et al. Molecular subclasses of high-grade glioma predict prognosis, delineate a pattern of disease progression, and resemble stages in neurogenesis. Cancer Cell. 2006;9:157–73. doi: 10.1016/j.ccr.2006.02.019. [DOI] [PubMed] [Google Scholar]
- 23.Poincloux R, Collin O, Lizarraga F, Romao M, Debray M, Piel M, et al. Contractility of the cell rear drives invasion of breast tumor cells in 3D Matrigel. Proc Natl Acad Sci U S A. 2011;108:1943–8. doi: 10.1073/pnas.1010396108. [DOI] [PMC free article] [PubMed] [Google Scholar]
- 24.Hong X, Jiang F, Kalkanis SN, Zhang ZG, Zhang XP, DeCarvalho AC, et al. SDF-1 and CXCR4 are up-regulated by VEGF and contribute to glioma cell invasion. Cancer Lett. 2006;236:39–45. doi: 10.1016/j.canlet.2005.05.011. [DOI] [PubMed] [Google Scholar]
- 25.Batchelor TT, Sorensen AG, di Tomaso E, Zhang WT, Duda DG, Cohen KS, et al. AZD2171, a pan-VEGF receptor tyrosine kinase inhibitor, normalizes tumor vasculature and alleviates edema in glioblastoma patients. Cancer Cell. 2007;11:83–95. doi: 10.1016/j.ccr.2006.11.021. [DOI] [PMC free article] [PubMed] [Google Scholar]
- 26.Chen R, Nishimura MC, Bumbaca SM, Kharbanda S, Forrest WF, Kasman IM, et al. A hierarchy of self-renewing tumor-initiating cell types in glioblastoma. Cancer Cell. 2010;17:362–75. doi: 10.1016/j.ccr.2009.12.049. [DOI] [PubMed] [Google Scholar]
- 27.Ahmed AA, Mills AD, Ibrahim AE, Temple J, Blenkiron C, Vias M, et al. The extracellular matrix protein TGFBI induces microtubule stabilization and sensitizes ovarian cancers to paclitaxel. Cancer Cell. 2007;12:514–27. doi: 10.1016/j.ccr.2007.11.014. [DOI] [PMC free article] [PubMed] [Google Scholar]
- 28.Verhaak RG, Hoadley KA, Purdom E, Wang V, Qi Y, Wilkerson MD, et al. Integrated genomic analysis identifies clinically relevant subtypes of glioblastoma characterized by abnormalities in PDGFRA, IDH1, EGFR, and NF1. Cancer Cell. 2010;17:98–110. doi: 10.1016/j.ccr.2009.12.020. [DOI] [PMC free article] [PubMed] [Google Scholar]
- 29.Shojaei F, Wu X, Malik AK, Zhong C, Baldwin ME, Schanz S, et al. Tumor refractoriness to anti-VEGF treatment is mediated by CD11b+Gr1+ myeloid cells. Nat Biotechnol. 2007;25:911–20. doi: 10.1038/nbt1323. [DOI] [PubMed] [Google Scholar]
- 30.Macdonald DR, Cascino TL, Schold SC, Jr, Cairncross JG. Response criteria for phase II studies of supratentorial malignant glioma. J Clin Oncol. 1990;8:1277–80. doi: 10.1200/JCO.1990.8.7.1277. [DOI] [PubMed] [Google Scholar]
- 31.Ellingson BM, Cloughesy TF, Lai A, Nghiemphu PL, Mischel PS, Pope WB. Quantitative volumetric analysis of conventional MRI response in recurrent glioblastoma treated with bevacizumab. Neuro Oncol. 2011;13:401–9. doi: 10.1093/neuonc/noq206. [DOI] [PMC free article] [PubMed] [Google Scholar]
- 32.Evans SM, Jenkins KW, Chen HI, Jenkins WT, Judy KD, Hwang WT, et al. The Relationship among Hypoxia, Proliferation, and Outcome in Patients with De Novo Glioblastoma: A Pilot Study. Transl Oncol. 2010;3:160–9. doi: 10.1593/tlo.09265. [DOI] [PMC free article] [PubMed] [Google Scholar]
- 33.Khoshyomn S, Lew S, DeMattia J, Singer EB, Penar PL. Brain tumor invasion rate measured in vitro does not correlate with Ki-67 expression. J Neurooncol. 1999;45:111–6. doi: 10.1023/a:1006375316331. [DOI] [PubMed] [Google Scholar]
- 34.Hattingen E, Jurcoane A, Bahr O, Rieger J, Magerkurth J, Anti S, et al. Bevacizumab impairs oxidative energy metabolism and shows antitumoral effects in recurrent glioblastomas: a 31P/1H MRSI and quantitative magnetic resonance imaging study. Neuro Oncol. 2011 doi: 10.1093/neuonc/nor132. [DOI] [PMC free article] [PubMed] [Google Scholar]
- 35.Warth A, Simon P, Capper D, Goeppert B, Tabatabai G, Herzog H, et al. Expression pattern of the water channel aquaporin-4 in human gliomas is associated with blood-brain barrier disturbance but not with patient survival. J Neurosci Res. 2007;85:1336–46. doi: 10.1002/jnr.21224. [DOI] [PubMed] [Google Scholar]
- 36.Pope WB, Chen JH, Dong J, Carlson MR, Perlina A, Cloughesy TF, et al. Relationship between gene expression and enhancement in glioblastoma multiforme: exploratory DNA microarray analysis. Radiology. 2008;249:268–77. doi: 10.1148/radiol.2491072000. [DOI] [PMC free article] [PubMed] [Google Scholar]
- 37.Van Meter T, Dumur C, Hafez N, Garrett C, Fillmore H, Broaddus WC. Microarray Analysis of MRI-defined Tissue Samples in Glioblastoma Reveals Differences in Regional Expression of Therapeutic Targets. Diagnostic Molecular Pathology. 2006;15:195–205. doi: 10.1097/01.pdm.0000213464.06387.36. [DOI] [PubMed] [Google Scholar]
- 38.Carbone C, Moccia T, Zhu C, Paradiso G, Budillon A, Chiao PJ, et al. Anti-VEGF treatment-resistant pancreatic cancers secrete proinflammatory factors that contribute to malignant progression by inducing an EMT cell phenotype. Clin Cancer Res. 2011;17:5822–32. doi: 10.1158/1078-0432.CCR-11-1185. [DOI] [PMC free article] [PubMed] [Google Scholar]
- 39.Carro MS, Lim WK, Alvarez MJ, Bollo RJ, Zhao X, Snyder EY, et al. The transcriptional network for mesenchymal transformation of brain tumours. Nature. 2010;463:318–25. doi: 10.1038/nature08712. [DOI] [PMC free article] [PubMed] [Google Scholar]
- 40.Mikheeva SA, Mikheev AM, Petit A, Beyer R, Oxford RG, Khorasani L, et al. TWIST1 promotes invasion through mesenchymal change in human glioblastoma. Mol Cancer. 2010;9:194. doi: 10.1186/1476-4598-9-194. [DOI] [PMC free article] [PubMed] [Google Scholar]
- 41.Shankar J, Messenberg A, Chan J, Underhill TM, Foster LJ, Nabi IR. Pseudopodial actin dynamics control epithelial-mesenchymal transition in metastatic cancer cells. Cancer Res. 2010;70:3780–90. doi: 10.1158/0008-5472.CAN-09-4439. [DOI] [PubMed] [Google Scholar]
- 42.Aghi M, Cohen KS, Klein RJ, Scadden DT, Chiocca EA. Tumor stromal-derived factor-1 recruits vascular progenitors to mitotic neovasculature, where microenvironment influences their differentiated phenotypes. Cancer Res. 2006;66:9054–64. doi: 10.1158/0008-5472.CAN-05-3759. [DOI] [PubMed] [Google Scholar]
- 43.Cristofaro B, Stone OA, Caporali A, Dawbarn D, Ieronimakis N, Reyes M, et al. Neurotrophin-3 is a novel angiogenic factor capable of therapeutic neovascularization in a mouse model of limb ischemia. Arterioscler Thromb Vasc Biol. 2010;30:1143–50. doi: 10.1161/ATVBAHA.109.205468. [DOI] [PMC free article] [PubMed] [Google Scholar]
- 44.Hikawa T, Mori T, Abe T, Hori S. The ability in adhesion and invasion of drug-resistant human glioma cells. J Exp Clin Cancer Res. 2000;19:357–62. [PubMed] [Google Scholar]
- 45.Huang H, Lai JY, Do J, Liu D, Li L, Del Rosario J, et al. Specifically targeting angiopoietin-2 inhibits angiogenesis, Tie2-expressing monocyte infiltration, and tumor growth. Clin Cancer Res. 2011;17:1001–11. doi: 10.1158/1078-0432.CCR-10-2317. [DOI] [PubMed] [Google Scholar]
- 46.Piao Y, Lu L, de Groot J. AMPA receptors promote perivascular glioma invasion via beta1 integrin-dependent adhesion to the extracellular matrix. Neuro Oncol. 2009;11:260–73. doi: 10.1215/15228517-2008-094. [DOI] [PMC free article] [PubMed] [Google Scholar]
- 47.Scherberich A, Tucker RP, Degen M, Brown-Luedi M, Andres AC, Chiquet-Ehrismann R. Tenascin-W is found in malignant mammary tumors, promotes alpha8 integrin-dependent motility and requires p38MAPK activity for BMP-2 and TNF-alpha induced expression in vitro. Oncogene. 2005;24:1525–32. doi: 10.1038/sj.onc.1208342. [DOI] [PubMed] [Google Scholar]
- 48.Wei LH, Kuo ML, Chen CA, Chou CH, Lai KB, Lee CN, et al. Interleukin-6 promotes cervical tumor growth by VEGF-dependent angiogenesis via a STAT3 pathway. Oncogene. 2003;22:1517–27. doi: 10.1038/sj.onc.1206226. [DOI] [PubMed] [Google Scholar]
- 49.Leung YF, Cavalieri D. Fundamentals of cDNA microarray data analysis. Trends Genet. 2003;19:649–59. doi: 10.1016/j.tig.2003.09.015. [DOI] [PubMed] [Google Scholar]
- 50.Hunter C, Smith R, Cahill DP, Stephens P, Stevens C, Teague J, et al. A hypermutation phenotype and somatic MSH6 mutations in recurrent human malignant gliomas after alkylator chemotherapy. Cancer Res. 2006;66:3987–91. doi: 10.1158/0008-5472.CAN-06-0127. [DOI] [PMC free article] [PubMed] [Google Scholar]
Associated Data
This section collects any data citations, data availability statements, or supplementary materials included in this article.