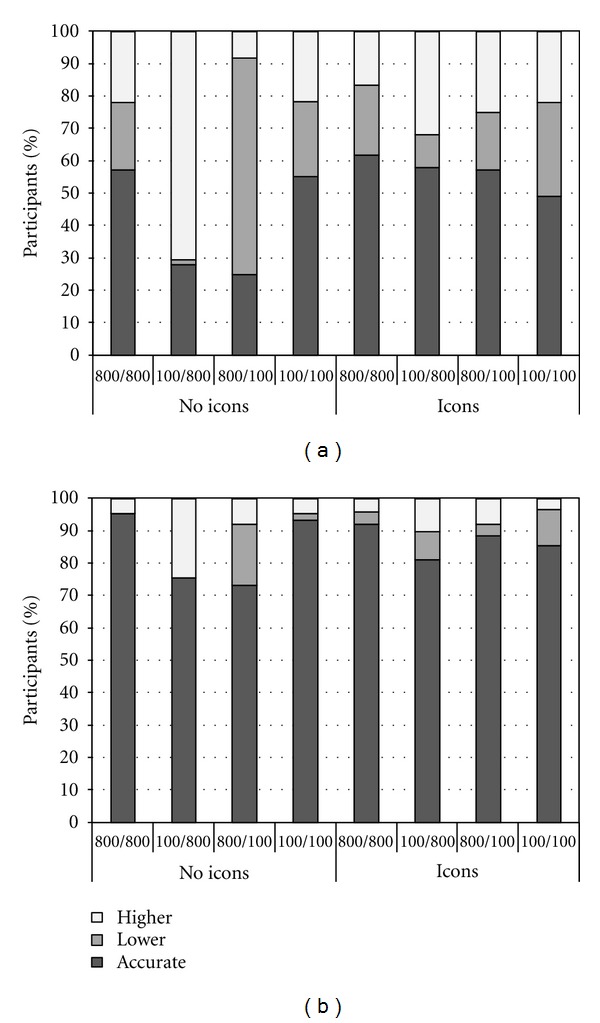
Figure 2.

(a) Percentage of participants with low numeracy whose estimates of risk reduction were accurate, lower, or higher than the exact value as a function of the sizes of the denominators and icon arrays. (b) Percentage of participants with high numeracy whose estimates of risk reduction were accurate, lower, or higher than the exact value as a function of the sizes of the denominators and icon arrays.
