

Abstract
Background:
The aim of this study was to identify the prevalence and risk factors for hypertension in a rural community in north-east India.
Materials and Methods:
A door-to-door survey was conducted amongst all residents of a village in Uttarakhand province. All residents were interviewed and data were was relating to the demographics of the individuals, dietary habits, alcohol consumption, tobacco use, psychosocial stress, past medical history and drug history. Blood pressure (BP) and anthropometric data was recorded and blood samples taken.
Results:
We identified 1348 people living in the village. Assessment was carried out on all those aged 15 years and over (n=968, 71.8%). Hypertension, defined as BP ≥ 140/90 mmHg or cases of known hypertensive on medication, were present in 30.9% (95% CI 25.6 to 36.0) of males and 27.8% (95% CI 23.4 to 32.2) of females. Standardisation to the World Health Organization (WHO) world population gives an overall prevalence of 32.3% (95% confidence interval, CI 28.9 to 35.8). Increasing age and higher body mass index (BMI) were independent predictors of hypertension in both sexes, with psychosocial stress an additional independent predictor in males.
Conclusions:
Rates of hypertension in the rural community under study are similar to those seen in high-income countries and in urban India. With the exception of age, all the risk factors identified were potentially modifiable.
Keywords: Cerebrovascular disease, epidemiology, global health, hypertension, India
INTRODUCTION
India, the world's largest democracy, is undergoing a rapid economic growth. This growth has been accompanied by demographic, lifestyle and cultural changes which have had a large impact on the health profile of India's citizens and placed a significant strain on the country's healthcare system.[1–3] Whilst such changes may be most obvious in major cities, such as Delhi and Mumbai, they are also likely to impact those living in the rural areas. Over 70% of India's population live in rural areas, yet access to government healthcare is much poorer than in urban areas, with twice the number of hospital beds available to urban dwellers per head of population.[4]
In India, cardiovascular diseases (CVDs) are estimated to be responsible for 1.5 million deaths annually.[5] Indeed, it is estimated that by 2020, CVDs will be the largest cause of mortality and morbidity in India.[6] Hypertension is a major risk factor for CVDs, including stroke and myocardial infarction, and its burden is increasing disproportionately in developing countries as they undergo demographic transition.[7–10] Using a cut-off of 140 mmHg or greater systolic blood pressure (BP), or 90 mmHg or greater diastolic BP, the age-standardised prevalence of hypertension worldwide in the year 2000 was estimated to be 26.6% in men (95% confidence interval, CI 26.0 to 27.2) and 26.1% in women (95% CI 25.5 to 26.6). This was estimated to rise to 29.0% in men (95% CI 28.6 to 29.4) and 29.5% in women (95% CI 29.1 to 29.9) by 2025.[10] It was estimated that around two-thirds of those with people with hypertension worldwide were living in developing countries (639 million) in 2000, and that this would rise to three-quarters living in developing countries (1.15 billion) by 2025.
Previous authors have suggested prevalence rates for hypertension in urban India to be 29-45% in men and 25-38% in women.[11–14] Hypertension is thought to be less common in rural areas, though data is limited and estimates vary widely depending on the methodology used.[15–18] Previously identified risk factors for hypertension in Indians include higher body mass index (BMI), abdominal obesity, greater age, greater alcohol consumption, sedentary lifestyle and stress.[11,16,18] All of these risk factors, together with hypertension itself, have been identified as risk factors for both stroke and myocardial infarction worldwide by the INTERSTROKE and INTERHEART study teams, and in this respect India appears to be no different to other parts of the world.[7,8] Nevertheless, as rural India continues to undergo demographic transition, the contribution of such risk factors to hypertension in India is likely to change. Studying these changes may give greater insight into how best to allocate resources to reduce the burden of hypertension on India's heath care system.
The primary aim of this study was to identify the prevalence of hypertension in a rural Indian population by means of a door-to-door survey. A secondary aim was to identify the risk factors for hypertension.
MATERIALS AND METHODS
Ethical approval for the study was obtained from Research and Ethics committee of the Himalayan Institute Health Trust (HIHT) University.
Setting and study population
The study site was a rural village located around 20 km from the city of Dehradun, the state capital of Uttarakhand province in north-east India, with the Himalayan Mountains to the north and the river Ganges to the east. There are approximately 15 villages within the region near Dehradun, with easy access from the HIHT University. The study village was chosen due to the established research links between the village and the research staff at the HIHT University. The village is representative of all the villages within the region. The site is approximately 250 km north-east of India's capital, Delhi. Data was collected between 17th March and 15th April 2010. The date for calculating the point prevalence was 1st of April 2010. All people living in the village on the prevalence date were included in the study, and we were able to collect demographic data on all residents, though some residents refused to undergo full assessment.
Health screening questionnaire
The questionnaire used was based on the WHO STEPwise approach to chronic disease risk factor surveillance (STEPS) questionnaire.[19] It was administered to participants in Hindi (the local language) by 20 field research teams. Each data collection team comprised of 2 persons (1 male and 1 female) who were either a final year medical student or a Bachelor of Science (BSc) nursing student from HIHT University. Each team was briefed and trained in the methodology of the questionnaire and a training manual was developed. To help reduce inter-observer variability, four supervisors drawn from the medical and nursing faculty of HIHT University, assisted the teams in data collection. Furthermore, every 10th questionnaire was checked by the supervisors. The questionnaire recorded basic demographic information (age, sex, education etc.) for each member of the household. Collecting accurate information on patient age was difficult, since very few people had a birth certificate. Age was calculated from birth year and confirmed using memory prompts, such as historical events, where the year of birth was in doubt. For those aged 15 years and above, information on tobacco use, alcohol intake, diet, history of hypertension, history of diabetes, psychosocial stress and disability was recorded. To asses stress, we employed the same tool as used in the INTERHEART study.[20] Briefly, stress was defined as feeling irritable, filled with anxiety, or as having sleeping difficulties as a result of conditions at work (question 1) or at home (question 2). We asked participants to report how often they had felt stress, using the following response options: 1) never; 2) some periods; 3) several periods; or 4) permanent stress. An answer of 3) or 4) to either question was taken as evidence of stress.
Blood pressure
BP was recorded in a sitting position using an A and D UA-767 BP monitor. One measurement was taken after five minutes of resting quietly. If this reading did not indicate hypertension then it was accepted, if it did indicate hypertension then a second reading was taken and this reading was reported for the purpose of the study. Hypertension was defined as BP ≥140 mmHg systolic or ≥90 mmHg diastolic BP, or a known hypertensive on medication. This is in accordance with the Joint National Committee ( JNC) V criteria.[21] A higher cut-off of BP ≥160 mmHg systolic or 100 mmHg diastolic BP was used to identify those with severe hypertension.
Anthropometric measurements
Weight was measured using a set of Krups weighing scales and was recorded to the nearest 0.5 kg. Height was measured in a standing position with shoes removed by using a wall mounted measuring tape. Hip and waist measurements were taken using a standard tape measure and recorded to the nearest 0.1 cm. Overweight was defined as BMI ≥ 25 kg/m2 and abdominal obesity was defined as waste to hip ratio ≥0.95 in males and ≥ 0.85 in females.
Blood samples
After the interview, blood samples were taken by a trained technician, working at HIHT University, from those who consented. The collected blood samples were transported back in ice and analysed within 6 hours of collection at the central laboratory of HIHT University using Beckmann Coulter Synchone CX9 autoanalyzer for random blood sugar and cholesterol levels. Dyslipidaemia was defined as total cholesterol ≥200 mg/dl.[22] Diabetes was defined as random blood sugar greater than 200 mg/dl.[23]
Statistical analysis
Age-standardisation was carried out using the direct method, with standardisation to the WHO world standard.[24] CIs for prevalence and for odds ratios (ORs) were calculated based on the assumptions of the binomial distribution. CIs for continuous variables were calculated from the normal distribution. The risk factor data were quantitative in nature and collected at a nominal, ordinal and interval/ratio level. They were analyzed using standard statistical software, PASW-18 for windows (Statistical Package for Social Sciences, SPSS, Chicago, IL, USA). No obvious outliers or influential cases were identified when data and residuals were examined. Hypertension was dichotomised into present or absent to compare associated variables. Mann-Whitney U tests (continuous variables) and odds ratios (dichotomous variables) were used to assess statistical significance of differences between those with hypertension and those without. Logistic regression analysis was used to identify independent predictors of hypertension. Stepwise methods were used to construct the model and the robustness of the model was checked by examination of residuals, Cook's distances, loading of variables on individual eigenvalues and collinearity diagnostic tests (variance inflation factor). A large value for the Wald statistic generally indicates that the predictor variable is a significant predictor of outcome and therefore makes a contribution to the predictive power of the model. Calculating Exp (β) from β, allows the relative change in the odds of the outcome occurring for a unit change in the predictor to be calculated. Significance was defined as P<0.05 for specific statistical tests or a 95% CI for an odds ratio that did not cross the value of 1.0, or 95% CIs for two comparable continuous variables that did not overlap. Two-tailed tests were used throughout. Missing values were treated as being missing completely at random.
RESULTS
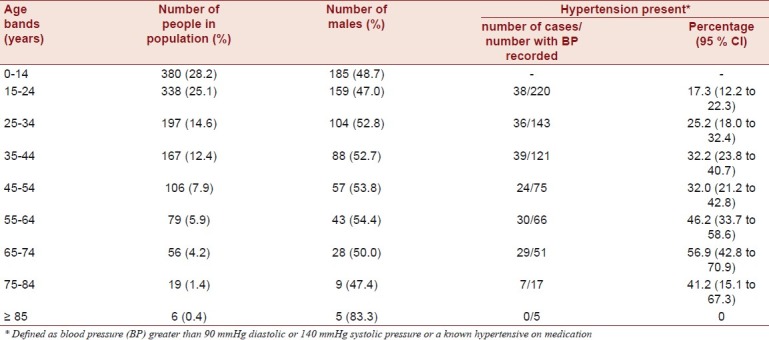
Within the study site, we identified 1348 people, living in 236 households. Assessment was carried out on all those aged 15 years and over (n=968, 71.8%). Demographic data for those aged 15 years and over are shown in Table 1. Of those aged 15 years and over, 724 (74.8%) consented to assessment using the health screening questionnaire, 703 (72.6%) consented to anthropometric measurement, 698 (72.1%) consented to have their BP measured and 319 (33.0%) consented to a blood sample being taken. Comparing those who had their BP recorded and those who did not, of the 270 who did not have BP recorded, only 79 (29.3%) were female, whilst of the 698 who did have their BP recorded, 396 (56.7%) were female. This difference is significant, OR 3.17 (95% CI 2.34 to 4.29). The mean age of those who did not have their BP taken was 31.0 years (95% CI 29.3 to 32.7) and the mean age of those who did have their BP recorded was 36.8 years (95% CI 35.5 to 38.1). For all 1348 people in the study site, the median age was 23 years (range 0-90). For those aged 15 years and over, the median age was 30 (inter-quartile range 21-45).
Table 1.
Demographic and hypertension data by age band (for those aged 15 years and over) as seen in the study
Prevalence of hypertension
Mean diastolic BP was 78.4 (95% CI 76.9 to 79.9) for males and 76.6 (95% CI 75.4 to 77.9) females. Mean systolic BP was 121.1 (95% CI 119.1 to 123.0) for males and 118.0 (95% CI 116.4 to 119.6) for females. Hypertension was present in 93 of the 302 males who had BP recorded (30.9%, 95% CI 25.6 to 36.0) and 110 of the 396 females who had BP recorded (27.8%, 95% CI 23.4 to 32.2). There was no significant difference in prevalence between males and females (95% CI for the difference -3.7 to 10.0). The prevalence increased with age as shown in Table 1. Hypertension was seen in over half of all 65-75 year olds, with the rate significantly higher than in the age bands below 45 years. Only 29 people had been treated with anti-hypertensive medication in the previous 2 weeks, and in only 22 of these (75.9%) was BP adequately controlled. Standardisation to the WHO world population gives an overall prevalence of 32.3% (95% CI 28.9 to 35.8).
Risk factors for hypertension
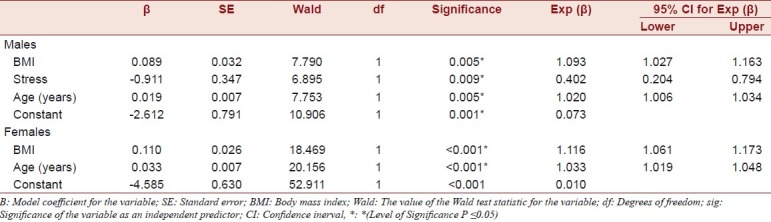
The crude prevalence of dyslipidaemia, diabetes, abdominal obesity and overweight are given in Table 2. Data on tobacco use, alcohol consumption, diet and stress are also presented. Compared to males, females had significantly higher odds of abdominal obesity (OR 3.72, 95% CI 2.64 to 5.24) and overweight (OR 2.25, 95% CI 1.42 to 3.55), but not dyslipidaemia or diabetes, compared to males. In males having hypertension was significantly associated with having had several periods of stress or permanent stress at work or at home (OR 2.56, 95% CI 1.32 to 4.96) and having consumed alcohol in the last 30 days (OR 1.95, 95% CI 1.14 to 3.33). Diet and smoking were not significantly associated with having hypertension. For males having hypertension was significantly associated (Mann-Whitney U test) with greater age (U = 7243.0, z = -3.483, P<0.001), greater BMI (U = 7398.0, z = -3.206, P=0.001), but not greater waist to hip ratio (U = 9404.0, z = -0.038, P=0.970), cholesterol levels (U = 2075.0, z = -0.266, P=0.790) or random blood sugar level (U = 1880.0, z = -1.159, P=0.246). In females, having hypertension was not associated with stress, random blood sugar level (U = 3433.5, z = -0.404, P=0.686), diet, smoking or alcohol consumption, but was significantly associated with greater age (U = 10513.5, z = -5.117, P<0.001), greater BMI (U = 9635.0, z = -5.832, P<0.001), greater waist to hip ratio (U = 12738.0, z = -2.888, P = 0.004) and cholesterol levels (U = 2827.5, z = -2.268, P = 0.023). By logistic regression, BMI, age and stress were independent predictors of hypertension in males, and BMI and age were independent predictors of hypertension in females [Table 3].
Table 2.
Cardiovascular disease risk factors by gender in those aged 15 years and over as seen in the study
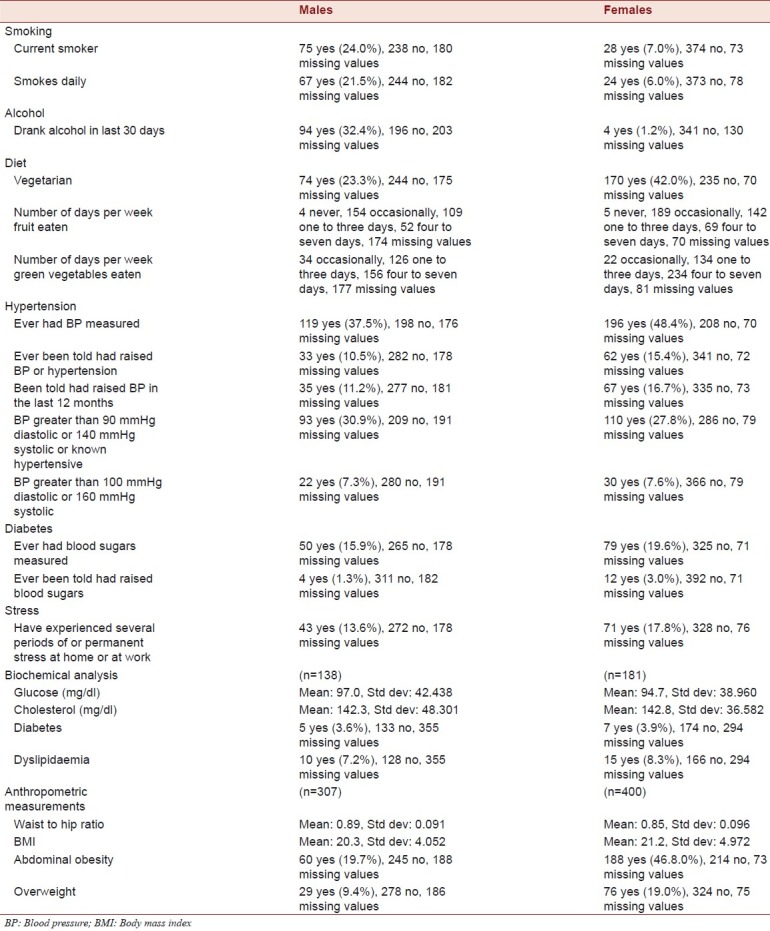
Table 3.
Regression model as seen in the study
Health screening
Of the 185 people with hypertension for whom data was available, 95 (51.4%) had their BP measured previously, but only 46 (24.9%) had it measured in the last 12 months. Only 50 people (27.0%) with hypertension had been previously told they had hypertension or raised BP. Furthermore, of 12 people with random blood sugar above 200 mg/dl, only 2 (16.7%) had been previously told they had diabetes.
DISCUSSION
Our results reveal the prevalence of hypertension in rural India to be similar to that seen in urban India and other world regions.[10] Although rates of hypertension in males were higher than in females, the difference was not significant. Recent reports of the prevalence of hypertension in urban India have suggested rates of 29.3-45.1% in men and 25.2-38.2% in women, with steady increases seen over the past 20 years.[11–14] Lower prevalence rates have been reported in rural areas, though with a steady increase in rates seen since the 1960s.[15–18] In 1994 Gupta et al. reported rates of 21.6% in 1982 men, and 15.7% in 1166 women aged 20 years and over, in rural western India, though much lower rates have also been reported.[11,16–18] The prevalence rates reported here are also similar to rates seen in other low- and middle-income countries, with rates in adults of 29% in rural, and 27% in urban Ghana,[25] and 25% in urban Cameroon[26] Reports of the prevalence of hypertension in high-income countries vary widely, with 17% prevalence reported in Greece, 20% in the United States, 38% in Japan and 40% in Spain in those aged 20 years and older.[10] Hypertension rates in Europe appear to be the highest of any world region with 44% of people aged 35 years and over being hypertensive, compared to only 28% in North America.[27]
It has been suggested by other researchers that urban rural differences may be, in part, due to diet and the stress of urban living. In our study in both males and females, age and high BMI were significant predictors of hypertension; which suggests that the main modifiable risk factor is overweight. Interestingly, stress was an independent predictor of hypertension in males. Although psychosocial stress has been implicated as a risk factor for hypertension in urban populations it has not been thought to be a major predictor of hypertension in those living rurally. Females were significantly more likely to be overweight and have abdominal obesity than males, although this did not translate into a higher prevalence of hypertension. It seems likely that, in females, factors relating to obesity may be the main modifiable risk factor for hypertension, whilst in males’ alcohol consumption and stress are also important risk factors.
There are a number of limitations of this study. Those who did not have their BP recorded were significantly younger and significantly more likely to be male. Although this may have resulted in some bias, we obtained a BP reading in 72.1% of those aged 15 years and over and the effect is likely to be relatively small. Our method of establishing BP was to only take a second measurement if the first measurement indicated hypertension. We acknowledge that this method is not the generally accepted method of taking three measurements at five minute intervals and then taking an average of the last two measurements. When we piloted our methods, we found that many participants were reluctant to undergo medical examination and testing. When asked to provide more than one BP reading many patients were reluctant to comply and, furthermore, were reluctant to continue with further screening and assessment. For this reason it was decided to use the method employed. Nevertheless, we feel that by taking a second measurement in any one who was deemed to have hypertension on the first reading, any bias that this is likely to have caused will be small. Similarly, a large number of people were unwilling to consent to a blood sample being taken. We found that many people were unwilling to give blood samples, unless there was deemed to be a direct health benefit in doing so. In the present survey, we did our best to increase the number of participants willing to consent to blood samples being taken by enlisting the help of village elders and village heads. We also held pre-survey brief meetings with villagers to help reassure them. Although the limited data set may impact on the ability to generalize the results of the random blood sugar and cholesterol tests, we feel that this limitation would have been found in many Indian communities, both rural and urban. We are unable to report on the influence of physical exercise on hypertension rates, although the higher levels of obesity seen in females may be a useful proxy for physical exercise and indicate higher levels of physical activity in males. Finally, we accept that data relating to tobacco and alcohol consumption may be unreliable. In particular, traditionally alcohol consumption is often frowned upon in many rural and urban communities in India, and alcohol is rarely consumed in public. Such social stigma may have led to significant under-reporting. We have treated all missing values as being missing completely at random. Whilst we recognise that it may have been possible to use methods of imputation, we feel that this would have skewed our data unnecessarily and the most pragmatic approach was to present the raw data as collected.
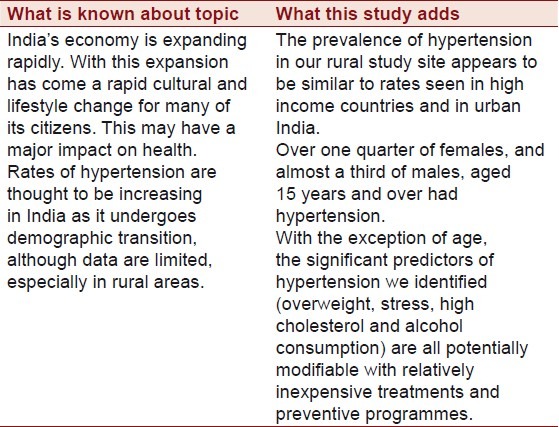
The key findings from our study are presented in Table 4. Future work should focus on comparing this data to other populations in India, such as those living in urban settings. Long-term follow-up of this cohort is required and would provide important longitudinal data. In summary, the prevalence of hypertension in our rural study site appears to be similar to rates seen in high-income countries, sub-Saharan Africa and in urban India. Over one quarter of females, and almost a third of males, aged 15 years and over had hypertension. With the exception of age, the significant predictors of hypertension we identified are all potentially modifiable with relatively inexpensive treatments and preventive programmes. The Indian healthcare system is estimated to have one of the highest burden of disease compared to any other country in the world.[4] As India continues to undergo economic growth and demographic transition, this burden is likely to increase. Identifying and controlling hypertension may be one of the most important and least expensive ways in which India can help to control its disease burden in the coming decades.
Table 4.
Summary table
Footnotes
Source of Support: Nil,
Conflict of Interest: None declared.
REFERENCES
- 1.Yusuf S, Reddy S, Ounpuu S, Anand S. Global burden of cardiovascular diseases: Part 1: General considerations, the epidemiologic transition, risk factors, and impact of urbanization. Circulation. 2001;104:2746–53. doi: 10.1161/hc4601.099487. [DOI] [PubMed] [Google Scholar]
- 2.The World Health Report 2008: Primary Health Care - Now More Than Ever. Geneva, Switzerland: World Health Organization; 2008. World Health Organization. [Google Scholar]
- 3.Horton R, Das P. Indian health: The path from crisis to progress. Lancet. 2011;377:181–3. doi: 10.1016/S0140-6736(10)62179-4. [DOI] [PubMed] [Google Scholar]
- 4.Balarajan Y, Selvaraj S, Subramanian S. Health care and equity in India. Lancet. 2011;377:505–15. doi: 10.1016/S0140-6736(10)61894-6. [DOI] [PMC free article] [PubMed] [Google Scholar]
- 5.Gaziano T, Reddy KS, Paccaud F, Horton S, Chaturvedi V. Cardiovascular disease. In: Jamison DT, Mosley WH, editors. Disease Control Priorities in the Developing World. Oxford: Oxford University Press; 2006. pp. 645–62. [Google Scholar]
- 6.The World Health Report 2002: Reducing Risk, Promoting Healthy Life. Geneva, Switzerland: World Health Organization; 2002. World Health Organization. [Google Scholar]
- 7.O’Donnell MJ, Xavier D, Liu L, Zhang H, Chin SL, Rao-Melacini P, et al. Risk factors for ischaemic and intracerebral haemorrhagic stroke in 22 countries (the INTERSTROKE study): A case-control study. Lancet. 2010;376:112–23. doi: 10.1016/S0140-6736(10)60834-3. [DOI] [PubMed] [Google Scholar]
- 8.Yusuf S, Hawken S, Ounpuu S, Dans T, Avezum A, Lanas F, et al. Effect of potentially modifiable risk factors associated with myocardial infarction in 52 countries (the INTERHEART study): Case-control study. Lancet. 2004;364:937–52. doi: 10.1016/S0140-6736(04)17018-9. [DOI] [PubMed] [Google Scholar]
- 9.Murray CJL, Lopez AD. Alternative projections of mortality and disability by cause 1990-2020: Global burden of disease study. Lancet. 1997;349:1498–504. doi: 10.1016/S0140-6736(96)07492-2. [DOI] [PubMed] [Google Scholar]
- 10.Kearney PM, Whelton M, Reynolds K, Muntner P, Whelton PK, He J. Global burden of hypertension: Analysis of worldwide data. Lancet. 2005;365:217–23. doi: 10.1016/S0140-6736(05)17741-1. [DOI] [PubMed] [Google Scholar]
- 11.Gupta R, Gupta VP. Hypertension epidemiology in India: Lessons from Jaipur Heart Watch. Curr Sci. 2009;97:349–55. [Google Scholar]
- 12.Gupta R, Sharma AK, Gupta VP, Bhatnagar S, Rastogi S, Deedwania PC. Increased variance in blood pressure distribution and changing hypertension prevalence in an urban Indian population. J Hum Hypertens. 2003;17:535–40. doi: 10.1038/sj.jhh.1001588. [DOI] [PubMed] [Google Scholar]
- 13.Reddy KS, Prabhakaran D, Chaturvedi V, Jeemon P, Thankappan KR, Ramakrishnan L, et al. Methods for establishing a surveillance system for cardiovascular diseases in Indian industrial populations. Bull World Health Organ. 2006;84:461–9. doi: 10.2471/blt.05.027037. [DOI] [PMC free article] [PubMed] [Google Scholar]
- 14.Hypertension Study Group. Prevalence, awareness, treatment and control of hypertension among the elderly in Bangladesh and India: A multicentre study. Bull World Health Organ. 2001;79:490–500. [PMC free article] [PubMed] [Google Scholar]
- 15.Gupta R. Trends in hypertension epidemiology in India. J Hum Hypertens. 2004;18:73–8. doi: 10.1038/sj.jhh.1001633. [DOI] [PubMed] [Google Scholar]
- 16.Malhotra P, Kumari S, Kumar R, Jain S, Sharma BK. Prevalence and determinants of hypertension in an un-industrialised rural population of North India. J Hum Hypertens. 1999;13:467–72. doi: 10.1038/sj.jhh.1000864. [DOI] [PubMed] [Google Scholar]
- 17.Gupta R, Gupta VP, Ahluwalia NS. Educational status, coronary heart disease, and coronary risk factor prevalence in a rural population of India. BMJ. 1994;309:1332–6. doi: 10.1136/bmj.309.6965.1332. [DOI] [PMC free article] [PubMed] [Google Scholar]
- 18.Todkar SS, Gujarathi VV, Tapare VS. Period prevalence and sociodemographic factors of hypertension in rural Maharashtra: A cross-sectional study. Indian J Community Med. 2009;34:183–7. doi: 10.4103/0970-0218.55269. [DOI] [PMC free article] [PubMed] [Google Scholar]
- 19.The WHO STEPS instrument: The WHO STEPwise approach to chronic disease risk factor surveillance (STEPS) Geneva: World Health Organization; 2008. World Health Organization. [Google Scholar]
- 20.Rosengren A, Hawken S, Ounpuu S, Sliwa K, Zubaid M, Almahmeed WA, et al. Association of psychosocial risk factors with risk of acute myocardial infarction in 11119 cases and 13648 controls from 52 countries (the INTERHEART study): Case-control study. Lancet. 2004;364:953–62. doi: 10.1016/S0140-6736(04)17019-0. [DOI] [PubMed] [Google Scholar]
- 21.Frohlich ED. The fifth Joint National Committee report on the detection, evaluation and treatment of high blood pressure. J Am Coll Cardiol. 1993;22:621–2. doi: 10.1016/0735-1097(93)90074-b. [DOI] [PubMed] [Google Scholar]
- 22.Third Report of the National Cholesterol Education Program (NCEP) Expert Panel on Detection, Evaluation, and Treatment of High Blood Cholesterol in Adults (Adult Treatment Panel III) final report. Circulation. 2002;106:3143–421. [PubMed] [Google Scholar]
- 23.Patel P, Macerollo A. Diabetes mellitus: Diagnosis and screening. Am Fam Physician. 2010;81:863–70. [PubMed] [Google Scholar]
- 24.Ahmad OB, Boschi-Pinto C, Lopez AD, Murray CJ, Lozano R, Inoue M. Age standardization of rates: A new WHO standard (GPE discussion paper Series: No.31) Geneva: World Health Organization; 2001. [Google Scholar]
- 25.Agyemang C. Rural and urban differences in blood pressure and hypertension in Ghana, West Africa. Public Health. 2006;120:525–33. doi: 10.1016/j.puhe.2006.02.002. [DOI] [PubMed] [Google Scholar]
- 26.Kamadjeu RM, Edwards R, Atanga JS, Unwin N, Kiawi EC, Mbanya JC. Prevalence, awareness and management of hypertension in Cameroon: Findings of the 2003 Cameroon Burden of Diabetes Baseline Survey. J Hum Hypertens. 2006;20:91–2. doi: 10.1038/sj.jhh.1001936. [DOI] [PubMed] [Google Scholar]
- 27.Wolf-Maier K, Cooper RS, Banegas JR, Giampaoli S, Hense HW, Joffres M, et al. Hypertension prevalence and blood pressure levels in 6 European countries, Canada, and the United States. JAMA. 2003;289:2363–9. doi: 10.1001/jama.289.18.2363. [DOI] [PubMed] [Google Scholar]