

Abstract
Seasonal variation in the gonad weight and biochemical composition of the sea urchin Paracentrotus lividus from the Golf of Tunis (Tunisia) were studied between September 2003 and August 2004. The highest gonad indices occurred in March (16.71%). The spawning period occurred between April and July and resulted in a fall in gonad indices to low level (7.12 ± 0.12%). Protein constituted the main component of the gonad, and lipid and carbohydrate were found at appreciable amounts. Consistent with the gonad cycle, sea urchin biochemical components showed clear seasonal variation with a significant decrease during the spawning period. The polyunsaturated fatty acid (PUFA) group was found at high level (40% of the total fatty acids). Of the PUFA group, eicosapentaenoic (C20:5 n − 3) and eicosatetraenoic (C20:4 n − 3) were the most abundant gonadal lipids. The level of PUFA was significantly affected by temperature variation showing an increase during the cold months and a decrease in the hot months.
1. Introduction
Sea urchin Paracentrotus lividus (Lamarck) is a widespread species in the Atlantic and the Mediterranean coasts and is subjected to intensive commercial fishing in several countries. This species was prised for its yellow gonads which have a caviar-like appearance and a bittersweet flavour [1]. Sea urchin gonads, also known as roe or uni, are a highly valued seafood commodity and are considered as delicacies in many parts of the world.
However, sea urchin gonad composition may exhibit wide variability, which can affect gonad quality. The factors that affect sea urchin gonad composition can be endogenous, exogenous, or both operating in concert. The endogenous factors are genetically controlled and are associated with the animal life cycle. Thus, as the gonads increase in size, somatic growth slows down and eventually stops. At this time, proteins and lipids are mobilised from the muscle and transferred to the gonads [2].
The exogenous factors, both environmental (temperature, salinity, etc.) and dietary (diet composition, feeding frequency, ration level, etc.), have also been reported to affect the proximate composition of the sea urchin gonads [3]. However, it is difficult to attribute the change in biological component to any specific environmental factor, such as food or temperature, because of their parallel variation.
Water temperature is one of the most important factors governing metabolic processes in sea urchins [4, 5]. Under conditions of unlimited food supply, an increase in temperature was found to induce an increase in food intake. Growth rate increases with temperature within certain species-specific ranges, but high temperatures result in negative instead of stimulatory effects. In a summary on ecology of the green sea urchin, Scheibling and Hatcher [6] concluded that feeding rates are not linearly related to temperature but generally show a strong relationship with the reproductive cycle which itself varies seasonally with temperature.
Lipids are important energy reserves that can store more energy per unit volume than proteins or carbohydrates [7]. In addition, lipids, such as phospholipids and cholesterol, are structural components of cell and subcellular membranes and vital for somatic growth [8–10]. Lipids are comprised of fatty acids (FA), some of which particularly dihomo-gamma linolenic (20:3 n − 6, DHGLA), arachidonic (20:4 n − 6, AA), eicosapentaenoic (20:5 n − 3, EPA), and docosahexaenoic (22:6 n − 3, DHA) are essential for a multitude of physiological functions in animals [11, 12].
The lipid composition of animals is not fixed. Diet and growth may exert strong influence on fatty acid profiles. The specificity of fatty acid synthesis and composition in different taxonomic groups is the basis for their wide use as biochemical markers of trophic and metabolic interactions in aquatic ecosystems [13].
Several studies have been undertaken on the biochemical composition of sea urchin gonads in different regions of the world in order to assess and improve nutrients that are important for these species [14, 15]. However, in Tunisia despite the economic importance of these species, such studies have not been conducted on the sea urchin P. lividus.
In this study, the biochemical composition in relation to seasonal gonad indices variation was investigated.
2. Materials and Methods
2.1. Sample Collection
Sea urchins, Paracentrotus lividus (Lamarck), of commercial size (total wet weight 83.34 0.6 g) were collected from the intertidal zone of the Gulf of Tunis. Sea urchins (≈42 animals) were monthly collected between September 2004 and August 2005. To avoid spawning, the sea urchins were weighed and dissected immediately after collection in the field. The Gonads were removed, weighed, and stored in liquid nitrogen until analysis.
Gonadosomatic Index (%) —
The gonadosomatic index (GSI) of the sea urchin was calculated as a ratio of the gonad mass to the whole-body wet mass
(1)
2.2. Protein Analysis
Total protein was assayed using Sigma Kit 540 (Sigma chemical Co) as described. To ten μL of sample tissue (homogenised in 1 mL ultra-pure water) was added 1.0 mL of Biuret reagent. Blank and standard samples were made using 10 μL protein standards (80 mg mL−1 bovine serum albumin), respectively, added to 1 mL Biuret reagent for drowning a calibration curve. All test solutions were incubated at 20°C for 15 min. Absorbance of the incubated samples was read at 540 nm.
2.3. Carbohydrate Analysis
The carbohydrate content was analysed according to the method of Dubois et al. [16]. The sample (0.25 g) was homogenised in ultra-pure water (2 mL) and diluted to 20 μg mL−1 with ultra-pure water. An aliquot, 50 μL, of the homogenate was carefully pipetted into labelled Eppendorf tube, mixed with 50 μL of 5% phenol and allowed to stand at 15°C for 20 min. To the resulting solution, 500 μL of H2SO4 (98%) was added, cooled on ice, and subsequently centrifuged at 12000 g using a Sigma 3K30 centrifuge. After centrifugation, the supernatant was carefully transferred to a cuvette, and its absorbance was read at 492 and 620 nm using the spectrophotometer SLT spectra. Total carbohydrate absorbance was calculated using the following equation:
| (2) |
2.4. Lipid Extraction
Total lipid was extracted by the method of Folch et al. [17]. The samples (0.5 g) were homogenised in 10 mL of chloroform methanol (2 : 1, v/v) using a manual homogeniser. The samples were then centrifuged (1200 g, 5 mn) to separate the lipid containing organic layer from the aqueous layer. The organic layer was transferred in to a preweighed boiling tube and subsequently evaporated to dryness at 37°C under nitrogen. The dried tube containing lipid was cooled in a dessicator and reweighed. The weight of the crude lipid was calculated by subtracting the initial weight of the empty tube from the weight of the tube containing the dried lipid.
2.5. Analysis of Fatty Acid Composition
Fatty acid methyl esters (FAMEs) of lipids were prepared according to the method of Shirai et al. [18]. The total lipid was saponified with 0.5 mol L−1 NaOH in methanol for 15 min at 100°C. The recovered fatty acids were methylated with 14% boron trifluoride (BF3) in methanol for 20 min at 100°C. The fatty acid methyl esters were analysed by HP Gas Chromatograph (hp 5890) fitted with flame ionisation detector and an INNOWAX capillary column (30 m × 0.25 mm × 0.25 μm,). Helium was used as a carrier gas. The oven temperature was programmed to rise from 160 to 240°C at a rate of 4°C min−1. The injector temperature was programmed to rise from 100 to 250°C at a rate of 30°C/min. The detector temperature was 250°C. FAME peaks of the samples were identified by comparison with retention times of known fatty acid methyl ester standard mixture supplied by Supleco and fatty acid methyl esters standard prepared from menhaden oil. Varian Star integration package was used to integrated and calculated peak areas.
3. Statistical Analysis
The data are expressed as means and standard deviations (±). Homogeneity of the data was explored with the Levene test. The arcsine transformation method was applied to transform data that were not normally distributed. Data with homogeneous variances were analyzed using Analysis of Variance (ANOVA), and the Tukey's multiple comparisons to determine differences among independent factors. All statistical analyses were performed with the use of the software package SPSS for windows, version 8.
4. Results
4.1. Gonad Index
The monthly changes in gonad mass of sea urchin are summarized in Figure 1. Sea urchin P. Lividus gonadal index reached a maximum value of 16.46 ± 2.59% in March, and then decreased steadily to a minimum value of 7.12 ± 0.12% in July (P < 0.01). The index increased progressively between August (8.25 ± 0.35%) and November (11.03 ± 0.24%) (P < 0.05), then declined in December (9.13 ± 0.12%) to remain constant until February.
Figure 1.
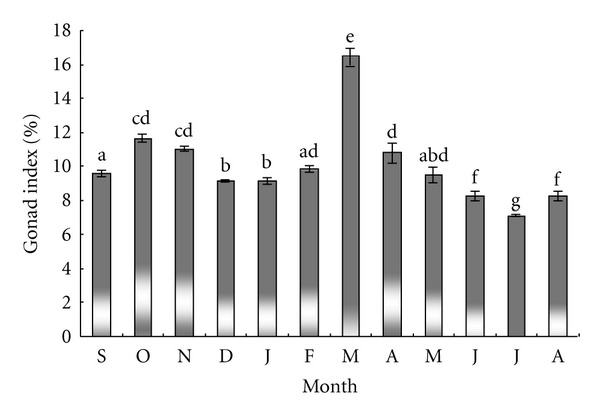
Paracentrotus lividus. Monthly variation of gonad index. Columns with the same letter are not significantly different.
4.2. Protein Content
Figure 2 presents the monthly protein content of sea urchin gonads. Protein level remained relatively constant between September and January (74.79 ± 1.10 mg g−1 wet weight), and decreased to a minimum value of 27.46 ± 2.51 mg g−1 wet weight in April (P < 0.05). From the lowest level unregistered in April, protein content increased progressively to a maximum value (91.26 ± 1.02 mg g−1 wet weight) in August (P < 0.05).
Figure 2.
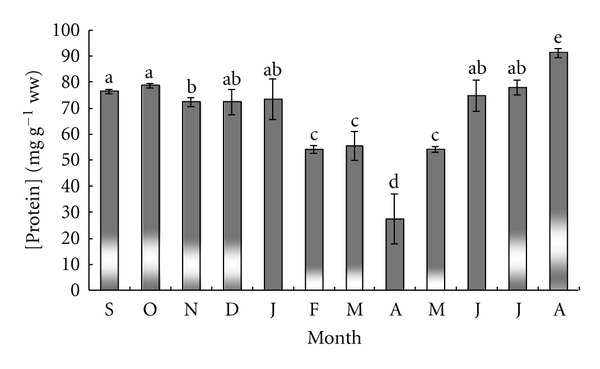
Monthly variation of protein levels in sea urchin gonads. Columns with the same letter are not significantly different.
4.3. Carbohydrate Content
Figure 3 shows that carbohydrate contents remained constant (1.34 ± 0.05 mg g−1 wet weight) between September and December and declined in January (0.09 mg g−1 wet weight, P < 0.05) and February (0.38 ± 0.02 mg g−1 wet weight, P < 0.05). During the spring and winter seasons, the gonad carbohydrate content increased steeply and reached a maximum level in March (2.51 ± 0.02 mg g−1 wet weight, P < 0.05). In summer, the gonad carbohydrate content decreased again and reached a value of 1.34 ± 0.02 mg g−1 wet weight in August.
Figure 3.
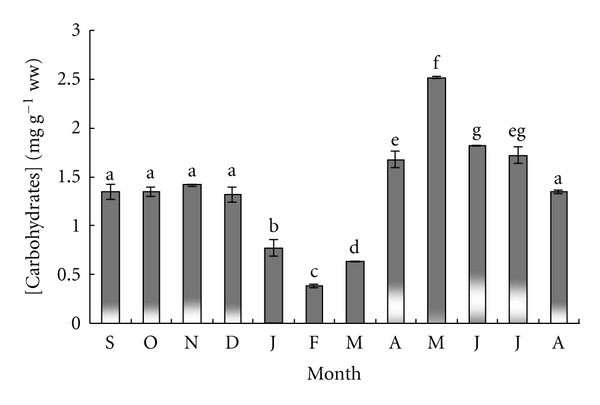
Monthly variation of carbohydrate levels in sea urchin gonads. Columns with the same letter are not significantly different.
4.4. Lipid Content
Figure 4 shows lipid content monthly variations in sea urchin gonads. In contrast to proteins and carbohydrates, lipids showed relatively constant level throughout most season (4.3 ± 0.08%), except spring season with the lowest value unregistered in April (1.73 ± 0.02%, P < 0.05).
Figure 4.
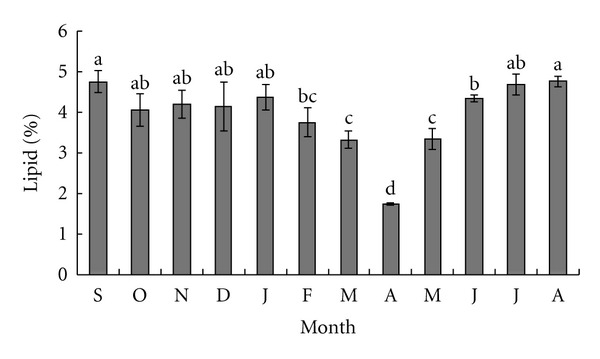
Monthly variation of lipid levels in sea urchin gonads. Columns with the same letter are not significantly different.
4.5. FA Content
Fatty acid profiles of sea urchin gonads are shown in Table 1. In this study, only the monthly variation of gonad fatty acids content that contributed more than 2% of the total fatty acids is included in the discussion.
Table 1.
Paracentrotus lividus. Variation of fatty acid composition of sea urchin gonad during the months of the year (from September 2003 to August 2004). Values are means (n = 6, ±SD) of gonad samples pooled from 40 sea urchins in each case. Different letters (a, b, c, and d) indicate significant differences for data in the same column.
| Fatty acid | September | October | November | December | January | February | March | April | May | June | July | August |
|---|---|---|---|---|---|---|---|---|---|---|---|---|
| C14:0 | 6.84 ± 1.50ac | 6.45 ± 0.4a | 5.93 ± 0.18a | 6.13 ± 0.24a | 5.83 ± 0.29a | 4.53 ± 0.54b | 5.87 ± 1.56a | 5.47 ± 0.12ab | 6.06 ± 0.59a | 7.08 ± 1.5c | 7.08 ± 1.5c | 8.17 ± 0.5d |
| C15:0 | 0.70 ± 0.07a | 1.12 ± 0.07a | 1.01 ± 0.1a | 0.96 ± 0.01a | 1.00 ± 0.05a | 0.80 ± 0.07a | 0.70 ± 0.07a | 0.53 ± 0.27a | 0.69 ± 0.00a | 0.65 ± 0.07a | 0.65 ± 0.06a | 0.70 ± 0.00a |
| C16:0 | 17.52 ±.18a | 17.29 ± 0.36a | 15.37 ± 1.33b | 14.48 ± 3.42c | 10.77 ± 4.67d | 12.76 ± 0.7e | 14.10 ± 2.12c | 13.68 ± 0.44c | 14.50 ± 0.81bc | 15.18 ± 2.18b | 16.11 ± 0.56b | 17.30 ± 0.16a |
| C17:0 | 0.69 ± 0.16a | 0.45 ± 0.01a | 0.37 ± 0.06a | 0.35 ± 0.01a | 0.40 ± 0.2a | 0.54 ± 0.76a | 0.76 ± 0.29ab | 1.31 ± 0.11b | 0.36 ± 0.23a | 1.41 ± 0.16b | 1.25 ± 0.2b | 0.73 ± 0.01ab |
| C18:0 | 1.84 ± 0.19a | 3.02 ± 0.2b | 2.83 ± 0.63b | 2.43 ± 0.25ab | 2.34 ± 0.29ab | 1.98 ± 0.15a | 2.16 ± 0.25a | 2.05 ± 0.07a | 2.08 ± 0.06a | 2.25 ± 0.19a | 2.11 ± 0.18a | 1.84 ± 0.08a |
| C19:0 | — | — | — | — | — | — | — | — | — | — | — | — |
| C20:0 | 0.40 ± 0.01a | 0.38 ± 0.02a | 0.45 ± 0.04a | 0.44 ± 0.00a | 0.22 ± 0.23a | 0.39 ± 0.03a | 0.39 ± 0.04a | 0.35 ± 0.02a | 0.34 ± 0.04a | 0.37 ± 0.01a | 0.37 ± 0.01a | 0.40 ± 0.01a |
| C22:0 | — | — | — | — | — | — | — | — | — | — | — | — |
| ∑ SFA | 27.99 ± 0.45a | 28.72 ± 0.63ad | 25.96 ± 0.13b | 24.79 ± 1.36b | 22.56 ± 0.52c | 21.00 ± 2.36c | 21.07 ± 0.41c | 23.38 ± 1.36b | 24.04 ± 0.25b | 26.94 ±2.47ab | 27.57 ± 2.36a | 29.14 ± 1.69d |
| C14:1 | 0.25 ± 0.07a | 0.19 ± 0.09a | 0.12 ± 0.07a | 0.22 ± 0.23a | 0.20 ± 0.12a | 0.19 ± 0.02a | 0.44 ± 1.16a | 0.35 ± 0.03a | 0.28 ± 0.03a | 0.51 ± 0.07a | 0.40 ± 0.00a | 0.25 ± 0.00a |
| C16:1 n − 7 | 2.23 ± 0.05a | 0.44 ± 0.05b | 1.08 ± 0.83bc | 0.29 ± 0.02b | 1.25 ± 0.78c | 2.30 ± 0.52a | 1.50 ± 1.7c | 1.33 ± 0.93c | 0.43 ± 0.13b | 0.56 ± 0.05b | 1.76 ± 0.51ac | 2.68 ± 0.12a |
| C18:1 n = 9 | 6.85 ± 0.84ae | 3.19 ± 0.05b | 4.14 ± 1.41bd | 2.39 ± 0.36c | 2.83 ± 0.28bc | 3.01 ± 0.88b | 4.56 ± 0.74d | 5.93 ± 0.17ae | 6.62 ± 0.27ae | 7.01 ± 0.84e | 10.42 ± 4.13f | 11.50 ± 2.13f |
| C18:1 n = 7 | 6.51 ± 0.19a | 6.27 ± 0.12a | 5.56 ± 1.3a | 5.77 ± 0.23a | 7.28 ± 0.7b | 3.68 ± 0.12cd | 4.15 ± 0.51c | 3.33 ± 0.22cd | 3.12 ± 0.27cd | 2.88 ± 0.19d | 1.14 ± 0.61e | 0.31 ± 0.01e |
| C20:1 n − 9 | 0.00a | 1.04 ± 0.02b | 0.99 ± 0.27b | 1.04 ± 0.12b | 0.83 ± 0.07b | 0.77 ± 0.1b | 1.75 ± 0.3b | 1.36 ± 0.05b | 1.11 ± 0.1b | 1.13 ± 0.27b | 1.13 ± 0.27b | 0.00a |
| C22:1 n − 11 | 1.78 ± 0.02a | 1.66 ± 0.05a | 1.99 ± 0.12a | 2.04 ± 0.13a | 1.44 ± 0.04a | 2.47 ± 0.14a | 1.79 ± 0.2a | 1.72 ± 0.1a | 1.89 ± 0.42a | 1.89 ± 0.11a | 1.88 ± 0.13a | 1.78 ± 0.03a |
| ∑ MUFA | 17.63 ± 0.52a | 12.79 ± 0.76bc | 13.88 ± 0.83bd | 11.76 ± 2.10c | 13.83 ± 0.72bd | 12.42 ± 1.36b | 14.19 ± 0.42d | 14.02 ± 0.85d | 13.45 ± 0.1bd | 13.98 ± 0.34d | 16.73 ± 0.78a | 16.52 ± 1.02a |
| C18:2 n − 6 | 0.34 ± 0.18a | 1.51 ± 0.26b | 3.14 ± 0.37c | 1.93 ± 0.15b | 2.31 ± 0.15b | 2.09 ± 0.22b | 1.69 ± 0.2b | 1.94 ± 0.07b | 2.30 ± 0.35b | 2.26 ± 0.18b | 0.85 ± 0.33ab | 0.34 ± 0.03a |
| C18:3 n − 3 | 2.00 ± 0.83a | 1.86 ± 0.19a | 1.49 ± 0.46a | 2.86 ± 0.96ab | 3.37 ± 0.27b | 4.25 ± 0.6c | 2.28 ± 0.36a | 2.81 ± 0.25 | 2.81 ± 0.01ab | 1.82 ± 0.23a | 1.82 ± 0.03a | 2.00 ± 0.23a |
| C20:2 | 11.26 ± 0.21a | 10.06 ± 1.37b | 12.22 ± 0.97c | 12.27 ± 2.01c | 9.24 ± 0.21b | 9.22 ± 0.25be | 8.59 ± 1.11c | 7.85 ± 0.11d | 8.77 ± 1.13ce | 9.43 ± 0.21b | 11.48 ± 3.18a | 11.26 ± 1.25a |
| C20:3 | 2.68 ± 0.41ab | 2.58 ± 0.4a | 3.47 ± 0.55b | 3.47 ± 0.35b | 2.83 ± 0.12ab | 2.70 ± 0.31ab | 2.91 ± 0.39ab | 2.75 ± 0.15ab | 2.61 ± 0.29a | 2.59 ± 0.41a | 3.43 ± 0.25b | 3.90 ± 0.25b |
| C20:4 n − 3 | 7.91 ± 0.69a | 8.22 ± 0.37a | 8.37 ± 0.45ab | 8.02 ± 1.00ab | 8.62 ± 0.4ab | 7.73 ± 0.41a | 7.66 ± 1.09a | 8.19 ± 0.23ab | 8.05 ± 0.49ab | 7.47 ± 0.69a | 6.01 ± 0.68c | 5.69 ± 0.65c |
| EPA C20:5 n − 3 | 16.80 ± 1.48a | 16.05 ± 1.45ab | 15.30 ± 1.69b | 15.46 ± 2.36b | 17.89 ± 0.54c | 19.39 ± 0.85d | 20.93 ± 4.28e | 21.05 ± 0.1e | 16.70 ± 0.93a | 16.17 ± 1.48a | 14.90 ± 0.44bf | 14.59 ± 0.36f |
| DHA C22:6 n − 3 | 1.01 ± 0.05ab | 0.78 ± 0.1a | 1.14 ± 0.24ab | 1.28 ± 0.23ab | 0.90 ± 0.09a | 0.57 ± 0.09 | 1.60 ± 0.2b | 0.47 ± 0.2a | 0.86 ± 0.08a | 1.00 ± 0.07ab | 1.93 ± 0.15b | 2.21 ± 0.25b |
| ∑ PUFA | 42.09 ± 0.54a | 41.06 ± 0.63ac | 45.13 ± 1.02b | 45.30 ± 1.56b | 44.99 ± 0.92b | 45.96 ± 0.56b | 45.66 ± 2.02b | 45.06 ± 0.63b | 42.1 ± 0.7a | 40.74 ± 1.02cd | 40.42 ± 2.13cd | 39.99 ± 0.22d |
| C18:1 n = 9/ C18:1 n = 7 |
1.05 | 0.5 | 0.74 | 0.41 | 0.38 | 1.22 | 1.09 | 1.78 | 2.12 | 2.43 | 9.17 | 36.67 |
PUFA represented the highest proportions, contributing to more than 40% of the total gonad fatty acids. SFAs which were the second dominating group, represented 25.6% of the total gonad fatty acids; the MUFA group represented 14.25% of total fatty acids.
The highest levels of the PUFA were found in the winter and in the spring, while the lowest occurred in the summer (P < 0.01). Eicosapentaenoic (C20:5 n − 3, EPA), docosadienoic (C20:2), and docosatetraenoic (C20:4 n − 3) were the major PUFA in the sea urchin gonads. EPA, which was the major compound, comprised more than 40% of the total PUFA.
The seasonal variations of PUFA were primarily due to changes in C20:5 n − 3 and C20:4 n − 3. The fatty acid C20:2, which was proportionally the second important PUFA, did not show significant seasonal variations.
The trend of changes in PUFA and SFA contents was totally opposite, with a significant reduction of the gonad SFA content during the period ranging between November and March. The main saturated fatty acids were C16:0, C14:0, and C18:0. The pattern of changes of C16:0 and C14:0 was similar throughout the year. In the winter, the level of the C16:0 and the C14:0 fatty acids decreased to a minimum of 10.76% and 4.52%, respectively. Similarly, in the summer, those fatty acids increased progressively to a maximum percentage (17.03% and 8.17% resp.) in August. The level of C18:0 remained stable throughout the year with a mean value of 2.78%.
The MUFA content was lower in the autumn and in the beginning of the summer with minimum value of 11.75% in December. Higher values of MUFA were evident in July (16.73 ± 0.78%), August (16.52 ± 1.02%), and September (17.63 ± 052%). The dominant MUFAs were C18:1 n − 9 and the C18:1 n − 7. In the winter (December), the percentage of the C18:1 n − 9 decreased to the lowest value of 3.67% and then increased progressively to the highest level of 11.49% in August. During the same period, the percentage of C18:1 n − 7 dropped down to a minimum of 0.31%, with a percentage significantly lower (P < 0.01) than that of the C18:1 n − 9. Between October and January, the C18:1 n − 7 percentages remained significantly higher than that of the C18:1 n − 9.
4.6. Variation of C18:1 n − 9/C18:1 n − 7 Ratios
In October, the ratio of C18:1 n − 9/C18:1 n − 7 was 0.56 and remained around that value through November and December. In January, it increased significantly (P < 0.05; 0.66) to reach a maximum value of 36.67 in August (Table 1).
5. Discussion
Various studies have investigated different aspects of the gonad cycle in the sea urchin, Paracentrotus lividus [19–21]. In Mediterranean population, single annual spawning period [22] and two annual spawning periods [14, 23] have been reported. Previous studies revealed that, within the same area (Ireland), both single and double spawning may occur [24]. The current study confirmed the presence of a single annual spawning of the sea urchin P. lividus from the Gulf of Tunis (occurring in spring) with a minimum gonad index value in the summer. A similarity in the reproductive pattern of echinoids from temperate areas, with a nutrient storage period in autumn and winter and a long spawning period during summer, was equally reported [20]. However, Spirlet et al. [21] revealed a significantly (P < 0.05) lower value of GSI (ranging between 6% and 12%) of P. lividus in natural condition. The difference in gonad index was probably due to sea urchin provenance, which in our study came from intertidal zone with abundant food, and, therefore, high GI values were expected. [25] and Spirlet et al. [21] reported similar pattern of gonadal index variation. They also revealed that the gonadal growth of P. lividus occurs during the coldest months of the year and during the period of shortest days, suggesting that both parameters are responsible for gonadal growth. In addition, Regis [23] and Byrne [25] demonstrated that a decrease in temperature during autumn is an important factor for initiating gonad growth in Mediterranean and Irish populations of P. lividus. However, an increased temperature in spring acted as a catalyst for gametogenic processes, and thereafter spawning [20].
Gross biochemical composition of Echinoidea was generally independent of species and geographical location [26]. The biochemical composition of P. lividus gonad from Tunisia is comparable to that observed in sea urchins from other parts of the world [27, 28], with important reserves of protein, relatively abundant quantities of lipids and lower levels of carbohydrate. However, in echinoids, such biochemical composition varies seasonally [14, 26, 29] and was related to food quality and availability [15, 30], to temperature variation [21] and to reproductive cycle [14, 31]
Our results revealed that proteins were found to be the main component of P. lividus gonads [15, 27]. The protein content was related to the gonad's reproductive cycle showing important levels prior to spawning. Fernandez [27] reported similar results. An inverse relationship between protein reserve and gametogenesis was equally found in [32]. In general, energy is stored prior to gametogenesis when food is abundant and utilised subsequently in the production of gametes at high metabolic demand [25].
The carbohydrate was identified as a primary source of energy for gonad growth and gametogenesis in sea urchin [15, 33]. Thus, carbohydrate reached a minimum level when gonad mass increased to a maximum value. Similarly, Patrick et al. [34] revealed this inverse relationship between gonad mass and carbohydrate levels in oyster (Crassostrea gigas). These authors reported that sexual maturation in oyster was closely associated with the carbohydrates breakdown independently of the rearing site. Moreover, carbohydrates are used to produce energy to support the temperature decrease during the winter [35]. In this study, the increase of carbohydrate level during the spring season is probably due to food abundance.
5.1. Lipid and Fatty Acids Composition of the Gonads
Results showed that gonad total lipids in the P. lividus were similar to those of other echinoids [36–38]. Seasonal variation in the total lipids was less evident than for the other biochemical components.
Fatty acids profiles were also identified during this study. The polyunsaturated fatty acids constitute the highest proportion of the total fatty acids identified in the gonads (Figure 1). This finding is consistent with published data [10, 37, 39]. Numerous researchers have reported that ovaries contain large amounts of EPA and DHA [40, 41]. In this study, EPA was observed to be the major polyunsaturated fatty acids in sea urchin gonad. In contrast, the level of DHA, which was thought to be one of the major fatty acids in marine organisms, was only between 0.47 and 2.2% of the total fatty acids. Similarly, Pathirana et al. [37] found 1–2.5% DHA and a high level of EPA in the gonads of S. droebachiensis. Mai et al. [42] reported that the high proportion of EPA is a reflection of the presence of a macroalgal material in the diet of sea urchin, since this fatty acid is found in macroalgal species such as Laminaria digitata and Alaria esculenta. In this study, the C20:2, the C20:3 and the C20:4 were present in important percentages. These fatty acids were found to be the major contributors in sea urchin tissues, even when they were not detected in the diet [37]. It appears that these fatty acids are synthesized by sea urchins from lower fatty acid precursors [43, 44]. These fatty acids are also known to have structural functions [8].
The major saturated fatty acids were C16:0, C14:0, and C18:0 with dominance of C16:0 (>60% of the SFA). This is in accordance with the available published data on fatty acid composition of wild sea urchins [8, 37, 45].
Furthermore, the present study showed that fatty acids C18:1 n − 9 and C18:1 n − 7 were the dominant MUFA. In other studies, C20:1 was, however, the dominant fatty acids in sea urchin gonad [8, 37]. The presence of the fatty acid C20:1 has not been commonly reported as being typical of marine lipids. Ackman and Hooper [46] stated that in marine animals, such as periwinkle (Littorina littorea), moon snail (Lunata triseriata), and sand shrimp (Crangon septem-spinosus), the C20:1 did not exceed 0.2% of the total fatty acid content. The formation of the C20:1 in the sea urchin gonadal lipids may be biosynthetic in origin since it was not reported in seaweeds, which is the natural diet of sea urchins [47].
5.2. Monthly Variation of the Sea Urchin Gonad Fatty Acid Composition
In this study, the influence of the environmental conditions (food type and temperature variation) on FA composition should be discussed with regards to the reproductive cycles which can also contribute to the variation of FA composition in sea urchin gonads.
During this study, a seasonal change of PUFA in sea urchin gonads was also recorded. Naumenko and Kostetsky [48] reported similar results, showing an inverse PUFA level in marine invertebrates during the winter and spring. This is further supported by the fact that changes in saturation of fatty acids depend on temperature, and several authors consider them as adaptive reactions to sustain membrane fluidity [12, 18, 49, 50]. For instance, Farkas and Herodek [51, 52] and Farkas [53] revealed an increased amount of C20 and C22 PUFAs in some crustacean plankton, in response to environmental temperature decrease.
In addition, animals are known to receive considerable amounts of lipids via their diet [18, 38] which type was found to alter the fatty acid composition of certain herbivorous copepods such as Calanus spp [54] or the sea urchin P. miliaris [43]. For example, PUFA, namely, the C20:5 and the C20:4 fatty acids, fluctuated to maximum levels in spring and to minimum levels in summer and in winter, since C20:5 and C20:4 fatty acids were found in large quantities in macroalgal species such as Porphyridium, Ascophyllum, and Laminaria [55] which were abundant in spring. However, DHA, which was associated with summer-carnivorous feeding, picked in August [56, 57].
The ratio of C18:1 n − 9/C18:1 n − 7 fatty acids in the gonads of P. lividus also showed a wide range in values, particularly between sea urchins collected at different seasons. The gonads of sea urchins, collected in summer and spring, exhibited the highest ratio of C18:1 n − 9/C18:1 n − 7 fatty acids. Such ratio has been found to be good indication of the contribution of bacteria to the nutrition of marine organisms [58]. In addition, the proportions of odd-chain and branched fatty acids within the lipids fraction has also been used to indicate the level of dietary bacterial input [59]. It is well established that sediment contains a high level of odd-chain and branched fatty acids, which are believed to be of bacterial origin [59–61]. Our results suggested that in summer and spring sea urchins may acquire some of their fatty acids from the substratum, since algal foods were rare. It also suggested that sea urchins have a high bacterial and/or diatom input in their diet at these seasons. Cook et al. [43] mentioned that sea urchin P. miliaris showed a wide range of C18:1 n − 9/C18:1 n − 7 ratio, which varied with the location from where sea urchins were collected. However, to our knowledge, no study was initiated to examine such seasonal variation, and further investigations are needed.
Acknowledgments
The authors would like to thank Fourat Akrout and Montacer Harki for being kind to collect sea urchins even during harsh conditions.
References
- 1.Robbins NJ, McKeever TJ. St. John’s NF, editor. Developing a Newfoundland sea urchin fishery. Trinity-Placentia Development Association. Canada/ Newfoundland Inshore Fisheries Development Agreement, 1990.
- 2.Litaay M, De Silva SS. Spawning season, fecundity and proximate composition of the gonads of wild-caught blacklip abalone (Haliotis rubra) from Port Fairy waters, south eastern Australia. Aquatic Living Resources. 2003;16(4):353–361. [Google Scholar]
- 3.Shearer KD. Factors affecting the proximate composition of cultured fishes with emphasis on salmonids. Aquaculture. 1994;119(1):63–88. [Google Scholar]
- 4.Shpigel M, McBride SC, Marciano S, Lupatsch I. The effect of photoperiod and temperature on the reproduction of European sea urchin Paracentrotus livid . Aquaculture. 2004;232(1–4):343–355. [Google Scholar]
- 5.Siikavuopio SI, Christiansen JS, Dale T. Effects of temperature and season on gonad growth and feed intake in the green sea urchin (Strongylocentrotus droebachiensis) Aquaculture. 2006;255(1–4):389–394. [Google Scholar]
- 6.Scheibling RE, Hatcher BG. The ecology of Strongylocentrotus droebachiensis . In: Lawrence JM, editor. Edible Sea Urchins: Biology and Ecology. Amsterdam, The Netherlands: Elsevier; 2001. pp. 271–306. [Google Scholar]
- 7.Torreiro MFM, Garcia-Martinez P, Catoira JL, Mosquera G. Seasonal variation in biochemical composition in gonads of the sea urchin, Paracentrotus livid Lmk. In: Mooi R, Telford M, editors. In: Proceedings of the 9th Internatinal Echinoderm Meeting; 1998; Rotterdam, The Netherlands. A. A. Balkema; pp. 753–758. [Google Scholar]
- 8.Takagi T, Eaton CA, Ackman RG. Distribution of fatty acids in lipids of the common Atlantic sea urchin Strongylocentrotus droebachinensis . Canadian Journal of Fisheries and Aquatic Science. 1980;37:195–202. [Google Scholar]
- 9.Schiopu D, George SB, Castell J. Ingestion rates and dietary lipids affect growth and fatty acid composition of Dendraster excentricus larvae. Journal of Experimental Marine Biology and Ecology. 2006;328(1):47–75. [Google Scholar]
- 10.Liu H, Kelly MS, Cook EJ, et al. The effect of diet type on growth and fatty-acid composition of sea urchin larvae, I. Paracentrotus livid (Lamarck, 1816) (Echinodermata) Aquaculture. 2007;264(1-4):247–262. [Google Scholar]
- 11.Conner WE. The beneficial effects of omega-3 fatty acids: cardiovascular disease and neurodevelopment. Current Opinion in Lipidology. 1997;8(1):1–3. doi: 10.1097/00041433-199702000-00001. [DOI] [PubMed] [Google Scholar]
- 12.Guler GO, Aktumsek A, Citil OB, Arslan A, Torlak E. Seasonal variations on total fatty acid composition of fillets of zander (Sander lucioperca) in Beysehir Lake (Turkey) Food Chemistry. 2007;103(4):1241–1246. [Google Scholar]
- 13.Haubert D, Häggblom MM, Scheu S, Ruess L. Effects of fungal food quality and starvation on the fatty acid composition of Protaphorura fimata (Collembola) Comparative Biochemistry and Physiology B. 2004;138(1):41–52. doi: 10.1016/j.cbpc.2004.02.009. [DOI] [PubMed] [Google Scholar]
- 14.Fernandez C. Seasonal changes in the biochemical composition of the edible sea urchin Paracentrotus livid us (Echinodermata: Echinoidea) in a Lagoonal Environment. Marine Ecology. 1998;19(1):1–11. [Google Scholar]
- 15.Montero-Torreiro MF, Garcia-Martinez P. Seasonal changes in the biochemical composition of body components of the sea urchin, Paracentrotus livid, in Lorbé (Galicia, north-western Spain) Journal of the Marine Biological Association of the United Kingdom. 2003;83(3):575–581. [Google Scholar]
- 16.Dubois M, Gilles KA, Hamilton JK, Rebers PA, Smith F. Colorimetric Method for Determination of Sugars and Related Substances. St. Paul, Minn, USA: Division of Biochemistry, University of Minnesota; 1956. [Google Scholar]
- 17.Folch J, Lees M, Sloane-Stanley GH. A simple method for the isolation and purification of total lipides from animal tissues. The Journal of Biological Chemistry. 1957;226(1):497–509. [PubMed] [Google Scholar]
- 18.Shirai N, Suzuki H, Tokairin S, Ehara H, Wada S. Dietary and seasonal effects on the dorsal meat lipid composition of Japanese (Silurus asotus) and Thai catfish (Clarias macrocephalus and hybrid Clarias macrocephalus and Clarias galipinus) Comparative Biochemistry and Physiology A. 2002;132(3):609–619. doi: 10.1016/s1095-6433(02)00081-8. [DOI] [PubMed] [Google Scholar]
- 19.Leahy PS, Evans HBR, Britten RJ, Davidson EH. Synchrony of oogenesis in laboratory maintained and wild populations of the purple sea urchin (Strongylocentrotus purpurat) Journal of Experimental Zoology. 1981;215:7–22. [Google Scholar]
- 20.Spirlet C, Grosjean P, Jangoux M. Optimizing food distribution in closed-circuit cultivation of edible sea urchins (Paracentrotus livid: Echinoidea) Aquatic Living Resources. 1998;11(4):273–277. [Google Scholar]
- 21.Spirlet C, Grosjean P, Jangoux M. Optimization of gonad growth by manipulation of temperature and photoperiod in cultivated sea urchins, Paracentrotus livid (Lamarck) (Echinodermata) Aquaculture. 2000;185(1-2):85–99. [Google Scholar]
- 22.Lozano J, Galera J, Lopez S, Turon X, Palacin C, Morera G. Biological cycles and recruitment of Paracentrotus livid (Echinodermata: Echinoidea) in two contrasting habitats. Marine Ecology Progress Series. 1995;122(1–3):179–192. [Google Scholar]
- 23.Regis MB. Analyse des fluctuations des indices physiologiques chez deux echinoids (Paracentrotus livid (Lmck) et Arbacia lixula L.) du Golfe de Marseille. Tethys. 1979;9:167–181. [Google Scholar]
- 24.Crapp GB, Willis ME. Age determination in the sea urchin Paracentrotus livid (Lamarck), with notes on the reproductive cycle. Journal of Experimental Marine Biology and Ecology. 1975;20(2):157–178. [Google Scholar]
- 25.Byrne M. Annual reproductive cycles of the commercial sea urchin Paracentrotus livid from an exposed intertidal and a sheltered subtidal habitat on the west coast of Ireland. Marine Biology. 1990;104(2):275–289. [Google Scholar]
- 26.McClintock JB, Pearse JS. Biochemical composition of antarctic echinoderms. Comparative Biochemistry and Physiology Part B. 1987;86(4):683–687. [Google Scholar]
- 27.Fernandez C. Effect of diet on the biochemical composition of Paracentrotus livid (Echinodermata: Echinoidea) under natural and rearing conditions (Effect of diet on biochemical composition of urchins) Comparative Biochemistry and Physiology A. 1997;118(4):1377–1384. [Google Scholar]
- 28.Lares MT. The effects of food quality and temperature on the nutrition of the carnivorous sea urchin Eucidaris tribuloides . Journal of Experimental Marine Biology and Ecology. 1991;149(2):279–286. [Google Scholar]
- 29.Lawrence JM, Guille A. Organic composition of tropical, polar and temperate-water echinoderms. Comparative Biochemistry and Physiology Part B. 1982;72(2):283–287. [Google Scholar]
- 30.Cook EJ, Kelly MS, Mckenzie JD. Somatic and gonadal growth of the sea urchin Psammechinus miliaris (Gmelin) fed artificial salmon feed compared with a macroalgal diet. Journal of Shellfish Research. 1998;17(5):1549–1555. [Google Scholar]
- 31.Fenaux L, Malara G, Cellario C, Charra R, Palazzoli I. Évolution des constituants biochimiques des principaux compartiments de l’oursin Arbacia lixula (L.) au cours d’un cycle sexuel et effets d’un jeûne de courte durée au cours de la maturation sexuelle. Journal of Experimental Marine Biology and Ecology. 1977;28(1):17–30. [Google Scholar]
- 32.Barber BJ, Blake NJ. Energy storage and utilization in relation to gametogenesis in Argopecten irradians concentricus (say) Journal of Experimental Marine Biology and Ecology. 1981;52(2-3):121–134. [Google Scholar]
- 33.Racotta IS, Ramirez JL, Ibarra AM, Rodríguez-Jaramillo MC, Carreño D, Palacios E. Growth and gametogenesis in the lion-paw scallop Nodipecten (Lyropecten) subnodosus . Aquaculture. 2003;217(1–4):335–349. [Google Scholar]
- 34.Patrick S, Faury N, Goulletquer P. Seasonal changes in carbohydrate metabolism and its relationship with summer mortality of Pacific oyster Crassostrea gigas (Thunberg) in Marennes-Oléron bay (France) Aquaculture. 2006;252(2-4):328–338. [Google Scholar]
- 35.Ansell AD. Seasonal changes in biochemical composition of the bivalve Abra alba from the clyde sea area. Marine Biology. 1974;25:13–20. [Google Scholar]
- 36.Serrazanetti GP, Pagnucco C, Conte LS, Cattani O. Hydrocarbons, sterols and fatty acids in sea urchin (Paracentrotus livid) of the Adriatic Sea. Chemosphere. 1995;30(8):1453–1461. [Google Scholar]
- 37.Liyana-Pathirana C, Shahidi F, Whittick A. The effect of an artificial diet on the biochemical composition of the gonads of the sea urchin (Strongylocentrotus droebachiensis) Food Chemistry. 2002;79(4):461–472. [Google Scholar]
- 38.Barberá C, Fernández-Jover D, López Jiménez JA, González Silvera D, Hinz H, Moranta J. Trophic ecology of the sea urchin Spatangus purpureus elucidated from gonad fatty acids composition analysis. Marine Environmental Research. 2011;71(4):235–246. doi: 10.1016/j.marenvres.2011.01.008. [DOI] [PubMed] [Google Scholar]
- 39.Mnari A, Bouhlel I, Chraief I, et al. Fatty acids in muscles and liver of Tunisian wild and farmed gilthead sea bream, Sparus aurata . Food Chemistry. 2007;100(4):1393–1397. [Google Scholar]
- 40.Tocher DR, Sargent JR. Analyses of lipids and fatty acids in ripe roes of some Northwest European marine fish. Lipids. 1984;19(7):492–499. doi: 10.1007/BF02534481. [DOI] [PubMed] [Google Scholar]
- 41.McLean CH, Bulling KR. Differences in lipid profile of New Zealand marine species over four seasons. Journal of Food Lipids. 2005;12(4):313–326. [Google Scholar]
- 42.Mai K, Mercer JP, Donlon J. Comparative studies on the nutrition of two species of abalone, Haliotis tuberculata L. and Haliotis discus hannai Ino. V. The role of polyunsaturated fatty acids of macroalgae in abalone nutrition. Aquaculture. 1996;139(1-2):77–89. [Google Scholar]
- 43.Cook EJ, Bell MV, Black KD, Kelly MS. Fatty acid compositions of gonadal material and diets of the sea urchin, Psammechinus miliaris: trophic and nutritional implications. Journal of Experimental Marine Biology and Ecology. 2000;255(2):261–274. doi: 10.1016/s0022-0981(00)00301-4. [DOI] [PubMed] [Google Scholar]
- 44.Floreto EAT, Teshima SI, Ishikawa M. The effects of seaweed diets on the growth, lipid and fatty acids of juveniles of the white sea urchin Tripneustes gratilla . Fisheries Science. 1996;62(4):589–593. [Google Scholar]
- 45.Kaneniwa M, Takagi T. Fatty acids in the lipid of food products from sea urchin. Bulletin of Japanese Society for Scientific Fisheries. 1986;52:1681–1685. [Google Scholar]
- 46.Ackman RG, Hooper SN. Non methylene interrupted fatty acids in lipids of shallow water marine invertebrates: a comparison of two molluscs (Littorina littorea and Lunatia triseriata) with the sand shrimp (Crangon septemspinosus) Comparative Biochemistry and Physiology. 1973;46(1):153–165. [Google Scholar]
- 47.Ackman RG, McLachlan J. Fatty acids in some Nova Scotian marine seaweed: a survey for actadecapentaenoic and other biochemically novel fatty acids. In: Jensen A, Staein JR, editors. In: Proceedings of the 9th International Seaweed Symposium; 1977; Princeton Science Press; pp. 47–69. [Google Scholar]
- 48.Naumenko NV, Kostetsky EY. Fatty acid composition of phosphatidylcholine and phosphatidylethanolamine from muscle tissue of marine invertebrates in various seasons of the year. Journal of Evolutionary Biochemistry and Physiology. 1987;23:16–25. [Google Scholar]
- 49.Farkas T, Csengeri I, Majoros F, Oláh J. Metabolism of fatty acids in fish. III. Combined effect of environmental temperature and diet on formation and deposition of fatty acids in the carp, Cyprinus carpio Linnaeus 1758. Aquaculture. 1980;20(1):29–40. [Google Scholar]
- 50.Farkas T, Kariko K, Csengeri I. Incorporation of [1-14C] acetate into fatty acids of the crustaceans Daphnia magna and Cyclops strenus in relation to temperature. Lipids. 1981;16(6):418–422. [Google Scholar]
- 51.Farkas T, Herodek S. Seasonal changes in the fat contents of the crustacean plankton in lake Balaton. Annals of Biology. 1960;27:3–7. [Google Scholar]
- 52.Farkas T, Herodek S. The effect of environmental temperature on the fatty acid composition of crustacean plankton. Journal of Lipid Research. 1964;5(3):369–373. [PubMed] [Google Scholar]
- 53.Farkas T. Fats in fresh water crustaceans. I. Fatty acid composition of lipids obtained from Eudiaptomus gracilis G. O. Sars (Copepoda) and Daphnia cucullata G. O. Sars (Cladocera) Acta Biologica Academiae Scientiarum Hungaricae. 1970;21(2):225–233. [PubMed] [Google Scholar]
- 54.Graeve M, Kattner G, Hagen W. Diet-induced changes in the fatty acid composition of Arctic herbivorous copepods: experimental evidence of trophic markers. Journal of Experimental Marine Biology and Ecology. 1994;182(1):97–110. [Google Scholar]
- 55.Paradis M, Ackman RG. Potential for employing the distribution of anomalous non methylene interrupted dienoic fatty acids in several marine invertebrates as part of food web studies. Lipids. 1977;12(2):170–176. doi: 10.1007/BF02533289. [DOI] [PubMed] [Google Scholar]
- 56.Takagi T, Kaneniwa M, Itabashi Y, Ackman RG. Fatty acids in echinoidea: unusual cis-5-olefinic acids as distinctive lipid components in sea urchins. Lipids. 1986;21(9):558–565. [Google Scholar]
- 57.Kharlamenko VI, Zhukova NV, Khotimchenko SV, Svetashev VI, Kamenev GM. Fatty acids as markers of food sources in a shallow-water hydrothermal ecosystem (Kraternaya Bight, Yankich Island, Kurile Islands) Marine Ecology Progress Series. 1995;120(1–3):231–242. [Google Scholar]
- 58.Sargent JR, Parkes RJ, Mueller-Harvey I, Henderson RJ. Lipid biomarkers in marine ecology. In: Sleigh MA, editor. Microbs in the Sea. Chichester, UK: Ellis Horwood; 1987. pp. 119–138. [Google Scholar]
- 59.Leo RF, Parker PL. Branched-chain fatty acids in sediments. Science. 1966;152(3722):649–650. doi: 10.1126/science.152.3722.649. [DOI] [PubMed] [Google Scholar]
- 60.Sargent JR, Falk-Petersen IB, Calder AG. Fatty acid compositions of neutral glycerides from the ovaries of the asteroids Ctenodiscus crispatus, Asterias lincki and Pteraster militaris from Balsfjorden, northern Norway. Marine Biology. 1983;72(3):257–264. [Google Scholar]
- 61.Phillips NW. Role of different microbes and substrates as potential suppliers of specific, essential nutrients to marine detritivores. Bulletin of Marine Science. 1984;35(3):283–298. [Google Scholar]