

Abstract
While lung cancer is largely caused by tobacco smoking, inherited genetic factors play a role in its etiology. Genome-wide association studies (GWAS) in Europeans have robustly demonstrated only three polymorphic variations influencing lung cancer risk. Tumor heterogeneity may have hampered the detection of association signal when all lung cancer subtypes were analyzed together. In a GWAS of 5,355 European smoking lung cancer cases and 4,344 smoking controls, we conducted a pathway-based analysis in lung cancer histologic subtypes with 19,082 SNPs mapping to 917 genes in the HuGE-defined “inflammation” pathway. We identified a susceptibility locus for squamous cell lung carcinoma (SQ) at 12p13.33 (RAD52, rs6489769), and replicated the association in three independent samples totaling 3,359 SQ cases and 9,100 controls (odds ratio=1.20, Pcombined=2.3×10⁻⁸).
Significance
The combination of pathway-based approaches and information on disease specific subtypes can improve the identification of cancer susceptibility loci in heterogeneous diseases.
Keywords: Lung cancer, histology, squamous cell carcinoma, pathway analysis, RAD52
INTRODUCTION
Lung cancer is a major cause of cancer death worldwide causing over 1 million deaths each year (1). The major histological classification separates small cell lung cancers (SC) from non-small cell lung cancers, the latter mostly comprised of adenocarcinoma (AD) and squamous cell (SQ) tumors. These lung cancer histologies have diverse molecular characteristics that reflect differences in carcinogenesis, etiology and treatment (2, 3).
While lung cancer is largely caused by tobacco smoking, studies have also implicated inherited genetic factors in disease etiology. Genome-wide association studies (GWAS) in Europeans have consistently identified three polymorphic variations at 15q25.1 (CHRNA5-CHRNA3-CHRNA4), 5p15.33 (TERT-CLPTM1) and 6p21.33 (BAT3-MSH5) influencing lung cancer risk (4–8). Interestingly, one single nucleotide polymorphism (SNP), rs2736100, which localizes to the TERT gene, was distinctly associated with adenocarcinoma risk (9), suggesting that additional searches for histology specific associations are likely to prove informative.
It is estimated that perhaps as much as 25% of all cancers are associated with chronic infection and inflammation (10). Because tobacco smoking can initiate or sustain chronic inflammation (11), often in concert with altered DNA repair and inflammatory response (12), we explored the impact of common genetic variation in inflammatory genes on lung cancer risk in smokers using a GWAS from the National Cancer Institute (NCI) (9). The study included 5,355 smoking cases and 4,344 smoking controls of European ancestry. We performed a pathway analysis of the genes listed under the category of “inflammation” in the HuGE Navigator (version 1.4) (13) to measure the collective effect of these genes and identify the SNPs with the strongest association for replication in independent samples. We analyzed the association with lung cancer risk overall and within the major lung cancer histology groups to explore the genetic basis of disease subtypes.
RESULTS
We first conducted quality control analysis for all GWAS SNPs included in this study. Quantile-quantile plots of the negative logarithm of the genome-wide P values and genomic control (GC) λ values computed based on all GWAS SNPs indicated no global variance inflation (genomic controls λ between 1 and 1.02 for all analyses, Supplementary Fig. 1), excluding the possibility of inflated type-I error rates in the pathway analyses.
Among the 591,928 SNPs from the original GWAS, we analyzed 19,082 SNPs mapping to 917 genes from the HuGe navigator list (13). Given the large number of genes and the variable degree of involvement of these genes in the inflammation-related function, we used HuGE Literature Finder to assign each gene a score, reflecting the strength of evidence for association with inflammation (Supplementary Table 1 and Supplementary Methods), and tested the pathway association integrating this weighting for the genes. The list of the 917 genes and the corresponding SNP P-values are reported in Supplementary Table 1. After applying a Bonferroni correction, we found a strong association of the pathway for SQ cases (Fig. 1 and Supplementary Table 2; P=0.0004, ever smokers), suggesting the existence of SNPs truly associated with risk in this histologic subtype. An analysis without the HuGE-based weighting provided similar results, although with weaker associations (SQ P = 0.001, Supplementary Table 2). No statistically significant association was found for AD or SC risk following either the weighted or un-weighted approach (Fig. 1 and Supplementary Table 2). Therefore, we restricted further analyses to the SQ subtype.
FIGURE 1. Pathway-level associations in the NCI GWAS by histology and smoking status.
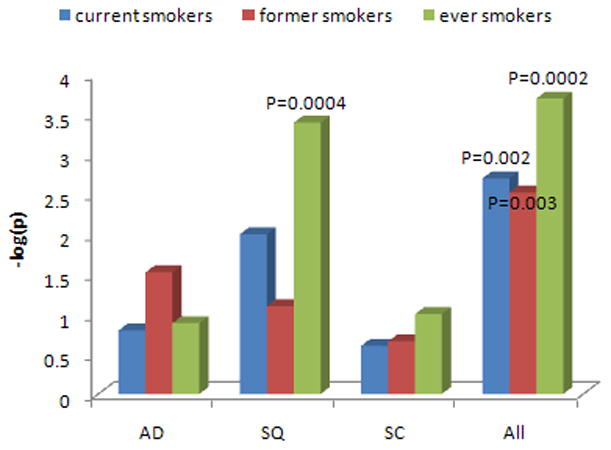
Current, former, ever smokers are identified. AD=adenocarcinoma; SQ=squamous cell carcinoma; SC=small cell carcinoma. Labeled are the analyses statistically significant after Bonferroni correction with two-sided P <0.05/12 = 0.004. For SQ and all subjects’ pathway analyses, the stronger statistical association in the combined former and current smoker sample suggests that there is a consistent effect of the SNPs across the smoking groups.
We chose the 55 SNPs in the 55 genes with the strongest evidence for association in SQ (gene-wise P-value <0.05) and performed replication in two independent studies of European ancestry, including UK1 (8), with 592 SQ cases and 2,699 controls from the 1958 Birth Cohort (WTCCC) (14), genotyped using Illumina HumanHap550 arrays; and Texas (5), with 306 SQ cases and 1,137 controls, genotyped using Illumina HumanHap300 arrays.
Among the 55 SNPs, only rs6489769 was consistently replicated in both studies, with a combined P = 6.48×10⁻⁷ for the association with SQ risk (Table 1). The SNP marker, rs6489769, maps to chromosome 12p13.33 (943,226 bps). The pathway analysis in NCI SQ data after the exclusion of the SNPs at 12p13.33 showed a pathway-level P = 0.0008. We then replicated the rs6489769 SNP in a third independent sample, UK2 (15), with 1,038 SQ cases and 933 controls genotyped using Illumina Infinium custom arrays. The association was confirmed also in the third sample (Table 2). Although these case-control series were smaller than the discovery dataset, each had the statistical power to replicate the signal of the NCI discovery set (OR=1.23) at one-sided p<0.05 (statistical power for UK1=0.92, UK2=0.93, and Texas=0.70). Combining data from all four studies, the association was statistically significant on a genome-wide basis with P = 2.30×10⁻⁸, two orders of magnitude below the Bonferroni corrected P-value threshold for 19,082 SNPs (0.05/19,082 SNPs, P = 2.62×10⁻⁶) and odds ratio = 1.20 (95% confidence interval = 1.12–1.28; Phet = 0.89, I2=0%; Table 2).
Table 1.
Replication and meta-analysis of 55 top SNPs for squamous cell lung carcinoma in NCI, UK1 and Texas.
| Gene | Min-Pa SNP | MAFb | Risk allele | NCI | Texas | UK1 | Meta-analysis | ||||
|---|---|---|---|---|---|---|---|---|---|---|---|
| ORc | Pd | ORc | Pd | ORc | Pd | ORc (95% CI)e | Pf | ||||
| HLA-B | rs2596574 | 0.06 | G | 1.89 | 2.12×10⁻⁷ | 1.06 | 0.75 | 1.05 | 0.74 | 1.36 (1.16–1.60) | 1.38×10⁻⁴ |
| CSMD1 | rs1382249 | 0.14 | A | 1.41 | 3.60×10⁻⁶ | 1.03 | 0.77 | 1.26 (1.12–1.41) | 9.68×10⁻⁵ | ||
| CD14/IK/SRA1 | rs7721577 | 0.23 | A | 1.29 | 9.74×10⁻⁶ | 1.02 | 0.89 | 1.03 | 0.71 | 1.17 (1.07–1.27) | 3.18×10⁻⁴ |
| SKIV2L/C4B/C2/CFB | rs406936 | 0.11 | G | 1.43 | 1.79×10⁻⁵ | 1.07 | 0.62 | 1.05 | 0.63 | 1.23 (1.10–1.38) | 4.49×10⁻⁴ |
| RAD52 | rs6489769 | 0.38 | A | 1.23 | 3.18×10⁻⁵ | 1.22 | 0.036 | 1.15 | 0.04 | 1.20 (1.12–1.30) | 6.48×10⁻⁷ |
| PPARGC1A | rs16874276 | 0.07 | G | 1.45 | 1.53×10⁻⁴ | 1.05 | 0.72 | 1.29 (1.11–1.50) | 1.16×10⁻³ | ||
| PON2 | rs10240398 | 0.43 | A | 1.19 | 2.95×10⁻⁴ | 0.83 | 0.043 | 1.11 | 0.14 | 1.11 (1.03–1.19) | 4.47×10⁻³ |
| CDH1 | rs8061932 | 0.18 | A | 1.25 | 4.28×10⁻⁴ | 0.89 | 0.22 | 1.13 (1.02–1.25) | 2.38×10⁻² | ||
| C5 | rs7027797 | 0.10 | A | 1.35 | 5.93×10⁻⁴ | 1.06 | 0.57 | 1.22 (1.07–1.40) | 2.62×10⁻³ | ||
| EPHX2 | rs11780471 | 0.07 | G | 1.43 | 6.49×10⁻⁴ | 1.14 | 0.39 | 1.33 (1.12–1.58) | 9.84×10⁻⁴ | ||
| ERAP1 | rs18036 | 0.24 | G | 1.21 | 7.00×10⁻⁴ | 1.05 | 0.68 | 1.17 (1.06–1.29) | 1.37×10⁻³ | ||
| PSEN1 | rs214260 | 0.14 | A | 1.25 | 7.08×10⁻⁴ | 1.05 | 0.67 | 1.08 | 0.37 | 1.16 (1.06–1.27) | 1.74×10⁻³ |
| PMS2 | rs12112229 | 0.22 | A | 1.21 | 7.25×10⁻⁴ | 1.08 | 0.36 | 1.16 (1.06–1.27) | 9.88×10⁻⁴ | ||
| NOTCH4 | rs479536 | 0.04 | G | 1.64 | 7.38×10⁻⁴ | 1.04 | 0.82 | 1.07 | 0.61 | 1.24 (1.04–1.47) | 1.48×10⁻² |
| IL4R | rs3024536 | 0.14 | G | 1.27 | 7.74×10⁻⁴ | 1.10 | 0.45 | 1.07 | 0.49 | 1.18 (1.07–1.31) | 1.62×10⁻³ |
| TNFSF14 | rs237554 | 0.15 | G | 1.26 | 9.31×10⁻⁴ | 0.92 | 0.53 | 1.31 | 0.10 | 1.21 (1.09–1.34) | 4.64×10⁻⁴ |
| PSORS1C1 | rs3130977 | 0.31 | G | 1.18 | 1.00×10⁻³ | 1.13 | 0.20 | 1.17 (1.07–1.27) | 4.38×10⁻⁴ | ||
| NFKBIA | rs1012919 | 0.32 | G | 1.18 | 1.39×10⁻³ | 0.87 | 0.15 | 0.99 | 0.90 | 1.07 (0.99–1.15) | 8.45×10⁻² |
| BARD1 | rs6712055 | 0.29 | G | 1.17 | 1.47×10⁻³ | 1.06 | 0.54 | 1.04 | 0.64 | 1.12 (1.04–1.21) | 3.20×10⁻³ |
| DEFA5 | rs4841831 | 0.35 | A | 1.17 | 1.68×10⁻³ | 0.97 | 0.68 | 1.10 (1.02–1.20) | 1.78×10⁻² | ||
| NFKB1 | rs4648022 | 0.09 | G | 1.33 | 2.02×10⁻³ | 1.34 | 0.10 | 1.18 | 0.19 | 1.29 (1.12–1.47) | 2.80×10⁻⁴ |
| NRIP1 | rs10482862 | 0.13 | G | 1.23 | 2.03×10⁻³ | 0.84 | 0.19 | 0.99 | 0.95 | 1.10 (1.00–1.22) | 5.95×10⁻² |
| IL12A | rs2243154 | 0.10 | G | 1.30 | 2.14×10⁻³ | 0.85 | 0.35 | 0.90 | 0.36 | 1.10 (0.97–1.25) | 0.13 |
| NOS2 | rs3794764 | 0.23 | G | 1.20 | 2.25×10⁻³ | 1.16 | 0.18 | 0.95 | 0.56 | 1.12 (1.02–1.22) | 1.30×10⁻² |
| GADD45B | rs3729535 | 0.09 | A | 1.29 | 2.28×10⁻³ | 0.90 | 0.55 | 0.80 | 0.07 | 1.08 (0.95–1.23) | 0.22 |
| CDKN1C | rs367035 | 0.41 | G | 1.16 | 2.35×10⁻³ | 1.03 | 0.77 | 0.90 | 0.16 | 1.07 (0.99–1.14) | 8.10×10⁻² |
| BAT3 | rs3130617 | 0.21 | A | 1.20 | 2.61×10⁻³ | 1.07 | 0.50 | 1.11 | 0.17 | 1.15 (1.06–1.25) | 1.38×10⁻³ |
| TLR4 | rs913930 | 0.34 | G | 1.16 | 2.62×10⁻³ | 0.92 | 0.38 | 0.99 | 0.86 | 1.06 (0.99–1.14) | 8.17×10⁻² |
| PTGER1 | rs1042728 | 0.08 | A | 1.31 | 2.71×10⁻³ | 1.30 | 0.19 | 0.89 | 0.37 | 1.17 (1.02–1.34) | 2.13×10⁻² |
| CDK6 | rs445 | 0.10 | A | 1.25 | 3.08×10⁻³ | 0.90 | 0.46 | 0.91 | 0.42 | 1.10 (0.98–1.23) | 0.11 |
| MPO | rs2071409 | 0.17 | A | 1.21 | 3.30×10⁻³ | 0.83 | 0.14 | 0.92 | 0.32 | 1.04 (0.95–1.14) | 0.36 |
| TCERG1 | rs2400219 | 0.21 | G | 1.19 | 3.88×10⁻³ | 0.95 | 0.62 | 0.91 | 0.29 | 1.07 (0.98–1.16) | 0.16 |
| EDN3 | rs6128532 | 0.49 | A | 1.14 | 4.16×10⁻³ | 0.97 | 0.72 | 1.10 | 0.18 | 1.10 (1.03–1.18) | 6.58×10⁻³ |
| MDM2 | rs1470383 | 0.15 | G | 1.20 | 4.51×10⁻³ | 1.10 | 0.48 | 1.01 | 0.96 | 1.13 (1.03–1.25) | 1.23×10⁻² |
| SMAD1 | rs1866179 | 0.42 | A | 1.14 | 4.78×10⁻³ | 1.12 | 0.22 | 0.95 | 0.47 | 1.09 (1.01–1.17) | 2.31×10⁻² |
| CYP17A1 | rs4919686 | 0.30 | A | 1.16 | 4.82×10⁻³ | 1.11 | 0.18 | 1.14 (1.05–1.24) | 1.88×10⁻³ | ||
| PTGDR | rs809722 | 0.19 | A | 1.18 | 5.10×10⁻³ | 1.05 | 0.67 | 1.03 | 0.73 | 1.12 (1.02–1.18) | 1.30×10⁻² |
| APOA5 | rs1263167 | 0.19 | G | 1.18 | 5.21×10⁻³ | 1.10 | 0.41 | 0.97 | 0.71 | 1.11 (1.01–1.21) | 2.37×10⁻² |
| CMA1 | rs4982958 | 0.38 | G | 1.14 | 5.24×10⁻³ | 0.96 | 0.66 | 1.08 | 0.25 | 1.10 (1.02–1.18) | 1.13×10⁻² |
| CCR1 | rs17283264 | 0.07 | G | 1.28 | 5.28×10⁻³ | 1.03 | 0.84 | 1.20 (1.04–1.38) | 1.43×10⁻² | ||
| MIF | rs875643 | 0.43 | G | 1.14 | 5.86×10⁻³ | 0.98 | 0.86 | 0.91 | 0.21 | 1.05 (0.98–1.13) | 0.19 |
| B2M | rs1901531 | 0.20 | A | 1.18 | 6.14×10⁻³ | 1.02 | 0.89 | 1.00 | 1.00 | 1.14 (1.03–1.27) | 1.48×10⁻² |
| IRAK1 | rs1059702 | 0.14 | A | 1.13 | 6.78×10⁻³ | 1.06 | 0.73 | 1.13 (1.03–1.23) | 7.04×10⁻³ | ||
| BMP4 | rs10873077 | 0.09 | A | 1.25 | 8.28×10⁻³ | 0.94 | 0.66 | 1.14 (1.00–1.31) | 5.55×10⁻² | ||
| CYBA | rs899729 | 0.40 | G | 1.13 | 8.86×10⁻³ | 0.91 | 0.30 | 1.03 | 0.64 | 1.07 (0.99–1.15) | 7.31×10⁻² |
| HLA-DQA1 | rs3129763 | 0.26 | A | 1.15 | 8.89×10⁻³ | 0.99 | 0.89 | 1.18 | 0.05 | 1.13 (1.04–1.23) | 2.79×10⁻³ |
| CYSLTR1 | rs320996 | 0.21 | A | 1.11 | 9.74×10⁻³ | 1.08 | 0.57 | 1.11 (1.03–1.20) | 8.34×10⁻³ | ||
| RSBN1/PHTF1 | rs2797409 | 0.26 | A | 1.15 | 1.03×10⁻² | 0.83 | 0.085 | 1.18 | 0.05 | 1.10 (1.01–1.19) | 2.38×10⁻² |
| IL20 | rs1770372 | 0.09 | A | 1.24 | 1.09×10⁻² | 0.97 | 0.86 | 0.92 | 0.49 | 1.10 (0.97–1.25) | 0.13 |
| PSMD9 | rs895959 | 0.15 | A | 1.18 | 1.25×10⁻² | 0.93 | 0.56 | 0.93 | 0.51 | 1.07 (0.97–1.19) | 0.16 |
| HLA-A | rs1655900 | 0.13 | A | 1.19 | 1.27×10⁻² | 1.08 | 0.56 | 1.11 | 0.23 | 1.15 (1.04–1.26) | 6.04×10⁻³ |
| SLC23A1 | rs10900862 | 0.35 | G | 1.13 | 1.56×10⁻² | 1.00 | 0.97 | 1.15 | 0.06 | 1.11 (1.03–1.20) | 4.75×10⁻³ |
| MUC1 | rs4971100 | 0.41 | A | 1.12 | 1.57×10⁻² | 0.92 | 0.37 | 1.11 | 0.14 | 1.09 (1.01–1.16) | 2.26×10⁻² |
| FANCD2 | rs7615646 | 0.15 | G | 1.17 | 1.58×10⁻² | 0.88 | 0.16 | 1.07 (0.96–1.18) | 0.30 | ||
| TNMD | rs5966709 | 0.36 | G | 1.09 | 2.28×10⁻² | 0.98 | 0.88 | 1.08 (1.01–1.15) | 3.37×10⁻² | ||
The SNP with the smallest P-value of association with cancer risk mapping to the gene.
Minor allele frequency in the NCI controls.
Odds ratio.
Two-sided P-value.
95% confidence interval.
Meta-analysis two-sided P-value based on a fixed effect model.
Table 2.
Summary data for the 12p13.33 SNP rs6489769 associated with squamous cell lung carcinoma risk
| Study | Case
|
Control
|
ORc | 95% CId | Pe | ||||||
|---|---|---|---|---|---|---|---|---|---|---|---|
| MAFa | AAb | AGb | GGb | MAFa | AAb | AGb | GGb | ||||
| NCI | 0.35 | 596 | 663 | 165 | 0.38 | 1,654 | 2,025 | 653 | 1.23 | 1.11–1.35 | 3.18×10−−5 |
| UK1 | 0.34 | 261 | 263 | 68 | 0.37 | 1,053 | 1,293 | 352 | 1.16 | 1.01–1.32 | 0.043 |
| UK2 | 0.33 | 467 | 456 | 115 | 0.37 | 381 | 420 | 132 | 1.17 | 1.03–1.34 | 0.017 |
| Texas | 0.33 | 131 | 144 | 30 | 0.38 | 453 | 500 | 184 | 1.22 | 1.01–1.47 | 0.036 |
| Combined | 1.20 | 1.12–1.28 | 2.30×10⁻⁸ | ||||||||
Results from the NCI squamous cell carcinoma discovery phase, replication series (UK1, UK2 and Texas) and meta-analysis data are reported.
Minor allele frequency.
Common homozygous, heterozygous and rare homozygous genotypes.
Odds ratio for the A allele.
95% confidence interval.
Two-sided P-value.
OR and P-values were based on a fixed effect model. Cochran’s Q test Phet=0.89 and I2=0.
We verified whether the association with SQ risk for this SNP was modified by pack-years of tobacco smoking in the NCI GWAS, but found very similar results across smoking strata (Supplementary Table 3). We also investigated in EAGLE (441 SQ cases and 1319 controls) (16) whether the association between rs6489769 and SQ was confounded by chronic obstructive pulmonary disease (COPD) status, but found no major changes in the adjusted data (data not shown). rs6489769 was not significantly associated with COPD in lung cancer cases (P=0.67, OR=0.97). Since only 131 of the controls had documented COPD, a larger study of cancer-free COPD patients is required to robustly examine the impact of this SNP on COPD risk.
To explore the 12p13.33 region further, we imputed unobserved genotypes in SQ cases and controls in NCI SQ data using HapMap Phase III and 1000 Genomes Project data but did not identify any stronger association at 12p13.33 than that provided by rs6489769. This locus harbors the RAD52 gene, which is involved in homologous recombination (HR). We examined whether other genes in the HR pathway or the overall DNA repair pathway influence SQ risk. None of the other 17 HR genes (involving 142 SNPs) showed an association with gene-wise P<0.05 (Supplementary Table 4). In the analysis of the overall DNA repair pathway including 1,410 SNPs mapping to 136 genes (Supplementary Table 5), we observed a modest pathway-level association in the NCI SQ data including (P = 0.006) or excluding (P = 0.04) the RAD52 SNPs, and the only SNP with P-value < 0.001 was rs6489769.
DISCUSSION
Using a pathway analysis in a genome-wide association study of lung cancer from European ancestry, we identified a susceptibility locus for squamous cell carcinoma risk on chromosome 12p13.33. The finding was replicated in three independent samples, did not appear to be modified by smoking quantity or personal history of COPD and exceeded a genome-wide threshold for association.
The 12p13.33 locus has at least 31 alternatively spliced variants (AceView (17)). Depending on the transcripts, rs6489769, the SNP most strongly associated with SQ risk, appears located ~13Kb centromeric to or within a plausible candidate gene RAD52 (yeast, homolog of RAD52; MIM 600392) (Fig. 2). At 53Kb LD interval from rs6489769 is also the gene encoding WNK1 (protein kinase, lysine deficient 1; MIM 605232), which plays a role in pseudo hyperaldosteronism and hereditary sensory neuropathy. At 27Kb from the same SNP also lies ERC1 (ELKS/RAB6-interacting/CAST family member 1, MIM 607127), a member of a family of RIM-binding proteins, but rs6489769 does not appear to correlate with SNPs in this gene (Fig. 2).
FIGURE 2. Discovery of 12p13.33 as a susceptibility locus for squamous cell carcinoma of the lung.
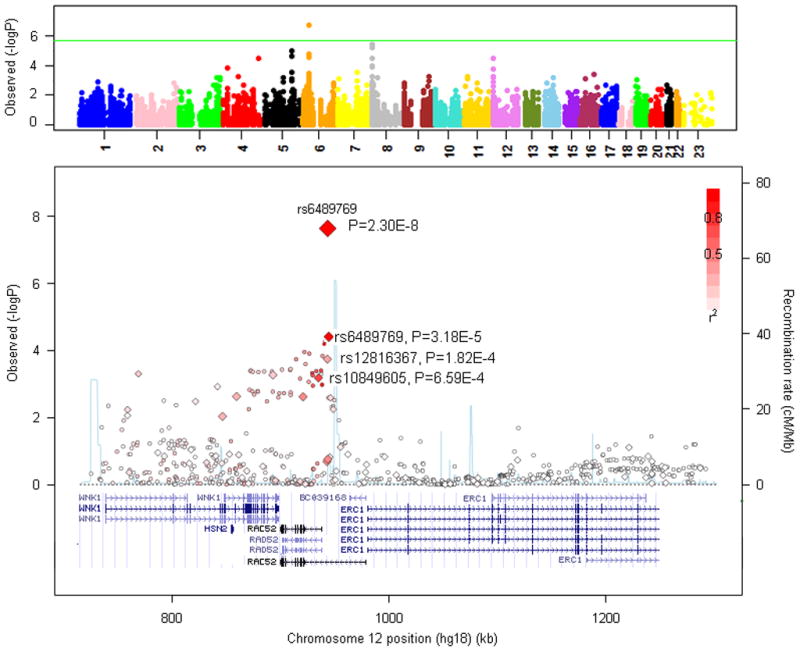
Upper panel: Manhattan plot of P-values from the inflammation pathway gene SNPs in the NCI SQ discovery data. The green line corresponds to the Bonferroni threshold of p=2.6×10⁻⁶ for the 19,082 SNPs included in the pathway analysis. Lower panel: Regional plot of the 12p13.33 SQ susceptibility locus. Plot shows association results of genotyped (diamonds) and imputed (circles) SNPs, along with recombination rates (light blue lines) estimated from the HapMap CEU samples. SNPs are colored based on their LD with rs6489769. The size of the diamonds indicates the strength of association. Genes in the region are annotated with locations and orientations using the UCSC genome browser.
High-fidelity replication of DNA, and its accurate segregation to daughter cells, is critical for maintaining genome stability and suppressing cancer. DNA replication forks are stalled by many DNA lesions and stalled forks may eventually collapse, producing a broken DNA end (18). In concert with BRCA2, RAD52 plays a pivotal role in repairing these DNA double-strand breaks (DSBs) through homologous recombination (HR) (19). RAD52 and BRCA2 seem to act in parallel pathways, and RAD52 provides an important alternate way for repairing replication-associated damage by HR in the absence of BRCA2 (20). RAD52 interacts with DNA recombination protein RAD51 and participates in the regulation of its polymerization (21). Thus, variation in RAD52 may disrupt the DSB repair function of RAD51. RAD52 also cooperates with OGG1 to repair oxidative DNA damage thereby enhancing cellular resistance to inflammatory-related oxidative stress (22). Since most therapeutic strategies for lung cancer create DNA replication stress, inherited variation in replication stress response may affect treatment efficacy (18, 23).
While DSBs can arise during DNA replication, they can also be induced by exposure to tobacco smoking (24), chronic inflammation (25) and other agents (20). Thus, genetic variation in RAD52 could contribute to altered repair of tobacco-induced and microinflammatory-sustained DNA damage a priori, providing additional support for the role of HR dysfunction in cancer development. In our data, the rs6489769-SQ association was not modified by levels of tobacco smoking. While the locus may have an effect on SQ risk independent of smoking, our sample size had limited statistical power to detect small changes across smoking strata.
Our analysis also provides evidence for the collective role of inflammatory genes in SQ, which may contribute to the development or maintenance of a carcinogenic inflammatory microenvironment. Since RAD52 is the plausible candidate gene, we verified whether other genes in the HR pathway or the overall DNA repair pathway were associated with SQ risk. While there may be other HR influencing SQ risk, our analysis suggests that by far the primary common determinant is related to the RAD52 association. Fine mapping studies and functional analyses are required to determine the biological basis of the association.
The 12p13.33 (RAD52) locus was distinctly associated with squamous cell carcinoma risk. Together with the prior identification of variants at 5p15.33 (TERT) associated with AD risk (9), our findings underscore the importance of searching for histology-specific lung cancer risk variants. Studies in other tumors have also identified different genetic variation by tumor subtypes or phenotypic diversity (26, 27), confirming that studying specific disease subtypes can enhance power for detecting susceptibility loci in GWAS (28). Moreover, evaluating the associations between susceptibility loci and tumor subtypes may improve risk assessment; and predicting the risk for specific tumor subtypes may lead to targeted early detection or prevention strategies. Moreover, identifying histology specific SNPs may refine mechanistic understanding of currently unknown origins of morphologic differences, and may contribute to the ongoing search for personalized treatment for subtype specific lung cancer cases (29, 30). However, a challenge of this approach is the difficulty of accruing necessary sample sizes given the relative rarity of many such disease subtypes. Our pathway-based approach took advantage of prior knowledge of the disease etiology and substantially helped prioritizing the most relevant SNPs for replication even in a relatively small sample size. This suggests that the combination of a pathway-based approach and information on disease specific subtypes can greatly improve the identification of cancer susceptibility loci.
METHODS
Discovery Samples
NCI GWAS (9)
The 9,699 smoker subjects were drawn from one population-based case-control study and three cohort studies: Environment and Genetics in Lung cancer Etiology study (EAGLE, case-control, Italy), Alpha-Tocopherol Beta-Carotene Cancer Prevention study (ATBC, cohort, Finland), Prostate, Lung, Colon, Ovary screening trial (PLCO, cohort, US) and Cancer Prevention Study II (CPS-II, cohort, US). All subjects were of European ancestry. The study included three main histological subtypes, AD, SQ, SC and a small number of other lung cancer subtypes. Subjects were genotyped using Illumina 1M, 610QUAD, 550K, and 317K+240S HumanHap arrays. The distribution of subjects by histology, smoking status and genotyping platforms are in Supplementary Table 6. The details of quality control were reported previously (9). Briefly, SNPs with missing rate >5%, Hardy Weinberg Equilibrium (HWE) P<10−7 in controls and minor allele frequency (MAF) <5% were excluded. Subjects were removed if they were the outliers in the ancestry plots, had high missing genotype rates or were duplicates or relatives of other subjects. The GC λ values were 1.03, 1.03, 1.01, and 1.01 in EAGLE, PLCO, CPS-II, and ATBC, respectively, suggesting no significant hidden population substructure or unadjusted confounding factors.
Replication samples
UK1 (8)
Cases with pathologically confirmed SQ were ascertained through the Genetic Lung Cancer Predisposition Study (GELCAPS), genotyped using HumanHap550. All subjects were British residents and self-reported to be of European Ancestry. Controls were from the 1958 Birth cohort. The GC λ value was 1.03. Details on the quality control procedures have been previously reported (8).
UK2 (8, 15)
Lung cancer cases were ascertained through GELCAPS. The 933 healthy smoking individuals included in the analysis are part of the National Cancer Research Network genetic epidemiological studies (1,497 males, 1,539 females; mean age 61 years, SD 11), the National Study of Colorectal Cancer (NSCCG; 1999–2006; n = 541), GELCAPS (1999–2004; n = 1,520); and the Royal Marsden Hospital Trust/Institute of Cancer Research Family History and DNA Registry (1999–2004; n = 975). These controls were the spouses or unrelated friends of patients with malignancies. None had a personal history of malignancy at time of ascertainment. All were British residents and self-reported to be of European ancestry. Subjects were genotyped using Illumina Infinium custom array.
Texas (5)
Case-control study of European ancestry, including lung cancer cases newly diagnosed at the University of Texas M.D. Anderson Cancer Center since 1991 and controls from the Kelsey-Seybold clinics (the GWAS included only smokers and cases with non-small cell lung cancer). Controls were frequency matched to cases according to their smoking behavior, age, ethnicity, and sex. Former smoking controls were further frequency matched to former smoking cases according to the number of years since smoking cessation. Subjects were genotyped using Illumina HumanHap300 chip. The GC λ value was 1.03. Details on the quality control procedures have been previously reported (5).
All subjects included in the discovery sample and replication samples signed an informed consent form. The studies were performed after approval by each local institutional review board.
Selecting Genes and SNPs in the Inflammation Pathway
We used the SNP list compiled by the HuGE Literature Finder (HuGE Navigator, version 1.4) (13), corresponding to 970 genes potentially involved in inflammation and assigned each gene the HuGE score. The HuGE score was calculated based on the frequency of reported associations with inflammation in HuGE literature (the largest the score, the strongest the association), including studies of genetic association in humans and animal studies. In particular, the number of all publications reporting on the association of a given gene with inflammation, and whether the identified associations were based on genome-wide analyses, meta-analyses, or genetic testing were taking into account. Publications based on animal models were also added to the final weighting system (Supplementary Methods). Among the 970 genes, 917 (Supplementary Table 1) were covered by the NCI GWAS, corresponding to 19,082 SNPs (within ~20 kb upstream of the start of transcription and ~10 kb downstream of stop of transcription, NCBI build 36).
Statistical Analysis
Testing association of single SNPs
For the NCI data, we performed an unconditional logistic regression analysis to test the additive effect of each SNP genotype on lung cancer risk using PLINK software (31), adjusting for age (≤50, 51–55, 56–60, 61–65, 66–70, 71–75, 76+), sex, study (ATBC, EAGLE, ATBC, CPS-II), four principal components derived based on EIGENSTRAT (32) to control population stratification and cigarettes smoked per day (≤10, 11–20, 21–30, 31–40, 41+), smoking duration in 10-year intervals, smoking status (former vs. current smoker) and, for former smokers, the number of years since quitting (1–5, 6–10, 11–20, 21–30, 30+). To assess the possibility of systematic bias due to unadjusted confounding factors or cryptic relatedness, we computed the GC λ values based on all SNPs passing the quality control filters in the NCI GWAS by histology and smoking status.
Testing association between inflammation pathway and lung cancer risk
We tested the pathway-level association by integrating the HuGE scores that reflected different strength of association with lung cancer risks for each gene. Briefly, we first derived the gene-wise P-values P1,···, PK for K= 917 genes, adjusting for the number of SNPs mapping to each gene region and the linkage disequilibrium. We converted the gene-wise P-values into quantiles Qi of the distribution, i.e. . We then tested if P1,···, PK as a set deviated from the uniform distribution (no pathway-level association) using statistic , with wi being the weights converted from the HuGE scores. A large value of T indicated a pathway-level association. The statistical significance was evaluated based on 5000 random permutations. The details of the pathway testing procedure are in the Supplementary Methods. We replicated the same analysis without applying the HuGE score by setting identical wi across the genes.
Selection of SNPs for replication
We selected the 66 genes with gene-wise P-value <5% in the NCI SQ data, and chose the min-P SNP for each gene. Since physically close genes may be in LD or have identical min-P, for each pair of min-P SNPs with high LD (r2 > 0.5), we removed the SNP with a weaker association signal in the NCI SQ data. We compiled a list of 59 SNPs for replication, among which four SNPs were not genotyped in any replication samples. In summary, we chose 55 SNPs for replication. Details of SNPs’ selection within the major histocompatibility complex (MHC) region with long range LD are in the Supplementary Methods.
Meta-analysis
Standard fixed effect meta-analysis was performed for the 55 SNPs in NCI, UK1 and Texas to derive the ORs, 95% confidence intervals and P-values. For the most significant SNP rs6489769, we performed meta-analysis of the results from NCI, UK1, UK2 and Texas datasets. Cochran’s Q statistic was calculated to test for heterogeneity with P-value Phet.
SNP Imputation in 12p13.33 locus
Prediction of the untyped SNPs in the 12p13.33 locus was carried out using IMPUTE2 (33), based on CEU HapMap Phase III haplotypes release 2 and 1000 Genomes Project. Unconditional logistic regression was performed to test the association between the imputed genotypic dosage and the trait using R adjusting for age, sex, study, principal components, cigarettes smoked per day, smoking duration, smoking status and, for former smokers, the number of years since quitting as in the single SNP analysis. LD metrics between HapMap SNPs and association P-values were plotted using SNAP (34).
Supplementary Material
Acknowledgments
Financial support: This study was supported by the Intramural Research Program of National Institutes of Health, National Cancer Institute, Division of Cancer Epidemiology and Genetics. The studies contributing to the NCI GWAS, including The Environment and Genetics in Lung cancer Etiology (EAGLE), Prostate, Lung, Colon, Ovary Screening Trial (PLCO), and Alpha-Tocopherol, Beta-Carotene Cancer Prevention (ATBC) studies were supported by the Intramural Research Program of the National Institutes of Health, National Cancer Institute (NCI), Division of Cancer Epidemiology and Genetics.
ATBC was also supported by U.S. Public Health Service contracts (N01-CN-45165, N01-RC-45035, and N01-RC-37004) from the NCI.
PLCO was also supported by individual contracts from the NCI to the University of Colorado Denver (NO1-CN-25514), Georgetown University (NO1-CN-25522), the Pacific Health Research Institute (NO1-CN-25515), the Henry Ford Health System (NO1-CN-25512), the University of Minnesota, (NO1-CN-25513), Washington University (NO1-CN-25516), the University of Pittsburgh (NO1-CN-25511), the University of Utah (NO1-CN-25524), the Marshfield Clinic Research Foundation (NO1-CN-25518), the University of Alabama at Birmingham (NO1-CN-75022), Westat, Inc. (NO1-CN-25476), and the University of California, Los Angeles (NO1-CN-25404).
The Cancer Prevention Study-II (CPS-II) Nutrition Cohort was supported by the American Cancer Society.
The NIH Genes, Environment and Health Initiative (GEI) partly funded DNA extraction and statistical analyses (HG-06-033-NCI-01 and RO1HL091172-01), genotyping at the Johns Hopkins University Center for Inherited Disease Research (U01HG004438 and NIH HHSN268200782096C), and study coordination at the GENEVA Coordination Center (U01HG004446) for the EAGLE study and part of the PLCO. Genotyping for the remaining part of PLCO and all ATBC and CPS-II samples were supported by the Intramural Research Program of the National Institutes of Health, NCI, Division of Cancer Epidemiology and Genetics. The “Texas” study was supported by NIH grants R01CA55769, R01 CA127219, R01CA133996, and U19CA121197.
The UK1 and UK2 work was supported by Cancer Research UK (C1298/A8780 and C1298/A8362- Bobby Moore Fund for Cancer Research UK). Yufei Wang was supported by an extramural NIH grant U19 CA14812701. We are also grateful to National Cancer Research Network, Helen Rollason Heal Cancer Charity and Sanofi-Aventis and the NHS funding for the Royal Marsden Biomedical Research Centre.
We thank the investigators involved in the EAGLE study, listed in http://eagle.cancer.gov. We thank the clinicians who took part in the GELCAPS consortium. The UK studies made use of genotyping data on the 1958 Birth Cohort and these data were generated and generously supplied to us by Panagiotis Deloukas of the Wellcome Trust Sanger Institute. A full list of the investigators who contributed to the generation of the data is available from www.wtccc.org.uk. This study utilized the high-performance computational capabilities of the Biowulf Linux cluster at the National Institutes of Health, Bethesda, MD (http://biowulf.nih.gov).
Footnotes
Conflicts of interest: The authors declare no conflicts of interest.
References
- 1.Ferlay J, Shin HR, Bray F, Forman D, Mathers C, Parkin DM. Estimates of worldwide burden of cancer in 2008: GLOBOCAN 2008. Int J Cancer. 2010;127:2893–917. doi: 10.1002/ijc.25516. [DOI] [PubMed] [Google Scholar]
- 2.Fletcher O, Houlston RS. Architecture of inherited susceptibility to common cancer. Nat Rev Cancer. 2010;10:353–61. doi: 10.1038/nrc2840. [DOI] [PubMed] [Google Scholar]
- 3.Travis WD, Brambilla E, Noguchi M, Nicholson AG, Geisinger K, Yatabe Y, et al. International association for the study of lung cancer/american thoracic society/european respiratory society: international multidisciplinary classification of lung adenocarcinoma: executive summary. Proc Am Thorac Soc. 2011;8:381–5. doi: 10.1513/pats.201107-042ST. [DOI] [PubMed] [Google Scholar]
- 4.Hung RJ, McKay JD, Gaborieau V, Boffetta P, Hashibe M, Zaridze D, et al. A susceptibility locus for lung cancer maps to nicotinic acetylcholine receptor subunit genes on 15q25. Nature. 2008;452:633–7. doi: 10.1038/nature06885. [DOI] [PubMed] [Google Scholar]
- 5.Amos CI, Wu X, Broderick P, Gorlov IP, Gu J, Eisen T, et al. Genome-wide association scan of tag SNPs identifies a susceptibility locus for lung cancer at 15q25. 1. Nat Genet. 2008;40:616–22. doi: 10.1038/ng.109. [DOI] [PMC free article] [PubMed] [Google Scholar]
- 6.Thorgeirsson TE, Geller F, Sulem P, Rafnar T, Wiste A, Magnusson KP, et al. A variant associated with nicotine dependence, lung cancer and peripheral arterial disease. Nature. 2008;452:638–42. doi: 10.1038/nature06846. [DOI] [PMC free article] [PubMed] [Google Scholar]
- 7.McKay JD, Hung RJ, Gaborieau V, Boffetta P, Chabrier A, Byrnes G, et al. Lung cancer susceptibility locus at 5p15.33. Nat Genet. 2008;40:1404–6. doi: 10.1038/ng.254. [DOI] [PMC free article] [PubMed] [Google Scholar]
- 8.Wang Y, Broderick P, Webb E, Wu X, Vijayakrishnan J, Matakidou A, et al. Common 5p15.33 and 6p21.33 variants influence lung cancer risk. Nat Genet. 2008;40:1407–9. doi: 10.1038/ng.273. [DOI] [PMC free article] [PubMed] [Google Scholar]
- 9.Landi MT, Chatterjee N, Yu K, Goldin LR, Goldstein AM, Rotunno M, et al. A genome-wide association study of lung cancer identifies a region of chromosome 5p15 associated with risk for adenocarcinoma. Am J Hum Genet. 2009;85:679–91. doi: 10.1016/j.ajhg.2009.09.012. [DOI] [PMC free article] [PubMed] [Google Scholar]
- 10.Rakoff-Nahoum S, Medzhitov R. Toll-like receptors and cancer. Nat Rev Cancer. 2009;9:57–63. doi: 10.1038/nrc2541. [DOI] [PubMed] [Google Scholar]
- 11.Takahashi H, Ogata H, Nishigaki R, Broide DH, Karin M. Tobacco smoke promotes lung tumorigenesis by triggering IKKbeta- and JNK1-dependent inflammation. Cancer Cell. 2010;17:89–97. doi: 10.1016/j.ccr.2009.12.008. [DOI] [PMC free article] [PubMed] [Google Scholar]
- 12.Brody JS, Spira A. State of the art. Chronic obstructive pulmonary disease, inflammation, and lung cancer. Proc Am Thorac Soc. 2006;3:535–7. doi: 10.1513/pats.200603-089MS. [DOI] [PubMed] [Google Scholar]
- 13.Yu W, Gwinn M, Clyne M, Yesupriya A, Khoury MJ. A navigator for human genome epidemiology. Nat Genet. 2008;40:124–5. doi: 10.1038/ng0208-124. [DOI] [PubMed] [Google Scholar]
- 14.Wellcome Trust Case Control Consortium. Genome-wide association study of 14,000 cases of seven common diseases and 3,000 shared controls. Nature. 2007;447:661–78. doi: 10.1038/nature05911. [DOI] [PMC free article] [PubMed] [Google Scholar]
- 15.Broderick P, Wang Y, Vijayakrishnan J, Matakidou A, Spitz MR, Eisen T, et al. Deciphering the impact of common genetic variation on lung cancer risk: a genome-wide association study. Cancer Res. 2009;69:6633–41. doi: 10.1158/0008-5472.CAN-09-0680. [DOI] [PMC free article] [PubMed] [Google Scholar]
- 16.Koshiol J, Rotunno M, Consonni D, Pesatori AC, Matteis SD, Goldstein AM, et al. Chronic obstructive pulmonary disease and altered risk of lung cancer in a population-based case-control study. PloSOne. 2009;4:e7380. doi: 10.1371/journal.pone.0007380. [DOI] [PMC free article] [PubMed] [Google Scholar]
- 17.Thierry-Mieg D, Thierry-Mieg J. AceView: a comprehensive cDNA-supported gene and transcripts annotation. Genome Bio. 2006;7(Suppl 1):S12. doi: 10.1186/gb-2006-7-s1-s12. [DOI] [PMC free article] [PubMed] [Google Scholar]
- 18.Allen C, Ashley AK, Hromas R, Nickoloff JA. More forks on the road to replication stress recovery. J of Mol Cel Bio. 2011;3:4–12. doi: 10.1093/jmcb/mjq049. [DOI] [PMC free article] [PubMed] [Google Scholar]
- 19.Benson FE, Baumann P, West SC. Synergistic actions of Rad51 and Rad52 in recombination and DNA repair. Nature. 1998;391:401–4. doi: 10.1038/34937. [DOI] [PubMed] [Google Scholar]
- 20.Feng Z, Scott SP, Bussen W, Sharma GG, Guo G, Pandita TK, et al. Rad52 inactivation is synthetically lethal with BRCA2 deficiency. Proc Natl Acad Sci USA. 108:686–91. doi: 10.1073/pnas.1010959107. [DOI] [PMC free article] [PubMed] [Google Scholar]
- 21.Qing Y, Yamazoe M, Hirota K, Dejsuphong D, Sakai W, Yamamoto KN, et al. The epistatic relationship between BRCA2 and the other RAD51 mediators in homologous recombination. PLoS Genet. 7:e1002148. doi: 10.1371/journal.pgen.1002148. [DOI] [PMC free article] [PubMed] [Google Scholar]
- 22.de Souza-Pinto NC, Maynard S, Hashiguchi K, Hu J, Muftuoglu M, Bohr VA. The recombination protein RAD52 cooperates with the excision repair protein OGG1 for the repair of oxidative lesions in mammalian cells. Mol and Cell Bio. 2009;29:4441–54. doi: 10.1128/MCB.00265-09. [DOI] [PMC free article] [PubMed] [Google Scholar]
- 23.Jewell R, Conway C, Mitra A, Randerson-Moor J, Nsengimana J, Harland M, et al. Patterns of expression of DNA repair genes and relapse from melanoma. Clin Cancer Res. 2010;16:5211–21. doi: 10.1158/1078-0432.CCR-10-1521. [DOI] [PMC free article] [PubMed] [Google Scholar]
- 24.Danoy P, Michiels S, Dessen P, Pignat C, Boulet T, Monet M, et al. Variants in DNA double-strand break repair and DNA damage-response genes and susceptibility to lung and head and neck cancers. Int J Cancer. 2008;123:457–63. doi: 10.1002/ijc.23524. [DOI] [PubMed] [Google Scholar]
- 25.Westbrook AM, Wei B, Braun J, Schiestl RH. Intestinal inflammation induces genotoxicity to extraintestinal tissues and cell types in mice. Int J Cancer. 2011;129:1815–25. doi: 10.1002/ijc.26146. [DOI] [PMC free article] [PubMed] [Google Scholar]
- 26.Antoniou AC, Wang X, Fredericksen ZS, McGuffog L, Tarrell R, Sinilnikova OM, et al. A locus on 19p13 modifies risk of breast cancer in BRCA1 mutation carriers and is associated with hormone receptor-negative breast cancer in the general population. Nat Genet. 2010;42:885–92. doi: 10.1038/ng.669. [DOI] [PMC free article] [PubMed] [Google Scholar]
- 27.Nguyen le B, Diskin SJ, Capasso M, Wang K, Diamond MA, Glessner J, et al. Phenotype restricted genome-wide association study using a gene-centric approach identifies three low-risk neuroblastoma susceptibility loci. PLoS Genet. 2011;7:e1002026. doi: 10.1371/journal.pgen.1002026. [DOI] [PMC free article] [PubMed] [Google Scholar]
- 28.Kraft P, Haiman CA. GWAS identifies a common breast cancer risk allele among BRCA1 carriers. Nat Genet. 2010;42:819–20. doi: 10.1038/ng1010-819. [DOI] [PubMed] [Google Scholar]
- 29.Kim ES, Herbert RS, Wistuba II, Lee JJ, Blumenschein GR, Tsao A, et al. The BATTLE trial: personalizing therapy for lung cancer. Cancer Discovery. 2011;1:44–53. doi: 10.1158/2159-8274.CD-10-0010. [DOI] [PMC free article] [PubMed] [Google Scholar]
- 30.Hammerman PS, Sos ML, Ramos AH, Xu C, Dutt A, Zhou W, et al. Mutations in the DDR2 kinase gene identify a novel therapeutic target in squamous cell lung cancer. Cancer Discovery. 2011;1:78–89. doi: 10.1158/2159-8274.CD-11-0005. [DOI] [PMC free article] [PubMed] [Google Scholar]
- 31.Purcell S, Neale B, Todd-Brown K, Thomas L, Ferreira MAR, Bender D, et al. PLINK: a toolset for whole-genome association and population-based linkage analysis. Am J Hum Genet. 2007;81:559–75. doi: 10.1086/519795. [DOI] [PMC free article] [PubMed] [Google Scholar]
- 32.Price1 AL, Patterson NJ, Plenge RM, Weinblatt ME, Shadick NA, Reich D. Principal components analysis corrects for stratification in genome-wide association studies. Nat Genet. 2006;38:904–9. doi: 10.1038/ng1847. [DOI] [PubMed] [Google Scholar]
- 33.Howie BN, Donnelly P, Marchini J. A flexible and accurate genotype imputation method for the next generation of genome-wide association studies. PLoS Genet. 2009;5(6):e1000529. doi: 10.1371/journal.pgen.1000529. [DOI] [PMC free article] [PubMed] [Google Scholar]
- 34.Johnson AD, Handsaker RE, Pulit S, Nizzari MM, O’Donnell CJ, de Bakker PIW. SNAP: A web-based tool for identification and annotation of proxy SNPs using HapMap. Bioinformatics. 2008;24:2938–9. doi: 10.1093/bioinformatics/btn564. [DOI] [PMC free article] [PubMed] [Google Scholar]
Associated Data
This section collects any data citations, data availability statements, or supplementary materials included in this article.