Abstract
We applied compressed sensing (CS) to spectral domain optical coherence tomography (SD-OCT). Namely, CS was applied to the spectral data in reconstructing A-mode images. This would eliminate the need for a large amount of spectral data for image reconstruction and processing. We tested the CS method by randomly undersampling k-space SD-OCT signal. OCT images are reconstructed by solving an optimization problem that minimizes the l1 norm to enforce sparsity, subject to data consistency constraints. Variable density random sampling and uniform density random sampling were studied and compared, which shows the former undersampling scheme can achieve accurate signal recovery using less data.
Keywords: Optical coherence tomography, image reconstruction techniques, information theoretical analysis
1. INTRODUCTION
Compressed sensing (CS) theory stipulates that exact signal reconstruct can be obtained from highly undersampled data, given that the signal has a sparse representation [1]. After CS first demonstrated its feasibility in MRI [2], it has been adopted by various imaging modalities including optical imaging modalities, such as optical holography [3], diffuse optical tomography [4], and optical coherence tomography (OCT) [5, 6].
As a high-resolution high-speed cross-sectional imaging technique, OCT has been used widely in medical diagnostics and imaging [7–12]. In recent years, Fourier domain OCT (FD OCT) has supplanted conventional time domain OCT (TD OCT) in many applications [13–16], due to a better sensitivity and imaging speed compared to TD OCT. Particularly, spectral domain OCT (SD OCT), one type of FD OCT, uses an array detector such as a CCD or CMOS camera to sample the interference spectrum called interferogram. The measured interferogram, and the object, the axial profile of a sample, are simply a Fourier pair, which makes the image construction straightforward. However, according to Nyquist theorem, to achieve a larger imaging depth with a given axial resolution, it requires more sampling points, i.e., more pixels in the array detector to capture the spectral interferogram, which limits the imaging speed. Moreover, the massive data acquired becomes a heavy burden for data processing and storage. In this study, we explored the potential of using compressed sensing in SD OCT (CS SD OCT), to reduce the amount of spectral data acquisition required for high-resolution image reconstruction. In this study, we use an OCT system described in detail in [5].
2. SD OCT AND CS
In SD OCT, measurements are taken in Fourier domain. Denoting the sample as a vector x and denoting k-space measurements as a vector y, we can relate x and y using Fourier transformation (F):
| (1) |
Conventional FD OCT reconstruction relies on inverse Fourier transformation, as shown in Eq. (2).
| (2) |
Under conventional reconstruction, the total number of samples in Fourier domain is determined by the spectral range of the spectrometer and the imaging depth required.
CS takes a significantly different approach from conventional reconstruction. According to the CS theory, measuring a small number of random linear combinations of an object x can lead to accurate object reconstruction. In applying CS, one has to make sure that the following three conditions hold:
Sparsity
Assume an object x∈RN and there exists an orthonormal basis (ψi : i=1,…N) for RN. x can be projected to the basis and represented by transform coefficients θi= x·ψi. Here · indicates inner product. The presentation of x in RN can be considered as sparse if θi satisfies the following inequality [15]:
| (3) |
In Eq. (3), 0<p<2 and R>0. In practice, p usually takes the value of 1. As a result, algorithms for CS promote sparsity by minimizing l1 norm of an image in a given presentation. More concretely, x can be considered as sparse when it has only a few non-zero coefficients in the representation domain Ψ.
Incoherence
CS requires an undersampling scheme that results in noise like aliasing artifact. As to CS OCT, Fourier domain (Φ) and pixel domain (Ψ) are concerned when the image is sparse in pixel domain. Fortunately, the incoherence between these two domains has been elaboratively studied in literature [2, 5].
Non-linear reconstruction
In order to recover x from randomly undersampled measurements, CS solves the following constrained optimization problem:
| (4) |
In Eq. (4), Fu is the operator for incomplete Fourier measurement; ε controls the data consistency; the objective function of this optimization problem is the ℓ1 norm of the image in Ψ, which essentially promotes sparsity. In this study, we solved Eq.(4) iteratively, using non-linear conjugate gradients (CG) and backtracking line-search [2, 5].
3. UNIFORM AND VARIABLE DENSITY RANDOM SAMPLING
Incoherent random undersampling was achieved by applying a random mask to the array detector that continuously samples the spectrum. A more practical and realistic implementation would involve randomly acquiring only a certain fraction of the pixels within the array. The mask determines whether a pixel of the array will be selected or not, depending on a certain probability distribution function. The design of the mask will affect the accuracy of CS reconstruction and the algorithm’s efficiency. The most straightforward incoherent undersampling scheme is a uniform density random sampling (UDRS), in which every pixel has the same probability of being sampled or dropped out. However, UDRS clearly is not an optimized sampling scheme, because the spectrum of the OCT light source is not constant. The source spectrum is almost zero at some pixels and those pixels do not contribute much to the A-scan reconstructed. As a result, it is rational to take a variable density random sampling (VDRS), which samples less where the source’s spectral intensity is small and samples more where the source’s spectral intensity is large.
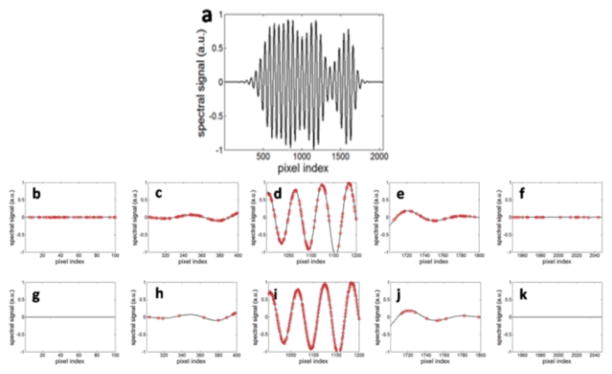
UDRS and VDRS are illustrated in Fig. 1. The interferometric spectrum obtained when a mirror is used as an object is shown in Fig. 1(a). Seen from Fig. 1(a), the source spectrum is maximized at the center of the CCD array and is almost zero at left and right ends of the array. We designed masks for UDRS and VDRS to sample 50% of the pixels. UDRS samples pixels in the whole array detector with the same probability, as shown in Fig 1(b) – (f) which clearly exhibits the drawback of UDRS. A lot of data points are sampled when the spectral intensity is almost zero, as shown in Fig. 1(b) and (f). On the other hand, we generate a mask for VDRS and the probability of selecting a pixel is proportional to the source spectral intensity at that pixel, as shown in Fig. 1(g) – (k). VDRS does not sample any data points in Fig. 1(g) and (f), because the spectral intensity is almost zero at the edge of the array detector. Moreover, VDRS samples almost every data point in Fig 1(i), because the source has largest spectral intensity in the center of the camera.
Fig. 1.
(a) Interference spectrum of high resolution OCT; (b)–(f), sections of interference spectrum sampled using UDRS at different parts of the detector; (g)–(k), sections of interference spectrum sampled using UDRS at different parts of the detector
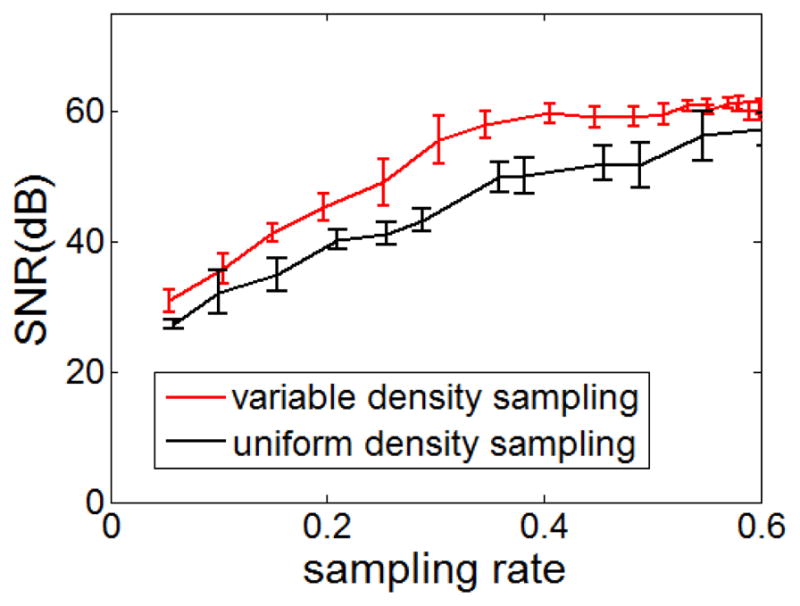
To show that VDRS will allow CS reconstruction using less data, we reconstructed OCT A-scans using CS approach based on UDRS shown in Fig.1(b) – (f), and VDRS shown in Fig. 1(g) – (k). We use signal to noise ratio (SNR) to evaluate the performance of different sampling schemes. SNR is defined as SNR=10log10(xmax2/σ2), in which xmax and σ are the peak value and standard deviation of OCT signal, respectively. The noise in the reconstructed image contains real noise which is due to the random nature of physical parameters. The measured “noise” also includes noise like aliasing that originates from random undersampling. Such aliasing gets completely removed after an ideal CS reconstruction. However, a practical CS reconstruction algorithm maximizes sparsity under the constraint of data consistency. Therefore, noise due to aliasing cannot be completely removed, and SNR can be used as a way to measure and to evaluate a sampling scheme. A large SNR indicates a good “mask” and vice versa. SNRs obtained under UDRS and VDRS at different undersampling rate are summarized in Fig 2, which shows that VDRS outperforms UDRS. To achieve a given SNR, VDRS requires less sampling rate than UDRS.
Fig. 2.

SNRs obtained using VDRS and UDRS, at different under sampling rate
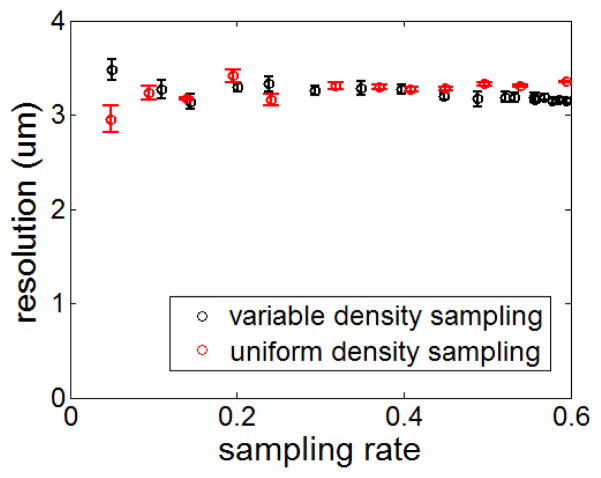
We also studied the performance of UDRS and VDRS in term of image resolution. We measured the FWHM resolution of OCT signal obtained from spectral data shown in Fig. 1(a) by CS reconstruction based on UDRS and VDRS. Results are shown in Fig. 3. Note that the axial resolution obtained from a conventional reconstruction using complete spectral data is measured to be 3.2μm. Seen from Fig. 3, both UDRS and VDRS can achieve an axial resolution close to the conventional reconstruction, and the resolution is well preserved even at extremely low sampling rate
Fig. 3.
spatial resolution obtained using different sampling schemes.
Our preliminary result suggests that VDRS allows CS reconstruction using less data, and will potentially result in a significantly reduced data acquisition time. However, the probability distribution function that we used to generate the VDRS mask is not necessarily optimized. Therefore, in the future study, we will study various ways to achieve random undersampling and compare their performance.
4. CONCLUSION AND DISCUSSION
In this work we applied compressed sensing techniques in SD OCT. Variable density random sampling and uniform density random sampling are compared. We demonstrated and verified the effectiveness of CS in phase sensitive OCT, which shows that CS has great potential in OCT’s application as a sensor to capture fast dynamic processes.
References
- 1.Donoho DL. Compressed Sensing. IEEE Transactions on Information Theory, V. 2006;52(4):1289–1306. [Google Scholar]
- 2.Lustig M, Donoho D, Pauly JM. Sparse MRI: The application of compressed sensing for rapid MR imaging, Magnetic Resonance in Medicine. 2007;58(6):1182–1195. doi: 10.1002/mrm.21391. [DOI] [PubMed] [Google Scholar]
- 3.Marim Marcio M, Atlan Michael, Angelini Elsa, Olivo-Marin Jean-Christophe. Compressed sensing with off-axis frequency-shifting holography. Opt Lett. 2010;35:871–873. doi: 10.1364/OL.35.000871. [DOI] [PubMed] [Google Scholar]
- 4.Süzen Mehmet, Giannoula Alexia, Durduran Turgut. Compressed sensing in diffuse optical tomography. Opt Express. 2010;18:23676–23690. doi: 10.1364/OE.18.023676. [DOI] [PubMed] [Google Scholar]
- 5.Liu Xuan, Kang Jin U. Compressive SD-OCT: the application of compressed sensing in spectral domain optical coherence tomography. Opt Express. 2010;18:22010–22019. doi: 10.1364/OE.18.022010. [DOI] [PMC free article] [PubMed] [Google Scholar]
- 6.Lebed Evgeniy, Mackenzie Paul J, Sarunic Marinko V, Beg Faisal M. Rapid Volumetric OCT Image Acquisition Using Compressive Sampling. Opt Express. 2010;18:21003–21012. doi: 10.1364/OE.18.021003. [DOI] [PubMed] [Google Scholar]
- 7.Brezinski M. Optical Coherence Tomography: Principles and Applications. Academic Press; London: 2006. [Google Scholar]
- 8.Bouma BE, Tearney GJ. Handbook of Optical Coherence Tomography. Informa Healthcare; New York: 2001. [Google Scholar]
- 9.Sharma U, Fried NM, Kang Jin U. All-fiber Fizeau optical coherence tomography: sensitivity optimization and system analysis. IEEE Select J of Quant Electron. 2005;11(4):799–805. [Google Scholar]
- 10.Zhang K, Kang JU. Real-time 4D signal processing and visualization using graphics processing unit on a regular nonlinear-k Fourier-domain OCT system. Optics Express. 2010;18(11):11772–11784. doi: 10.1364/OE.18.011772. [DOI] [PMC free article] [PubMed] [Google Scholar]
- 11.http://www.opticsinfobase.org/abstract.cfm?URI=oe-18-11-11772
- 12.Kang JU, Han J, Liu X, Zhang K, Song C, Gehlbach P. Endoscopic Functional Fourier Domain Common Path Optical Coherence Tomography for Microsurgery. IEEE J of Select Topic in Quantum Electron. 2010 doi: 10.1109/JSTQE.2009.2031597. [DOI] [PMC free article] [PubMed] [Google Scholar]
- 13.Balicki M, Han J, Iordachita I, Gehlbach P, Handa J, Kang JU, Taylor R. Single Fiber Optical Coherence Tomography Microsurgical Instruments for Computer and Robot-Assisted Retinal Surgery. Proceedings of the MICCAI Conference; 2009. [DOI] [PubMed] [Google Scholar]
- 14.Leitgeb R, Hitzenberger C, Fercher Adolf. Performance of fourier domain vs. time domain optical coherence tomography. Opt Express. 2003;11:889–894. doi: 10.1364/oe.11.000889. [DOI] [PubMed] [Google Scholar]
- 15.http://www.opticsinfobase.org/oe/abstract.cfm?URI=oe-11-8-889
- 16.Choma M, Sarunic M, Yang C, Izatt J. Sensitivity advantage of swept source and Fourier domain optical coherence tomography. Opt Express. 2003;11:2183–2189. doi: 10.1364/oe.11.002183. [DOI] [PubMed] [Google Scholar]
- 17.http://www.opticsinfobase.org/abstract.cfm?URI=oe-11-18-2183
- 18.de Boer J, Cense B, Hyle Park B, Pierce MC, Tearney GJ, Bouma BE. Improved signal-to-noise ratio in spectral-domain compared with time-domain optical coherence tomography. Opt Lett. 2003;28:2067–2069. doi: 10.1364/ol.28.002067. [DOI] [PubMed] [Google Scholar]
- 19.Liu X, Li X, Kim D, Ilev I, Kang Jin U. Fiber Optic Fourier-domain Common-path OCT. C Optics Letters. 2008;06(12):899–903. [Google Scholar]
- 20.Zhang K, Kang JU. Real-time 4D signal processing and visualization using graphics processing unit on a regular nonlinear-k Fourier-domain OCT system. Optics Express. 2010;18(11):11772–11784. doi: 10.1364/OE.18.011772. [DOI] [PMC free article] [PubMed] [Google Scholar]


