Abstract
We present a new automatic spectral calibration (ASC) method for spectral Domain optical coherence tomography (SD-OCT). Our ASC method calibrates the spectral mapping of the spectrometer in SD-OCT, and does not require external calibrating light source or a commercial spectral analyzer. The ASC method simultaneously calibrates the physical pixel spacing of the A-scan in static and dynamic environments. Experimental results show that the proposed ASC method can provide satisfactory calibration for SD-OCT to achieve high axial resolution and high ranging accuracy, without increasing hardware complexity.
Keywords: Optical coherence tomography, spectrometer, image reconstruction techniques
1. INTRODUCTION
Spectral Domain OCT (SD-OCT) offers significantly improved sensitivity and imaging speed compared to time-domain OCT and is ideal for intraoperative imaging and sensory feedback in robotic systems [1-6]. In such applications, SD-OCT has to provide high axial resolution which requires an accurate spectral calibration that maps the spectral data to wavenumber space (k-space) [7-9]. Moreover, OCT measures optical path length, which is the product of physical distance and medium’s refractive index. Therefore, obtaining precise tool-to-tissue ranging information is highly dependent on the imaging environment. In this study, we present a novel calibration method for SD-OCT integrated into a robotic vitreoretinal surgery assistant called EyeRobot[10]. Our automatic spectral calibration (ASC) method can be applied to any SD-OCT system without increasing hardware complexity, i.e., without using an external light source or a commercial OSA as required by conventional calibrating methods. Accurate spectral mapping is achieved by polynomial fitting using the phase of spectral interferogram. In addition, the ASC method simultaneously computes physical A-scan pixel spacing by comparing known reference plane motion, commanded through the robot, with ranging information derived from OCT A-scans in a medium with unknown refractive index.
2. METHOD
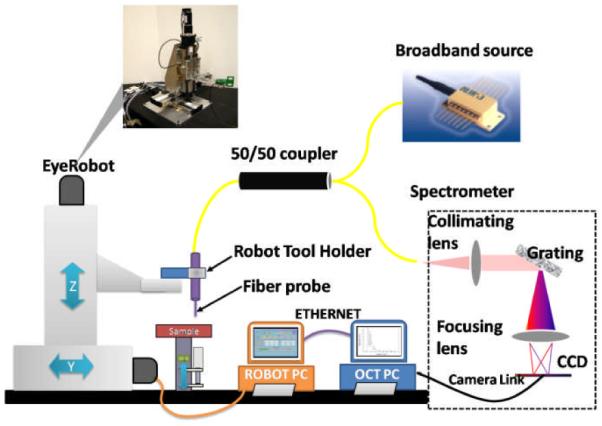
In this study, we used a common path SD-OCT (CP SD-OCT) system integrated with EyeRobot, as shown in Fig.1. Details about our system are described in [9].
Fig. 1.

Schematic of CP SD-OCT and robot system.
In SD-OCT, A-scan is reconstructed by inverse Fourier transforming the spectral interferogram in k-space. However, the array detector of the spectrometer, which is CCD in our case, does not sample data evenly in wavenumber space (k-space). Therefore, for a correct A-scan reconstruction, it is critical to re-sample the spectral data from pixel space to k-space, based on the known wavenumber values corresponding to each pixel in the CCD array. Assuming k, the wavenumber, has a 4th order polynomial dependency on the pixel index n, as shown in Eq. (1), our first task in ASC is to determine the coefficients of the polynomial.
| (1) |
To determine the coefficients in Eq. (1), we imaged a mirror, which generates perfect sinusoidal modulation in k-space [7]. To extract the phase of spectral interferogram from the real valued spectral data, we calculated the Hilbert transformation of the interferometric signal. Afterward, we obtained the phase of the complex valued signal from Hilbert transformation and the phase is proportional to k. Using phase values corresponding pixels at the central part of the CCD where the spectral intensity is large, we performed 4th order polynomial fitting to obtain a4, a3, a2, a1 and a0. With a4, a3, a2, a1 and a0, we were able to calculate kn values for all the pixels in the array detector and thus re-sample spectral data into k-space.
ASC also calibrates for the physical spacing between two adjacent pixels in OCT A-scan, Δz, by comparing the commanded EyeRobot motion and ranging data derived from the OCT A-scans. With the single-mode fiber probe attached to the tool holder of the EyeRobot and a sample fixed to a stage, we changed the distance between the reference plane and sample surface by moving EyeRobot axially with respect to the sample surface. We recorded interferograms at different imaging depths. We created A-scans by converting spectral data to k-space using the obtained polynomial coefficients and then performing inverse fast Fourier transformation (IFFT).. These A-scans contain a distinct peak corresponding to the interface between air and sample’s surface. The indices of peak pixels are denoted by i1, i2 and i3…, corresponding to different z-positions of the robot Z1, Z2 and Z3. Using a vector i to indicate peak positions obtained from OCT A-scans,a vector Z to indicate commanded robot position, we have:
| (2) |
The pixel spacing Δz can thus be obtained by regression using a least square fit of the linear model shown above.
However, the ranging data derived from OCT may be corrupted by the unknown motion of the sample. To improve the robustness of our method, we encoded the robot motion with a known modulation, such as a sinusoidal modulation with frequency f0. Taking into account the robot’s known motion, ZR(t), and the sample’s random motion, ZS(t), we may rewrite Equation (2) as:
| (3) |
Performing Fourier transform on the ranging data derived from OCT, i(t), leads to a high peak corresponding to the modulation frequency f0 and we denote this peak as ip. Similarly, Fourier transforming ZR(t) leads to a peak at f0, denoted as ZRp. We obtained physical pixel width by taking the ratio between these two peak values:
| (4) |
3. RESULTS
We placed a mirror in air and used the robot to move the OCT probe axially with regard to the mirror surface. We applied a sinusoidal modulation to the robot motion. Fig.2(a) shows an example of spectrum obtained, which is sinusoidally modulated in k-space. We performed Hilbert transformation and obtained phase shown as black dashed curve in Fig.2(b). For pixels at both edges of the CCD, the phase is not as smooth as for the central pixels. This is because the signal diminishes at the edge of CCD. We fitted the phase corresponding central pixels of the CCD using 4th order polynomial, and show the fitted phase as red solid curve in Fig.1(b). After a linear translation and scaling the functional dependency of phase on pixel index and the functional dependency of wavenumber on pixel index are the same. Therefore, we can use the red curve shown in Fig.1(b) as our spectral mapping to re-sample signal to k-space. The same spectrum was processed with and without re-sampling using our calibration result. Without re-sampling we obtained a significantly broadened point spread function, shown as the black-dashed curve in Fig.2(c); on the contrast, re-sampling spectral data to k-space using our calibration result, we obtain the sharp peak (red solid curve) indicating the mirror surface and exhibiting a full width half maximum axial resolution of about 3.2μm.
Fig.2.
(a) Interferometric fringes detected by the CCD; (b) phase extracted from the spectral interferogram (black-dashed); polynomial fitted phase (red-solid); (c) point spread function obtained with and without re-sampling.
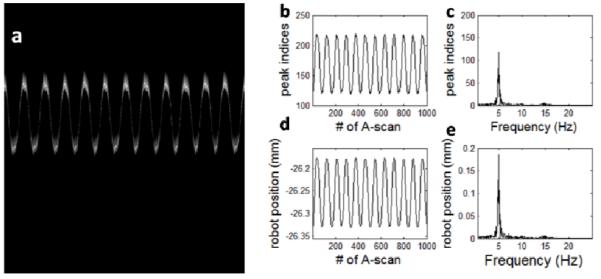
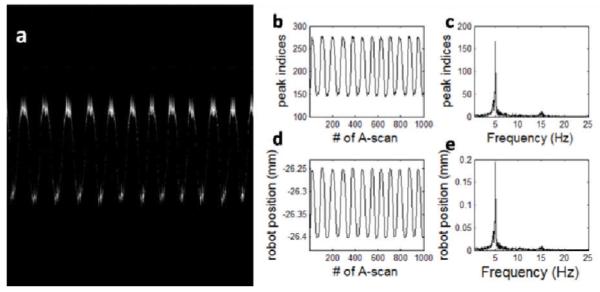
Using the spectral mapping result to process the captured spectral interferograms, we obtained M-scan shown in Fig.3(a). For each A-scan in Fig.3(a), we detected the peak position and show the result in Fig.3(b). We used Fourier transformation to analyze the time-varying peak position and obtained Fig.3(c). In Fig.3(d) and (e), we show the commanded robot position and the result of its spectral analysis. Using peak values in Fig.3(c) and (e), we calculated Δzair, which turned out to be 1.6μm. Similarly, we did the experiment with mirror and optical probe both immersed in water, and show results in Fig.4(a) - (e). Repeating the abovementioned calculation, we obtained a Δzwater value of 1.2μm. The optical distance is encoded in the interference fringes of OCT signal, and the correct distance ranging value can be obtained by dividing the obtained optical distance with medium’s refractive index. Air has a refractive index of 1 and water has a refractive index of 1.33; therefore, Δzair/Δzwater equals the ratio between the refractive index of water and air.
Fig.3.

(a) M-scan obtained when we imaged a mirror in air using sinusoidal modulated robot motion; (b) time varying peak position of OCT A-scans; (c) result of Fourier analysis of Fig.3(b); (d) commanded robot motion; (e) result of Fourier analysis of Fig.3(d).
Fig.4.

(a) M-scan obtained when we imaged a mirror in water using sinusoidal modulated robot motion; (b) time varying peak position of OCT A-scans; (c) result of Fourier analysis of Fig.4(b); (d) commanded Robot motion; (e) result of Fourier analysis of Fig.4(d).
ACKNOWLEDGMENTS
The research reported in this paper was supported in part by NIH BRP grant 1 R01 EB 007969 and NIH R21 1R21NS063131-01A1, in part by fellowship support from the ARCS Foundation.
REFERENCES
- [1].Balicki M, Han J, Iordachita I, Gehlbach P, Handa J, Kang JU, Taylor R. Single Fiber Optical Coherence Tomography Microsurgical Instruments for Computer and Robot-Assisted Retinal Surgery; Proceedings of the MICCAI Conference; London. 2009; pp. 108–115. [DOI] [PubMed] [Google Scholar]
- [2].Zhang K, Wang W, Han J, Kang JU. A surface topology and motion compensation system for microsurgery guidance and intervention based on common-path optical coherence tomography. IEEE Transactions on Biomedical Engineering. 2009;56:2318–2311. doi: 10.1109/TBME.2009.2024077. [DOI] [PMC free article] [PubMed] [Google Scholar]
- [3].Han J, Balicki M, Zhang K, Liu X, Handa J, Taylor R, Kang JU. Common-path Fourier-domain Optical Coherence Tomography with a Fiber Optic Probe Integrated Into a Surgical Needle; Proceedings of CLEO Conference; 2009. [Google Scholar]
- [4].de Boer J, Cense B, Hyle Park B, Pierce MC, Tearney GJ, Bouma BE. Improved signal-to-noise ratio in spectral-domain compared with time-domain optical coherence tomography. Opt. Lett. 2003;28:2067–2069. doi: 10.1364/ol.28.002067. [DOI] [PubMed] [Google Scholar]
- [5].Leitgeb R, Hitzenberger C, Adolf Fercher. Performance of Fourier domain vs. time domain optical coherence tomography. Opt. Express. 2003;11:889–894. doi: 10.1364/oe.11.000889. http://www.opticsinfobase.org/oe/abstract.cfm?URI=oe-11-8-889. [DOI] [PubMed] [Google Scholar]
- [6].Choma M, Sarunic M, Yang C, Izatt J. Sensitivity advantage of swept source and Fourier domain optical coherence tomography. Opt. Express. 2003;11:2183–2189. doi: 10.1364/oe.11.002183. http://www.opticsinfobase.org/abstract.cfm?URI=oe-11-18-2183. [DOI] [PubMed] [Google Scholar]
- [7].Mujat M, Park BH, Cense B, Chen TC, de Boer J. Autocalibration of spectral-domain optical coherence tomography spectrometers for in vivo quantitative retinal nerve fiber layer birefringence determination. J Biomed Opt. 2007;12(4):041205. doi: 10.1117/1.2764460. [DOI] [PubMed] [Google Scholar]
- [8].Xi J, Huo L, Li J, Li X. Generic real-time uniform K-space sampling method for high-speed swept-Source optical coherence tomography. Opt. Express. 2010;18:9511–9517. doi: 10.1364/OE.18.009511. http://www.opticsinfobase.org/abstract.cfm?URI=oe-18-9-9511. [DOI] [PMC free article] [PubMed] [Google Scholar]
- [9].Liu X, Balicki M, Taylor RH, Kang JU. Towards automatic calibration of Fourier-Domain OCT for robot-assisted vitreoretinal surgery. Opt. Express. 2010;18:24331–24343. doi: 10.1364/OE.18.024331. [DOI] [PMC free article] [PubMed] [Google Scholar]
- [10].Uneri A, Balicki MA, Handa J, Gehlbach P, Taylor RH, Iulian Iordachita. New Steady-Hand Eye Robot with Micro-Force Sensing for Vitreoretinal Surgery; Proceedings of the BIOROB Conference; 2010; [DOI] [PMC free article] [PubMed] [Google Scholar]


