Abstract
Purpose
To determine whether increasing epinephrine infusion in an in-vivo pig model is associated with an increase in end-systolic magnetic resonance elastography (MRE)-derived effective stiffness.
Methods
Finite element modeling (FEM) was performed to determine range of myocardial wall thicknesses that could be used for analysis. Then MRE was performed on 5-pigs to measure the end-systolic effective stiffness with epinephrine infusion. Epinephrine was continuously infused intravenously in each pig to increase the heart-rate in increments of 20%. For each such increase end-systolic effective stiffness was measured using MRE. In each pig, Student’s t-test was used to compare effective end-systolic stiffness at baseline and at initial infusion of epinephrine. Least-square linear regression was performed to determine the correlation between normalized end-systolic effective stiffness and increase in heart-rate with epinephrine infusion.
Results
FEM showed that phase gradient inversion could be performed on wall thickness ~≥1.5cm. In pigs, effective end-systolic stiffness significantly increased from baseline to the first infusion in all pigs (p=0.047). A linear correlation was found between normalized effective end-systolic stiffness and percent increase in heart-rate by epinephrine infusion with R2 ranging from 0.86–0.99 in 4-pigs. In one of the pigs the R2 value was 0.1. A linear correlation with R2=0.58 was found between normalized effective end-systolic stiffness and percent increase in heart-rate when pooling data points from all pigs.
Conclusion
Noninvasive MRE-derived end-systolic effective myocardial stiffness may be a surrogate for myocardial contractility.
Keywords: Myocardial Stiffness, Contractility, Cardiac MRE, MR Elastography
Introduction
Contractility is the intrinsic ability of the heart to contract independent of preload and afterload. Currently contractility is measured experimentally with pressure-volume (P-V) relationships (i.e. end-systolic pressure volume relationship) (1) and isolated papillary muscle stretching (2,3). However, P-V based methods and ex vivo mechanical stretch methods are invasive and are difficult to perform (4–6).
Noninvasive measures of cardiac function are sometimes used as surrogates for myocardial contractility. These measures include ejection fraction, wall motion, and myocardial strain (7–12). However, these are all noninvasive measures of myocardial wall motion and are thus indirect measures of myocardial contractility (13).
Myocardial stiffness is a more direct measure of the intrinsic myocardial contractility (2,3,14). Using P-V relations, Sagawa et al showed the relation between stiffness and contractility (2). Using isolated papillary muscles, Taubert et al showed that inotropic agents increase myocardial stiffness (3). However, to date myocardial stiffness has not been used to measure contractility because myocardial stiffness measurements have been invasive and requires technical precision.
Magnetic resonance elastography (MRE) is a novel imaging technique that can measure shear stiffness of soft tissues (15–22). In MRE external cyclic motion is applied to the region of interest and is synchronized with motion-encoding gradients (MEG) to encode displacements within the phase of MR images. The wave displacement images are then mathematically converted to stiffness maps (23). Several preliminary studies have examined changes in MRE-derived stiffness over the cardiac cycle (24–32), but to date, MRE has not been used to measure myocardial contractility which can be altered by infusion of epinephrine.
Therefore, the aim of this study is to determine whether increasing LV myocardial contractility by epinephrine infusion in an in vivo pig model is associated with increase in end-systolic MRE-derived effective myocardial stiffness.
Materials and Methods
Finite Element Modeling
In MRE wave displacements images are converted to stiffness maps though a mathematical process called inversion. The mathematical process used in this study is called phase gradient inversion, which uses the slope of the phase of the wave displacements to provide local wave speed information that can be used for calculation of stiffness (23). Phase gradient inversion assumes the interrogated regions are farther than a wavelength from the boundary, thus neglecting boundary conditions. During cardiac cycle myocardial wall thickness changes and during some phases of the cardiac cycle the wall is thinner than the wavelength of propagating waves. Therefore, we performed finite element modeling (FEM) to determine the lowest myocardial wall thicknesses for which phase gradient inversion could be performed.
3D frequency response FEM (33) at 80 Hz using COMSOL Multiphysics (3.4v, COMSOL AB, Stockholm, Sweden) was performed on a spherical shell model with varying radius, thickness and with known material properties (assuming homogenous, isotropic material with poisons ratio of 0.49999 and density of 1000kg/m3, known stiffness value ranging from 1–10kPa, inner radius ranging from 1.5–3.5cm, and thickness ranging from 0.5–2cm) to validate phase gradient inversion algorithm on a spherical shell assuming heart to be a sphere. Frequency response analysis provided displacement fields (i.e. X, Y, and Z) and a center slice displacement fields were provided as input to phase gradient inversion algorithm to estimate the stiffness and compare it to the known true stiffness value, which was provided as input to finite element modeling analysis.
In Vivo Cardiac MRE Experimental Setup
In vivo cardiac MRE was performed on five pigs (mean weight: 35.8 kg; 4 male and 1 female) in compliance with our institutional animal care and use committee. The animals were anesthetized by intramuscular injections of a cocktail containing telazol (5mg/kg), xylazine (2mg/kg) and glycopyrrolate (0.06mg/kg) and were maintained using an isoflurane inhalation anesthesia (1–3%) and mechanical ventilation.
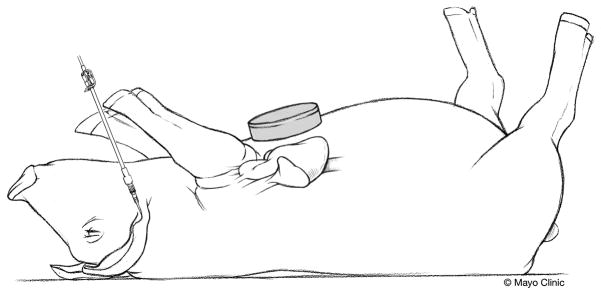
MRE was performed at baseline and after intravenous (IV) infusion of epinephrine through ear (Figure 1), which was used to increase myocardial contractility. For epinephrine infusion, each animal underwent continuous intravenous injection of epinephrine (1:1000; 1mg/ml solution) at a drip rate of 0.01μg/kg/min to increase the heart rate by 20% from the baseline, after which MRE was repeated. The infusion was then titrated to increase the heart rate by an additional 20%, and MRE was repeated. This process was repeated four or five times depending on the ability of the pig to tolerate increases in heart rate. Simultaneously, a fluid filled arterial pressure catheter with tip in the femoral artery (M1006B, Philips Medical Systems, Andover, MA) was used to record systemic blood pressure after each infusion.
Figure 1.
Schematic of the pig showing the MRE driver placed on the chest wall to induce external motion into the heart and an IV placed in the ear to infuse epinephrine.
Image Acquisition
All imaging was performed in a 1.5-Tesla MRI scanner (Signa Excite, GE Health Care, Milwaukee, WI). The pigs were positioned in the supine position and placed feet first into the scanner. A balanced steady state free precession sequence (bSSFP) with 20 cardiac phases was used to acquire a short-axis slice at the midventricular level after each infusion of epinephrine. The temporal resolution for obtaining a cardiac phase using bSSFP sequence is in the range of 46.2ms–51.2ms. MRE was performed on the same short axis slice as prescribed by the bSSFP sequence. During the acquisition the mechanical ventilation was stopped to avoid breathing artifacts in the images.
For MRE, mechanical waves were introduced into the heart by a pneumatic driver system as shown in Figure 1. A cine spoiled gradient echo MRE sequence (26,27) was used to obtain 5–10 cardiac phases of induced motion depending on the heart rate. The images with the smallest blood pool were assumed to be the end-systolic image after each infusion of epinephrine. Imaging parameters included TE/TR= 9.3/12.5 ms; FOV= 35 cm; α= 30°; slice thickness= 8 mm; acquisition matrix= 220×64; receiver bandwidth= ±62.5 kHz; sense acceleration factor= 2; excitation frequency= 80 Hz; heart rate= 85–188 bpm; VPS= 4–8; cardiac phases=5–10; and 4 MRE time offsets. 6.25-ms duration (160 Hz) motion encoding gradients were applied separately in the x, y and z directions to measure the in-plane and through-plane motion. For each polarizing direction the scan time was in the range of ~13–24 sec depending on the heart rate. For each cardiac phase the temporal resolution for a MRE scan was in the range of 50–100ms (i.e. TR* VPS; 12.5 * 4 to 8).
Image Analysis
The short-axis end-systolic MRE wave images in all the animals were masked with epicardial and endocardial contours to obtain only the left ventricular (LV) myocardium as shown in figure 2. These masked wave images in the x, y and z motion sensitization directions were first Fourier transformed in time to obtain the first harmonic displacement image and then filtered using a 4th order Butterworth band pass filter with cutoff values of 1–40 waves/FOV to remove longitudinal and high frequency displacements and additionally a 2-dimensional (2D) directional filter (34) was applied to remove reflected waves on all the masked wave images. Wave propagation within cardiac muscle is not planar but rather follows the orientation of muscle fiber bundles and is reflected from the myocardial wall in all directions. Therefore, directional filter was applied in 8 directions covering entire 360° (i.e. every 45°). These directionally filtered wave images were then analyzed using a 2D phase gradient MRE inversion algorithm with a kernel size of 5×5 (23) to obtain weighted sum effective stiffness estimates from all encoding directions. The weightings were based on the first harmonic displacement amplitudes from each encoding direction. Finally, 3×3 2D erosion was performed on the stiffness maps to remove edge effects and a mean effective stiffness was reported.
Figure 2.
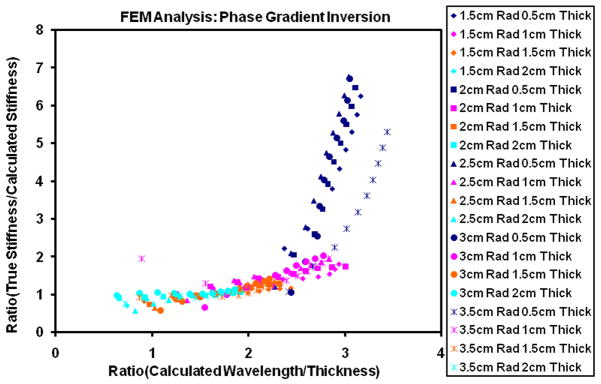
Plot demonstres the deviation of calculated stiffness values obtained using phase gradient inversion on a spherical shell when compared to true values with varying thickness of the shell. X-axis represents the ratio of calculated wavelength to the thickness. Y-axis represents ratio of true stiffness value to that of calculated stiffness value. True stiffness value is provided as input to finnite element modeling for generating displacement field. Calculated stiffness value is obtained by processing the displacment field using phase gradient inversion algorithm. Calculated wavelength is obtained by using calculated stiffness value in the following equation. μcal=ρ (fλcal) 2, where μcal is the stiffness obtained using phase gradien inversion, f is the excitation frequency (80 Hz), ρ density of the material 100kg/m3 and λcal is the calculated wavelength. From the plot it can be observed that phase gradient inversion is stable when the thickness almost equal to or greater than 1.5cm.
Statistical Analysis
FEM phase gradient inversion results were compared to the stiffness input into the model. The wall thickness for which FEM produced a stiffness result greater than ± 15% of the input stiffness was considered the minimal wall thickness to which phase gradient inversion could be applied and myocardial walls with thickness less than that were not analyzed in the in vivo study. For the in vivo pig study, stiffness measurements were normalized to the baseline stiffness, so that the relative increase in stiffness was measured for each pig. Stiffness measurements at baseline and at the initial epinephrine infusion were compared using a paired Student’s t-test. In addition, a least squares linear regression fit was performed between normalized end-systolic myocardial stiffness and the percent increase in heart rate with epinephrine infusion separately for each pig and also for all pigs combined.
Results
FEM analysis showed that the phase gradient inversion was stable when the thickness of the spherical shell was greater than or almost equal to 1.5cm thick (Figure 2). Figure 2 shows the plot of deviation of calculated stiffness values obtained using phase gradient inversion on a spherical shell when compared to true values with varying thickness of the shell. True stiffness measurements are those values (1–10kPa) which were provided as input to the FEM analysis. Calculated stiffness measurements are those obtained after processing FEM displacement data using phase gradient inversion. The end-systolic myocardial thickness was greater than or equal to 1.25 for all pigs at all infusion rates of epinephrine except for two pigs the thickness was 1.18cm and 1.19cm at baseline. The thickness measurements in all the pigs are shown in Table 1.
Table 1.
Effective end-systolic stiffness estimates from MRE, amount of epinephrine infusion in ml (in parenthesis), arterial blood pressure (systolic/diastolic, in parenthesis), end-systolic wall thickness (in parenthesis) for each pig (columns) and for each percent increase in heart rate from baseline (rows). For pig 1, there was a technical problem at 80% increase in heart rate, so we could not collect the data and for pigs 2, 4 and 5 we could obtain only 80% increase in heart rate as the baseline heart rate was higher in these pigs.
| Increase in Heart Rate (bpm) | Effective End-Systolic Stiffness ± SD(kPa), (Amount of Epinephrine Infusion (ml)) (Blood pressure (Systolic/Diastolic)), (Mean End-systolic Wall Thickness (cm)) | ||||
|---|---|---|---|---|---|
| Pig 1 | Pig 2 | Pig 3 | Pig 4 | Pig 5 | |
| 0% | 5.95±2, (0), (80/55), (1.34) | 5.22±1.8, (0), (94/61), (1.18) | 5.10±1.9, (0), (85/53), (1.25) | 5.64±3, (0), (82/60), (1.19) | 7.48±4.2, (0), (88/59), (1.49) |
| 20% | 8.35±3.7, (2.6), (76/52), (1.5) | 5.92±2, (3.1), (82/56), (1.44) | 9.24±4.2, (5.6), (90/53), (1.53) | 6.47±2.9, (4.1), (80/57), (1.37) | 8.61±5.4, (2.4), (67/49), (1.58) |
| 40% | 9.31±4.1, (7.9), (86/62), (1.55) | 5.92±2.2, (6.7), (89/62), (1.54) | 7.48±2.8, (13.7), (96/58), (1.61) | 7.68±3.6, (12), (82/62), (1.55) | 10.52±7.9, (8.5), (88/64), (1.67) |
| 60% | 10.58±5.5, (9.6), (86/62), (1.6) | 8.32±5.4, (23.1), (87/63), (1.62) | 8.06±3.2, (32.9), (101/61), (1.78) | 8.13±3.8, (28.2), (93/70), (1.59) | 11.45±8.1, (28.8), (128/81), (1.74) |
| 80% | -- | 10.29±6.1, (36.8), (106/75), (1.75) | 7.06±2.8, (84.1), (139/80), (1.66) | 8.82±4.9, (73.2), (122/90), (1.61) | 11.08±8.5, (74.8), (153/92), (1.68) |
| 100% | 14.03±7.6, (36.2), (100/68), (1.87) | -- | 7.92±3, (129.1), (160/95), (1.61) | -- | -- |
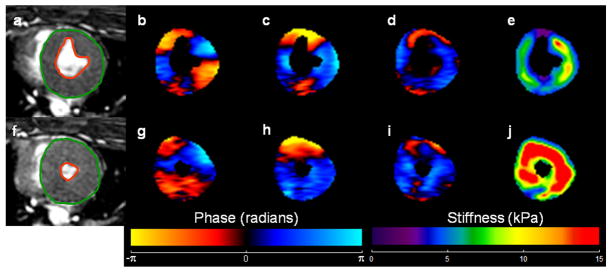
Effective myocardial stiffness increased linearly with epinephrine infusion in 4 of the 5 pigs. Representative MRE images from pig 1 at baseline and after a 5th infusion of epinephrine are shown in Figure 3.
Figure 3.
a, f) End-systolic short axis SSFP image of the LV in pig #1 at baseline and after 5th infusion of epinephrine respectively. The green and orange contours show the delineation of LV myocardium. b, c, d, g, h, i) Wave images in x, y, and z motion sensitization directions during end-systole. e, j) Corresponding stiffness maps at end-systole with a mean stiffness of 5.95 ± 2 kPa and 14.03 ± 7.6 kPa respectively.
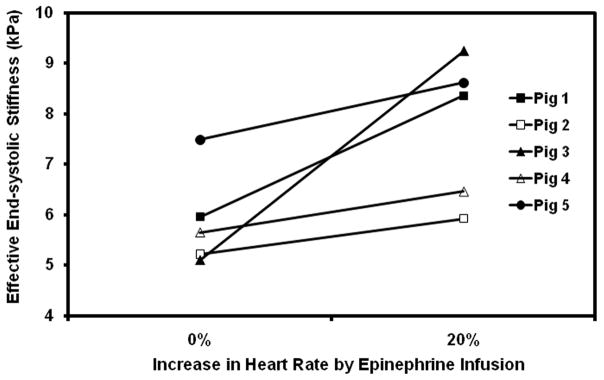
Myocardial stiffness significantly increased from baseline to the first infusion in all pigs (p =0.047) (Figure 4), even though systolic and diastolic blood pressure was unchanged or dropped at the initial infusion as shown in Table 1. This increase corresponds to the expected increase in contractility from activation of β1 receptors at the initial doses of epinephrine.
Figure 4.
Plot of effective end-systolic stiffness versus baseline and 20% increased heart rate during initial infusion of epinephrine.
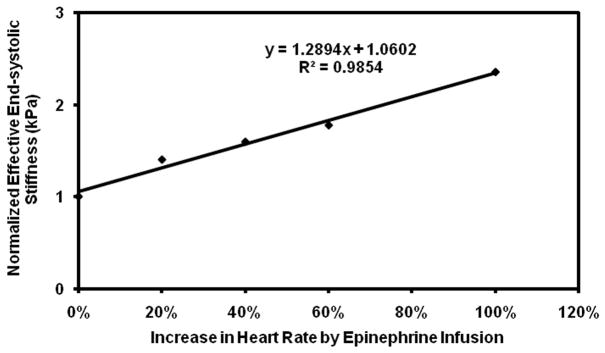
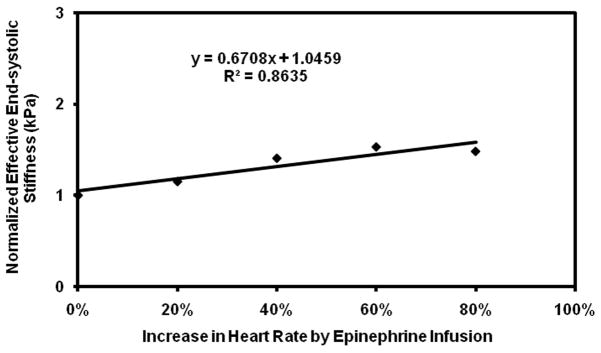
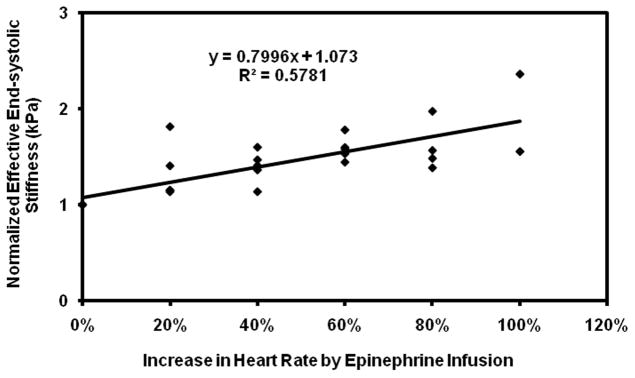
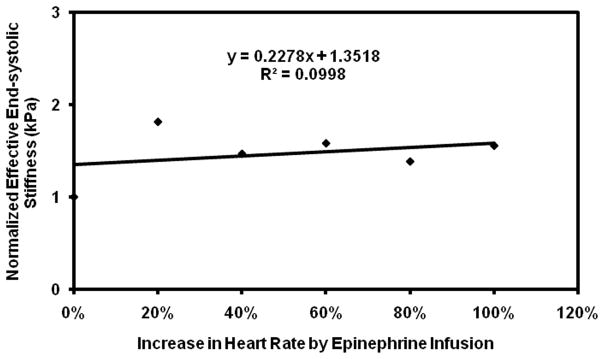
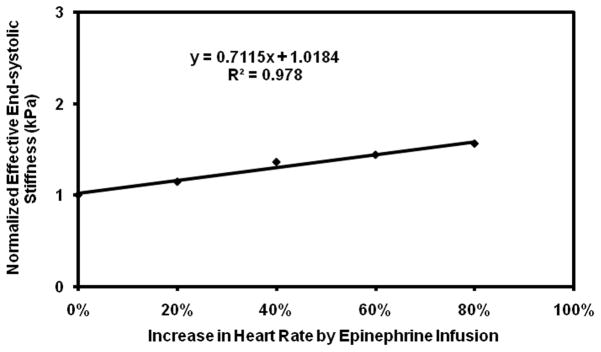
Subsequent infusions of epinephrine showed a more variable response. While pig 3 showed the expected increase in stiffness with initial doses of epinephrine, the rapid initial increase in stiffness was followed by a plateau, making the linear correlation poor with an R2 value of 0.1. Pig 3 also required much higher doses of epinephrine than the other pigs to achieve the same increases in heart rate (Table 1). In addition, while the remaining pigs showed good linear fits with R2 value ranging from 0.86–0.99, when considered individually (Figure 5–9), their fits were different from each other. Because of these factors, the overall correlation when grouping all animals was only fair (Figure 10), with an R2 = 0.58. When excluding pig 3 from analysis, the overall R2 value was found to be 0.78.
Figure 5.
Plot of normalized effective end-systolic stiffness versus percent increase in heart rate in pig 1.
Figure 9.
Plot of normalized effective end-systolic stiffness versus percent increase in heart rate in pig 5.
Figure 10.
Plot of normalized effective end-systolic stiffness versus percent increase in heart rate pooled from all the pigs.
Discussion
This study demonstrated that end-systolic MRE-derived effective myocardial stiffness increased with increasing epinephrine infusion, suggesting that MRE-derived effective stiffness may be used as a surrogate for myocardial contractility.
The key finding in this study is that stiffness increased from baseline to the first infusion. This is because at initial dose of epinephrine,β-1 receptor agonism predominates and increases myocardial contractility (35) while peripheral vascular resistance (afterload) decreases due to activation of β-2 receptors. MRE-derived stiffness increased in spite of decreasing or no change in peripheral blood pressure in all animals, showing that MRE stiffness measurement follows the expected change in contractility independent of loading conditions.
However, the overall linear relationship between epinephrine dose and MRE-stiffness was weakened by the response of pig 3. This pig 3 (Figure 7) showed not only a plateau in stiffness with increasing doses of epinephrine, but also appears to have had an abnormal response to epinephrine, as this pig required higher doses of epinephrine (Table 1) to achieve comparable increases in heart rate and blood pressure as the other pigs. It is well known in humans that there can be variable response to epinephrine and other β receptor agonists, which is thought to be caused by genetic polymorphisms in β receptors (36). Given that this pig showed abnormal heart rate and blood pressure response to epinephrine, we can speculate that this pig had such a polymorphism, though we lack definitive evidence of this.
Figure 7.
Plot of normalized effective end-systolic stiffness versus percent increase in heart rate in pig 3.
In addition, the overall linear relationship between epinephrine dose and MRE stiffness was weakened by inter animal variation between the remaining pigs. Thus while pig 1, 2, 4, and 5 have good linear fits when considered individually, their fits are sufficiently different that a global equation (as in Figure 10) cannot be used in correlating stiffness to increase in heart rate with epinephrine infusion. Nevertheless, the key finding in this study is that MRE-derived end- systolic effective stiffness was associated with infusion of epinephrine.
Our results are consistent with previous studies, using invasive techniques that identified a positive relationship between stiffness and contractility (1,4–6). Using ex vivo mechanical stretch testing, contracting stiffness of isolated cardiac muscle has been shown to increase with the addition of inotropic agents (3). Using P-V measures, the end systolic pressure volume relation (ESPVR) is an accepted, load independent measure of contractility, which increases with inotropic agents (2), and is considered a measure of LV chamber stiffness. MRE has the advantage of being a noninvasive method of measuring an effective myocardial stiffness, an accepted measure of contractility.
While there is an emerging cardiac MRE literature (24–32,37), to date no other group has attempted to use end-systolic stiffness as a measure of contractility and no other group has measured end-systolic stiffness during inotrope infusion. In addition, our technique is novel compared to those previous MRE studies. Previous MRE studies have used MRE-encoded displacement amplitudes across the cardiac cycle in a region of interest to estimate stiffness. Using displacement amplitudes to measure stiffness is relative and can only be used to compare one region of myocardium to another within the same subject. Our technique can create stiffness maps, using phase and amplitude information, and can in principle be compared between individuals. Another previous study (30) has attempted to measure stiffness using manual line profiles in a region of interest, which is limited to a small region and is operator dependent. The technique used in the current study can spatially resolve effective stiffness throughout the myocardium and this analysis can be done automatically.
There are several limitations to this study. As stated above, we lack definitive evidence that pig 3 had a genetic polymorphism causing an abnormal response to epinephrine. Also, we used the dose of epinephrine infusion as the reference standard for myocardial contractility, whereas the most widely accepted in vivo measurement of myocardial contractility is one derived from P-V relationships, which we did not perform.
In addition, our MRE technique has several limitations. First, we only acquired single slice data and therefore a two-dimensional (2D) phase gradient inversion was performed. Wave propagation within cardiac muscle is not planar but rather follows the orientation of muscle fiber bundles; therefore, a true three-dimensional (3D) inversion is required to obtain the effective stiffness of the myocardium. 3D inversion requires a 3D volumetric data acquisition, which in turn requires long scan times and is not currently feasible. Future work will involve incorporating 3D inversion by accelerating data acquisition, so that volumetric data can be obtained in a single breath hold. Second, the inversion used in this study ignores boundary conditions, whereas the heart is a bounded object with dimensions smaller than the wavelength and a complicated geometry. However, during end-systole the myocardial wall is fairly thick, and as shown by our FEM analysis, the myocardial walls were thick enough such that boundary effects were minimal in this study. However, in order to achieve stable stiffness estimates, a finer mesh resolution is required for FEM analysis. Based on our system requirements, we could only reach to certain level of mesh resolution. Therefore, further investigation is needed based on mesh resolution to determine the robustness of our FEM analysis in estimating the stiffness using phase gradient inversion. Third, the stiffness measurements obtained in this study were relative (normalized) within a pig and are not absolute. For this, and because of the anisotropic nature of the heart, we call the stiffness “effective” and it is difficult to compare the stiffness measurements obtained in this study against previous measurements (24–32,37).
Despite these limitations we have an association between MRE-derived end-systolic effective stiffness and heart rate at initial epinephrine doses, in the range where β-1 agonism dominates and contractility increases. Future applications of MRE will be required for further validation, in particular using end-systolic pressure volume relationships as a reference standard.
In conclusion, noninvasive MRE-derived end-systolic effective myocardial stiffness may be a surrogate for intrinsic myocardial contractility. With future developments of cardiac MRE, myocardial stiffness can be a potentially important clinical parameter to diagnose a variety cardiac disease states in which traditional, functional measures of systolic function have proven inadequate for detecting abnormality.
Figure 6.
Plot of normalized effective end-systolic stiffness versus percent increase in heart rate in pig 2.
Figure 8.
Plot of normalized effective end-systolic stiffness versus percent increase in heart rate in pig 4.
Acknowledgments
Authors would like to thank Joseph A. Rysavy, for his contribution in preparing the animals and infusing animals with epinephrine.
Grant Support: American Heart Association 09POST2250081 and National Institutes of Health Grant EB001981, EB007593.
No relationship with the industry.
References
- 1.Kass DA, Maughan WL, Guo ZM, Kono A, Sunagawa K, Sagawa K. Comparative influence of load versus inotropic states on indexes of ventricular contractility: experimental and theoretical analysis based on pressure-volume relationships. Circulation. 1987;76(6):1422–1436. doi: 10.1161/01.cir.76.6.1422. [DOI] [PubMed] [Google Scholar]
- 2.Sagawa K, Suga H, Shoukas AA, Bakalar KM. End-systolic pressure/volume ratio: a new index of ventricular contractility. Am J Cardiol. 1977;40(5):748–753. doi: 10.1016/0002-9149(77)90192-8. [DOI] [PubMed] [Google Scholar]
- 3.Taubert K, Willerson JT, Shapiro W, Templeton GH. Contraction and resting stiffness of isolated cardiac muscle: effects of inotropic agents. Am J Physiol. 1977;232(3):H275–282. doi: 10.1152/ajpheart.1977.232.3.H275. [DOI] [PubMed] [Google Scholar]
- 4.Burkhoff D, Mirsky I, Suga H. Assessment of systolic and diastolic ventricular properties via pressure-volume analysis: a guide for clinical, translational, and basic researchers. Am J Physiol Heart Circ Physiol. 2005;289(2):H501–512. doi: 10.1152/ajpheart.00138.2005. [DOI] [PubMed] [Google Scholar]
- 5.Mirsky I, Parmley WW. Assessment of passive elastic stiffness for isolated heart muscle and the intact heart. Circ Res. 1973;33(2):233–243. doi: 10.1161/01.res.33.2.233. [DOI] [PubMed] [Google Scholar]
- 6.Mirsky I, Pasipoularides A. Clinical assessment of diastolic function. Prog Cardiovasc Dis. 1990;32(4):291–318. doi: 10.1016/0033-0620(90)90018-w. [DOI] [PubMed] [Google Scholar]
- 7.Tabima DM, Hacker TA, Chesler NC. Measuring right ventricular function in the normal and hypertensive mouse hearts using admittance-derived pressure-volume loops. Am J Physiol Heart Circ Physiol. 2010;299(6):H2069–2075. doi: 10.1152/ajpheart.00805.2010. [DOI] [PMC free article] [PubMed] [Google Scholar]
- 8.Lieberman AN, Weiss JL, Jugdutt BI, Becker LC, Bulkley BH, Garrison JG, Hutchins GM, Kallman CA, Weisfeldt ML. Two-dimensional echocardiography and infarct size: relationship of regional wall motion and thickening to the extent of myocardial infarction in the dog. Circulation. 1981;63(4):739–746. doi: 10.1161/01.cir.63.4.739. [DOI] [PubMed] [Google Scholar]
- 9.Zerhouni EA, Parish DM, Rogers WJ, Yang A, Shapiro EP. Human heart: tagging with MR imaging--a method for noninvasive assessment of myocardial motion. Radiology. 1988;169(1):59–63. doi: 10.1148/radiology.169.1.3420283. [DOI] [PubMed] [Google Scholar]
- 10.Gotte MJ, van Rossum AC, Twisk JWR, Kuijer JPA, Marcus JT, Visser CA. Quantification of regional contractile function after infarction: strain analysis superior to wall thickening analysis in discriminating infarct from remote myocardium. J Am Coll Cardiol. 2001;37(3):808–817. doi: 10.1016/s0735-1097(00)01186-4. [DOI] [PubMed] [Google Scholar]
- 11.Domanski MJ, Follman D, Kravitz M, Mirsky II. Noninvasive Assessment of Regional and Global Myocardial Contractility in Normal Control Subjects and in Patients with Dilated Cardiomyopathies. Echocardiography (Mount Kisco, NY) 1998;15(5):429–442. doi: 10.1111/j.1540-8175.1998.tb00629.x. [DOI] [PubMed] [Google Scholar]
- 12.Domanski MJ, Follmann D, Mirsky II. A New Approach to Assessing Regional and Global Myocardial Contractility. Echocardiography (Mount Kisco, NY) 1997;14(1):1–8. doi: 10.1111/j.1540-8175.1997.tb00683.x. [DOI] [PubMed] [Google Scholar]
- 13.Abraham TP, Nishimura RA. Myocardial strain: can we finally measure contractility? J Am Coll Cardiol. 2001;37(3):731–734. doi: 10.1016/s0735-1097(00)01173-6. [DOI] [PubMed] [Google Scholar]
- 14.Royse CF, Royse AG, Rohrlach R, Wright CE, Angus JA. The cardiovascular effects of adrenaline, dobutamine and milrinone in rabbits using pressure-volume loops and guinea pig isolated atrial tissue. Anaesth Intensive Care. 2007;35(2):180–188. doi: 10.1177/0310057X0703500207. [DOI] [PubMed] [Google Scholar]
- 15.Dresner MA, Rose GH, Rossman PJ, Muthupillai R, Manduca A, Ehman RL. Magnetic resonance elastography of skeletal muscle. J Magn Reson Imaging. 2001;13(2):269–276. doi: 10.1002/1522-2586(200102)13:2<269::aid-jmri1039>3.0.co;2-1. [DOI] [PubMed] [Google Scholar]
- 16.Woodrum DA, Herrmann J, Lerman A, Romano AJ, Lerman LO, Ehman RL. Phase-contrast MRI-based elastography technique detects early hypertensive changes in ex vivo porcine aortic wall. J Magn Reson Imaging. 2009;29(3):583–587. doi: 10.1002/jmri.21702. [DOI] [PMC free article] [PubMed] [Google Scholar]
- 17.Woodrum DA, Romano AJ, Lerman A, Pandya UH, Brosh D, Rossman PJ, Lerman LO, Ehman RL. Vascular wall elasticity measurement by magnetic resonance imaging. Magn Reson Med. 2006;56(3):593–600. doi: 10.1002/mrm.20991. [DOI] [PubMed] [Google Scholar]
- 18.Lopez O, Amrami KK, Manduca A, Rossman PJ, Ehman RL. Developments in dynamic MR elastography for in vitro biomechanical assessment of hyaline cartilage under high-frequency cyclical shear. J Magn Reson Imaging. 2007;25(2):310–320. doi: 10.1002/jmri.20857. [DOI] [PubMed] [Google Scholar]
- 19.Muthupillai R, Lomas DJ, Rossman PJ, Greenleaf JF, Manduca A, Ehman RL. Magnetic resonance elastography by direct visualization of propagating acoustic strain waves. Science (New York, NY. 1995;269(5232):1854–1857. doi: 10.1126/science.7569924. [DOI] [PubMed] [Google Scholar]
- 20.Sack I, Beierbach B, Hamhaber U, Klatt D, Braun J. Non-invasive measurement of brain viscoelasticity using magnetic resonance elastography. NMR Biomed. 2008;21(3):265–271. doi: 10.1002/nbm.1189. [DOI] [PubMed] [Google Scholar]
- 21.Sinkus R, Tanter M, Xydeas T, Catheline S, Bercoff J, Fink M. Viscoelastic shear properties of in vivo breast lesions measured by MR elastography. Magnetic Resonance Imaging. 2005;23:159–165. doi: 10.1016/j.mri.2004.11.060. [DOI] [PubMed] [Google Scholar]
- 22.Yin M, Talwalkar JA, Glaser KJ, Manduca A, Grimm RC, Rossman PJ, Fidler JL, Ehman RL. Assessment of hepatic fibrosis with magnetic resonance elastography. Clinical Gastroenterology and Hepatology. 2007;5:1207–1213. doi: 10.1016/j.cgh.2007.06.012. [DOI] [PMC free article] [PubMed] [Google Scholar]
- 23.Manduca A, Oliphant TE, Dresner MA, Mahowald JL, Kruse SA, Amromin E, Felmlee JP, Greenleaf JF, Ehman RL. Magnetic resonance elastography: non-invasive mapping of tissue elasticity. Med Image Anal. 2001;5(4):237–254. doi: 10.1016/s1361-8415(00)00039-6. [DOI] [PubMed] [Google Scholar]
- 24.Elgeti T, Laule M, Kaufels N, Schnorr J, Hamm B, Samani A, Braun J, Sack I. Cardiac MR elastography: comparison with left ventricular pressure measurement. J Cardiovasc Magn Reson. 2009;11:44. doi: 10.1186/1532-429X-11-44. [DOI] [PMC free article] [PubMed] [Google Scholar]
- 25.Elgeti T, Rump J, Hamhaber U, Papazoglou S, Hamm B, Braun J, Sack I. Cardiac magnetic resonance elastography. Initial results Invest Radiol. 2008;43(11):762–772. doi: 10.1097/RLI.0b013e3181822085. [DOI] [PubMed] [Google Scholar]
- 26.Kolipaka A, Araoz PA, McGee KP, Manduca A, Ehman RL. Magnetic resonance elastography as a method for the assessment of effective myocardial stiffness throughout the cardiac cycle. Magn Reson Med. 2010;64:862–870. doi: 10.1002/mrm.22467. [DOI] [PMC free article] [PubMed] [Google Scholar]
- 27.Kolipaka A, McGee KP, Araoz PA, Glaser KJ, Manduca A, Ehman RL. Evaluation of a rapid, multiphase MRE sequence in a heart-simulating phantom. Magn Reson Med. 2009;62(3):691–698. doi: 10.1002/mrm.22048. [DOI] [PMC free article] [PubMed] [Google Scholar]
- 28.Kolipaka A, McGee KP, Araoz PA, Glaser KJ, Manduca A, Romano AJ, Ehman RL. MR elastography as a method for the assessment of myocardial stiffness: comparison with an established pressure-volume model in a left ventricular model of the heart. Magn Reson Med. 2009;62(1):135–140. doi: 10.1002/mrm.21991. [DOI] [PMC free article] [PubMed] [Google Scholar]
- 29.Sack I, Rump J, Elgeti T, Samani A, Braun J. MR elastography of the human heart: Noninvasive assessment of myocardial elasticity changes by shear wave amplitude variations. Magn Reson Med. 2009;61(3):668–677. doi: 10.1002/mrm.21878. [DOI] [PubMed] [Google Scholar]
- 30.Sinkus R, Robert B, Gennisson J-L, Tanter M, Fink M. Single Breath Hold Transient MR-Elastography of the Heart - Imaging Pulsed Shear Wave Propagation Induced by Aortic Valve Closure. Seattle, USA. Proceedings of the 14th Annual Meeting of ISMRM; 2006. p. 77. [Google Scholar]
- 31.Elgeti T, Beling M, Hamm B, Braun J, Sack I. Elasticity-based determination of isovolumetric phases in the human heart. J Cardiovasc Magn Reson. 2010;12(1):60–68. doi: 10.1186/1532-429X-12-60. [DOI] [PMC free article] [PubMed] [Google Scholar]
- 32.Elgeti T, Beling M, Hamm B, Braun J, Sack I. Cardiac Magnetic Resonance Elastography: Toward the Diagnosis of Abnormal Myocardial Relaxation. Invest Radiol. 2010;45(12):782–787. doi: 10.1097/RLI.0b013e3181ec4b63. [DOI] [PubMed] [Google Scholar]
- 33.Kolipaka A, McGee KP, Manduca A, Romano AJ, Glaser KJ, Araoz PA, Ehman RL. Magnetic resonance elastography: Inversions in bounded media. Magn Reson Med. 2009;62(6):1533–1542. doi: 10.1002/mrm.22144. [DOI] [PMC free article] [PubMed] [Google Scholar]
- 34.Manduca A, Lake DS, Kruse SA, Ehman RL. Spatio-temporal directional filtering for improved inversion of MR elastography images. Med Image Anal. 2003;7(4):465–473. doi: 10.1016/s1361-8415(03)00038-0. [DOI] [PubMed] [Google Scholar]
- 35.Allwood MJ, Cobbold AF, Ginsburg J. Peripheral vascular effects of noradrenaline, isopropylnoradrenaline and dopamine. Br Med Bull. 1963;19:132–136. doi: 10.1093/oxfordjournals.bmb.a070031. [DOI] [PubMed] [Google Scholar]
- 36.Small KM, McGraw DW, Liggett SB. Pharmacology and physiology of human adrenergic receptor polymorphisms. Annu Rev Pharmacol Toxicol. 2003;43:381–411. doi: 10.1146/annurev.pharmtox.43.100901.135823. [DOI] [PubMed] [Google Scholar]
- 37.Robert B, Sinkus R, Gennisson JL, Fink M. Application of DENSE-MR-elastography to the human heart. Magn Reson Med. 2009;62(5):1155–1163. doi: 10.1002/mrm.22124. [DOI] [PubMed] [Google Scholar]
- 38.De Backer D, Creteur J, Silva E, Vincent JL. Effects of dopamine, norepinephrine, and epinephrine on the splanchnic circulation in septic shock: which is best? Crit Care Med. 2003;31(6):1659–1667. doi: 10.1097/01.CCM.0000063045.77339.B6. [DOI] [PubMed] [Google Scholar]


