Abstract
Background/Purpose
Advances in sensory technologies provides a method to accurately assess activity levels of people with stroke in their community. This information could be used to determine the effectiveness of rehabilitation interventions as well as provide behavioral enhancing feedback. The purpose of this study was to assess the accuracy of a novel shoe-based sensor system (SmartShoe) to identify different functional postures and steps in people with stroke. The SmartShoe system consists of five force sensitive resistors built into a flexible insole and an accelerometer on the back of the shoe. Pressure and acceleration data are sent via Bluetooth to a smart phone.
Methods
Participants with stroke wore the SmartShoe while they performed activities of daily living (ADL) in sitting, standing and walking. Data from four participants were used to develop a multi-layer perceptron artificial neural network (ANN) to identify sitting, standing, and walking. A signal-processing algorithm used data from the pressure sensors to estimate number of steps taken while walking. The accuracy, precision and recall of the ANN for identifying the three functional postures were calculated using data from a different set of participants. Agreement between steps identified by SmartShoe and actual steps taken was analyzed using the Bland Altman method.
Results
The SmartShoe was able to accurately identify sitting, standing and walking. Accuracy, precision and recall were all greater than 95%. The mean difference between steps identified by SmartShoe and actual steps was less than 1 step.
Discussion
The SmartShoe was able to accurately identify different functional postures using a unique combination of pressure and acceleration data in people with stroke as they performed different ADLs. There was a strong level of agreement between actual steps taken and steps identified using the SmartShoe. Further study is needed to determine if the SmartShoe could be used to provide valid information on activity levels of people with stroke while they go about their daily lives in their home and community.
INTRODUCTION
Stroke is the third leading cause of death and the leading cause of disability in the United States.1 People who experience a stroke are less active than healthy individuals and many of them require assistance to walk.2,3 Even individuals with relatively good recovery of walking ability are often inactive and may not be able to effectively access their community.3 This inactivity leads to further deconditioning, which in turn plays a role in the development of secondary complications and may increase the risk of another stroke and an increased dependence in activities of daily living (ADL).4
Common goals of stroke survivors are to improve their activity level and social participation.5,6 In current practice and research, performance based outcome measures taken in a clinical or laboratory setting and self-report measures are used to assess the effectiveness of rehabilitation interventions to meet these goals.7 However, both of these have certain limitations.7 Performance-based outcome measures (i.e. Berg Balance scale or gait speed) only assess a patient's performance at the time it was taken and in the environment it was taken. This may not truly reflect what the patient does in their home and community.8 Self-report measures may be limited by bias and recall ability of the reporter.
Advances in sensor technology, signal processing and pattern recognition techniques provide the ability to accurately and precisely measure activity levels in an unobtrusive manner.9-11 Accelerometers are relatively small, inexpensive sensors that can be worn on single or multiple body parts, which measure the amount, frequency, intensity, and duration of movement. Data from the accelerometer(s) can be stored and analyzed using machine learning algorithms to identify different patterns of movement.12
Accelerometer-based sensors are increasingly being used to measure activity in people with stroke. Two recent, large, randomized clinical trials used body-worn sensors as outcome measures to determine the effectiveness of constraint-induced movement therapy13 and locomotor training using a body weight support system.14 Some of the limitations of the sensors used in these and other studies are that they require the user to put on the sensor (possibly multiple sensors), which may be cumbersome, they only measure upper extremity (UE) movement and walking activity, they do not provide real-time feedback to the user, and in some sensors the type of information collected (activity counts) may not be meaningful to the wearer or a clinician.
We developed a novel shoe-based sensor system, SmartShoe, which combines two types of sensors: a tri-axial accelerometer that is clipped on the side of a shoe and five force sensitive resistors embedded in a flexible insole.10,15 Pressure and acceleration data from the SmartShoe are analyzed using machine-learning techniques to identify when the user is sitting, standing, and walking, as well as steps taken and specific gait parameters. We selected to measure time in sitting, standing, and walking as most activities that people perform throughout the day are likely done in one of these three main postures.
Many healthy adults do not exercise enough and spend too much time in sitting and other sedentary behaviors.16 This is likely true to an even greater degree in people with stroke. Direct measurement of activity with sensors in the home and community offers a possible means to provide behavioral enhancing feedback to increase activity levels. Daily self-monitoring of energy expenditure via an arm-worn accelerometer-based sensor is an effective method of reducing weight and increasing activity in people who are overweight or obese.17,18 Our long-term goal is to use the SmartShoe as a platform to not only measure activity levels in people with stroke in the home and community, but also to provide feedback to increase activity levels and walking performance.
In our earlier research the SmartShoe was able to identify if participants with stroke were sitting, standing (while statically maintaining these positions), or walking10 and temporal gait parameters (including steps taken) while they walked a short distance over a GaitRite mat.19 The SmartShoe was 77%-100% accurate in identifying sitting, standing or walking. In that study, data was sent to a base computer via a wireless board for later processing using a Support Vector Machine (SVM), a form of machine learning.20 The SVM required a long time to process the data and could not analyze the data in real time, limiting the SmartShoe's ability to provide real-time feedback on activity levels especially if a full day's worth of activity data were collected. Other limitations of the study were that the participants were not actually performing activities of daily living while in the different functional positions (they statically stayed in sitting or standing for one minute), the accuracy of the SVM in identifying postures was not validated against an independent group of participants, and the pressure and acceleration data were sent to a base computer, limiting the use of the SmartShoe in the community.10,19
The purpose of the current study was to determine the accuracy of an improved version of the SmartShoe to identify three functional postures (sitting, standing, and walking) in people with stroke while they performed common ADLs and to identify steps taken while walking.
METHODS
Participants
Participants with stroke were recruited from local outpatient rehabilitation facilities. Inclusion criteria were: at least 3 months post stroke, able to walk with at most minimal assistance with or without an assistive device on level surfaces (score of ≥2 on Functional Ambulation Categories21,22), able to transition between sitting and standing stand without physical assistance from a standard height chair with or without the use of upper extremity assistance, able to stand without physical assistance for 60 seconds, and score of ≥24 on the Mini Mental State Exam.23 Potential participants were excluded if they had other health conditions that may have affected their ability to sit, stand, or walk independently prior to their stroke (i.e. severe rheumatoid arthritis, Parkinson's disease). All participants provided informed consent and the study was approved by the Clarkson University Institutional Review Board.
Instrument
The SmartShoe sensor system collects plantar pressure and heel acceleration data through a wearable sensor system embedded into a pair of shoes (Figure 1a). Each shoe had a flexible insole, which incorporated five force-sensitive resistors (Interlink Inc., Camarillo, CA) positioned under the heel, heads of 1st, 3rd and 5th metatarsal and the great toe (Figure 1b). This positioning allowed for the potential to differentiate aspects of the gait cycle such as initial contact, mid stance, and terminal stance as well as accounting for differences in loading of anterior and posterior areas of the foot during different activities. A 3-dimensional accelerometer positioned on the back of the shoe, detected orientation of the shoe (and foot) with respect to gravity and characterized the motion trajectory. A battery, power switch and wireless board were installed on a rigid circuit board glued to the back of the shoe (as shown in Figure 1a). The tail of the flexible insole was fed through a narrow cut in the shoe and connected to the same circuit board. The sensor system was very lightweight and created no observable interference with subjects’ movement patterns. The SmartShoe system can be worn and collect pressure and sensor data for approximately 12 hours before recharging is needed. This design also has a low wearer burden. The wearer only needs to put on their shoe.
Figure 1a.
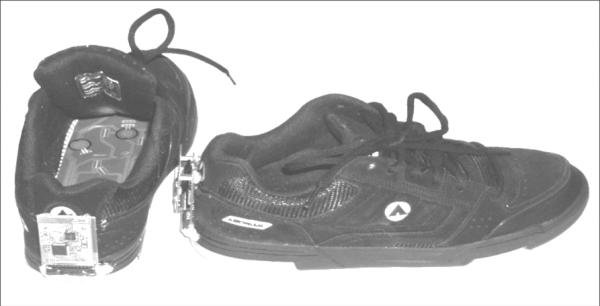
SmartShoe sensor system with accelerometer, battery, power switch and wireless board on the back of shoe with the flexible insole with embedded force sensitive resistors.
Figure 1b.
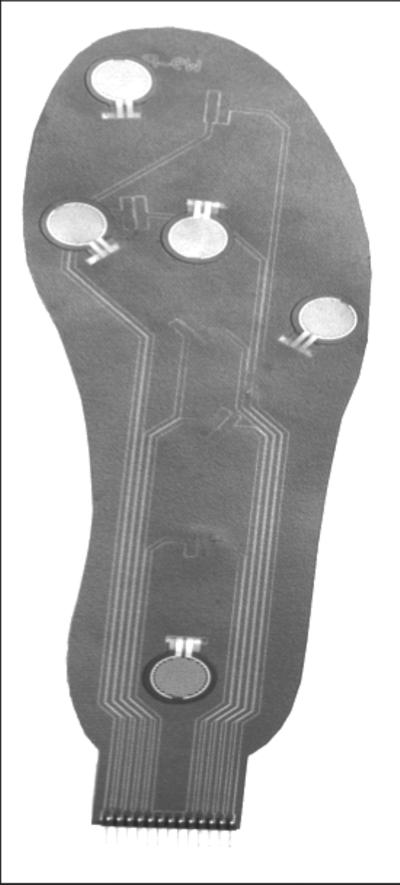
Close-up view of flexible insole with embedded force sensitive resistors.
Pressure and acceleration signals were sampled at 400Hz and downsampled to 25Hz by averaging of every 16 consecutive samples in order to reduce measurement noise and reduce power consumption of the wireless transmission.
Procedure
After providing informed consent the following information and outcome measures were gathered in order to characterize the sample: age, gender, time since stroke, location of stroke, and use of assistive device and orthotic, Berg balance scale,24 gait speed,25,26 lower extremity Fugl-Meyer motor score,27 and Stroke Impact Scale 16 score.28,29
After these outcome measures were taken, participants donned an appropriately sized SmartShoe on each foot and wore them while performing activities of daily living (ADL) in sitting and standing. In sitting participants performed the following tasks: read a magazine, worked on a computer, simulated eating and drinking, and sat comfortably. In standing participants performed the following tasks: folded laundry, don/doffed a coat, placed objects in a cupboard that was at approximately head level, and stood comfortably. Participants were not given any instructions on how to perform the task or how to position themselves while performing the tasks in sitting or standing. Participants performed three, 1-minute trials of each task. The SmartShoe system was turned on and pressure and acceleration data were collected only during the 1-minute trial during which the participant was performing the task in sitting or standing. Pressure and acceleration data were stored on the smart phone and downloaded after data collection was complete for processing.
In addition to performing the ADL tasks in sitting and standing, participants walked for two minutes at their self-selected pace (SSP) and fastest safe pace (FSP) around a 30-meter rectangular track. Participants performed three, 2-minute walking trials at each pace. Participants were videotaped while they walked. Similar to the trials in sitting and standing, the SmartShoe system was turned on and pressure and acceleration data were collected only during each two-minute walking trail. This allowed us to know how much time was spent in the three different postures for later comparison to time in the postures identified by the SmartShoe sensor system. Pressure and acceleration data were stored on the smart phone and downloaded for data processing after all data collection was complete. The order in which the trials of tasks in sitting, standing and walking were performed was randomized using a random number generator.
Data Processing
A multi-layer perceptron artificial neural network (ANN) was trained to classify the pressure and acceleration data as one of three functional postures: sitting, standing, or walking. An ANN is a robust method of supervised machine learning that can use training examples to learn the dependencies in the data and apply the learned model to recognition of previously unseen data.30
Training of the ANN creates a non-linear mapping that activates one of the outputs (representing sitting, standing, or walking) in response to a specific combination of sensor data on its inputs. When training an ANN the activation function, error function, learning algorithm, and learning rate must be selected. A symmetrical sigmoid function was used for the activation function. Mean squared error was used for error evaluation during training. A standard backpropagation training algorithm was used with a learning rate of 0.7.
Classification was performed using 2-second time intervals, or epochs. Several features were computed from raw pressure and acceleration data, such as standard deviation of each sensor (both pressure and acceleration) over an epoch; number of mean crossings, which indicated the number of times the sensors oscillated about the mean with amplitude greater than a predefined threshold; the sum of the readings from 5 pressure sensors; and a single logical, true or false, value which indicated whether the maximum of sums was greater than a threshold which was pre-determined based on population data. The raw sensor data and these features were used as the feature vector for the ANN to classify the type of behavior (sitting, standing, walking) occurring in each epoch.
People with stroke have very heterogeneous movement patterns. In order for the ANN to be useful for classifying activity in the wider population of people with stroke, we purposefully chose four participants with different movement patterns and used their acceleration and pressure data to develop and train the ANN. We then validated the accuracy of the created ANN using the pressure and acceleration data from the other eight subjects. To summarize, the ANN was “told” that specific combinations of pressure and acceleration data were sitting, standing and walking from the trials of the four selected participants. The ANN “learns” from this data that certain patterns of pressure and acceleration should be identified as sitting, standing and walking. The ANN was then given the combined pressure and acceleration data from the eight other participants and “told” to identify time in sitting, standing and walking for each the eight participants based on what it “learned” from the data from the four selected participants.
In order to further characterize walking activity, we used an algorithm that we developed previously that uses pressure data from the force sensitive resistors (FSR) embedded in the SmartShoe to detect initial contact and foot-off events in order to identify steps.19 The threshold to detect initial contact and foot off events is calculated by defining the average maxima and minima of the sum of the five FSR signals (sumFSR). For the sumFSR signal, all the local maxima and local minima are obtained. The average of these data points define maxima and minima thresholds. The difference between the average values defines the threshold to obtain the initial contact and foot off. Specific information on this algorithm can be found in the study by Lopez-Meyer, et al.19 We previously validated this algorithm against a commercially available instrumented walkway.19
Data Analysis
We validated the SmartShoe and accompanying signal processing techniques (ANN and algorithm for step detection from pressure data) ability to identify sitting, standing, and walking and from the walking data steps taken. The accuracy, precision and recall of the ANN to identify sitting, standing and walking were calculated. The accuracy was defined as total number of true positive (TP) identifications by the ANN divided by the sum of the TP, false positives (FP), and false negatives (FN), Accuracy=TP/(TP+FN+FP). Class-specific precision and recall are objective measures of the ability of an ANN to recognize specific postures and activities. Recall is defined as the number of TP divided by the sum of the TP and FN, Recall=TP/(TP+FN). Precision is defined as the number of TP divided by the sum of the TP and FP, Precision=TP/(TP+FP). The actual time spent in each of the three postures was known as each trial in sitting and standing lasted 1 minute and each walking trial lasted 2 minutes. A cumulative confusion matrix illustrates the classification accuracy of the ANN by combining classification of epoch results from all subjects by summation. The rows of the table correspond to actual postures/activities assumed by participants and columns correspond to predicted postures/activities made by the classifier from the sensor data.
We analyzed the agreement between SmartShoe identified steps to actual steps taken by having a researcher count actual steps taken based in the video record. One researcher counted the steps taken from the video on two separate occasions and the mean of these two values was used in the analysis. Intraclass correlation coefficient (ICC2,1) was used to examine the agreement between SmartShoe identified steps and actual steps with the affected lower extremity (ALE) and unaffected lower extremity (UALE) at SSP and FSP. We also used the Bland Altman method to examine agreement between the SmartShoe identified steps and actual steps taken from video analysis as follow: the differences between sensor-determined steps and actual steps taken were plotted against the average measures obtained by the 2 methods. Horizontal lines were drawn at the mean difference, and the limits of agreement (LOA) were defined as the mean difference plus or minus 1.96 times the standard deviation of the difference.
Results
Twelve participants were recruited for the study, six men and six women. The mean time since stroke was 65.2 months. Eight participants had a middle cerebral artery stroke (MCA) (four with right hemiparesis and 4 with left hemiparesis), three with brainstem stroke, and one with a cerebellar stroke. Additional detail regarding participant characteristics of the participants is provided in Table 1. As mentioned above, data from Participants 1,3,4, and 6 were purposefully selected to train the ANN. These four participants had a range of location of stroke (left MCA, right MCA, brainstem, and cerebellar), use of orthotic and assistive devices, walking speed (0.17-1.20), balance ability (BBS: 20-54) and lower extremity motor function (F-M LE: 20-34).
Table 1.
Characteristics of the Participants
| Participant | Age (years) | Gender | Time Since Stroke (months) | AFO | AD | Location of Stroke | SSGS (m/s) | F-M LE | BBS | SIS-16 |
|---|---|---|---|---|---|---|---|---|---|---|
| 1 | 64 | M | 8 | R | No | L MCA | 0.68 | 26 | 47 | 68.7 |
| 2 | 62 | F | 53 | No | No | Brainstem | 0.82 | 30 | 43 | 62.5 |
| 3 | 76 | F | 52 | R | Hemi-walker | Brainstem | 0.17 | 20 | 20 | 59.4 |
| 4 | 68 | M | 55 | L | Cane | R MCA | 0.45 | 21 | 37 | 71.9 |
| 5 | 61 | F | 138 | No | No | L MCA | 1.19 | 23 | 54 | 73.4 |
| 6 | 42 | M | 22 | No | No | L Cerebellar | 1.20 | 34 | 54 | 76.6 |
| 7 | 65 | M | 37 | L | Cane | R MCA | 0.42 | 20 | 32 | 43.7 |
| 8 | 62 | F | 43 | No | No | L MCA | 0.84 | 28 | 54 | 76.5 |
| 9 | 66 | M | 95 | No | No | Brainstem | 1.00 | 34 | 53 | 90.6 |
| 10 | 61 | F | 76 | No | Rolling walker | R MCA | 0.26 | 11 | 24 | 40.6 |
| 11 | 54 | M | 60 | No | No | L MCA | 0.84 | 29 | 52 | 70.3 |
| 12 | 64 | F | 143 | L | Cane | R MCA | 0.75 | 22 | 53 | 76.6 |
| Mean (std) or ratio | 62.1 (8.2) | 6:6 | 65.2 (41.8) | 5:7 (Yes: No) | 5:7 (Yes: No) | 0.72 (0.34) | 24.8 (6.7) | 43.6 (12.4) | 67.5 (14.2) |
Abbreviations: AFO, ankle foot orthotic; AD, assistive device; SSGS, self-selected gait speed; F-M LE, Fugl-Meyer lower extremity motor score; BBS, Berg Balance Scale; SIS-16, Stroke Impact Scale 16; L, left; MCA, middle cerebral artery; R, right; std, standard deviation.
The ANN trained with pressure and sensor data from SmartShoe from participants 1, 3, 4, and 6 was able to accurately identify sitting, standing, and walking in the other participants (2, 5, 7-12). When activity identification results where combined for all eight validation participants the accuracy was 97.2%, recall for different postures ranged from 95.0% to 99.0%, and precision for the different postures ranged from 95.4% to 98.7% (see Table 2). The values in bold along the diagonal of Table 2 are the number of TP epoch identifications, values to the left and right of the bolded diagonal values are FN epoch identifications, and values above and below the bolded diagonal values are FP epoch identifications. The accuracy of the ANN was high for individual participants as well. Accuracy for individual participants ranged from 93.1% to 99.9%.
Table 2.
Cumulative Confusion Matrix for Participants not used to Train the Artificial Neural Network
| Predicted | |||||
|---|---|---|---|---|---|
| Sit | Stand | Walk | Recall | ||
| Sit | 2841 | 30 | 0 | 0.990 | |
| Actual | Stand | 102 | 2620 | 37 | 0.950 |
| Walk | 34 | 32 | 2789 | 0.977 | |
| Precision | 0.954 | 0.977 | 0.987 | 0.972* |
Overall Accuracy
The rows of the table correspond to epochs of actual postures/activities assumed by participants and columns correspond to epochs of predicted postures/activities made by the Artificial Neural Network from the sensor data. The values in bold along the diagonal are the number of True Postive epoch identifications, values to the left and right of the bolded diagonal values are False Negative epoch identifications, and values above and below the bolded diagonal values are False Positive epoch identifications.
There was a high level of agreement between actual steps taken and steps identified by the SmartShoe for both the ALE and UALE at SSP (Figure 2a and 2b) and FSP (Figure 3a and 3b). The Bland Altman plot for SSP revealed a mean difference of 0.80 steps (95% upper LOA 4.47 steps, lower LOA -2.87 steps) with the UALE and 0.04 steps (95% upper LOA 3.55 steps, lower LOA -3.47 steps) with the ALE. The Bland Altman plot for FSP revealed a mean difference of 0.55 steps (95% upper LOA 5.06 steps, lower LOA -3.96 steps) with the UALE and 0.14 steps (95% upper LOA 4.10 steps, lower LOA -3.82 steps) with the ALE. The ICCs2,1 for agreement between actual steps taken and SmartShoe identified steps were 0.99 for all.
Figure 2a.
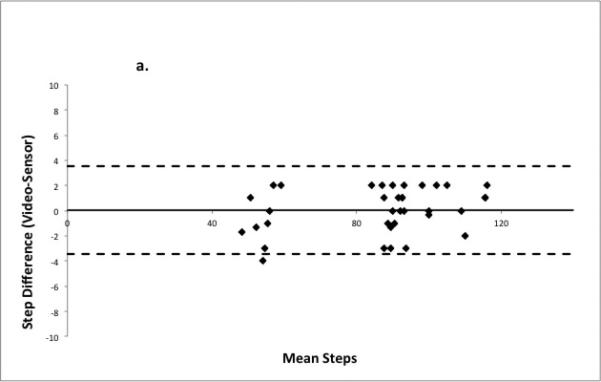
Bland Altman plot demonstrating step count agreement between SmartShoe and actual steps taken as counted from video at self-selected pace for the affected lower extremity. Solid bold line is the mean difference between video counted steps and SmartShoe identified steps, dashed lines are 95% limits of agreement.
Figure 2b.
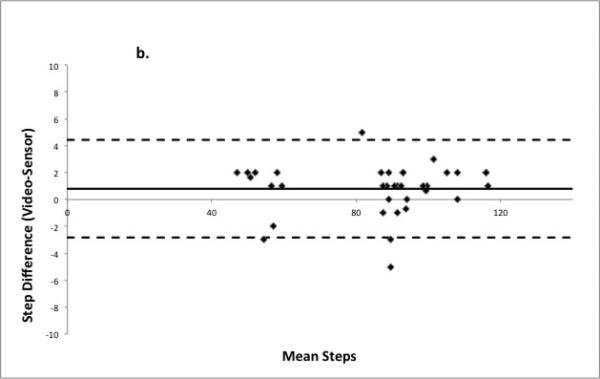
Bland Altman plot demonstrating step count agreement between SmartShoe and actual steps taken as counted from video at self-selected pace for the unaffected lower extremity. Solid bold line is the mean difference between video counted steps and SmartShoe identified steps, dashed lines are 95% limits of agreement.
Figure 3a.
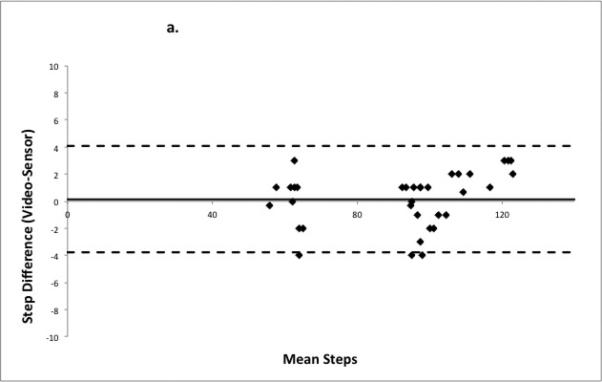
Bland Altman plot demonstrating step count agreement between SmartShoe and actual steps taken as counted from video at fastest safe pace for the affected lower extremity. Solid bold line is the mean difference between video counted steps and SmartShoe identified steps, dashed lines are 95% limits of agreement.
Figure 3b.
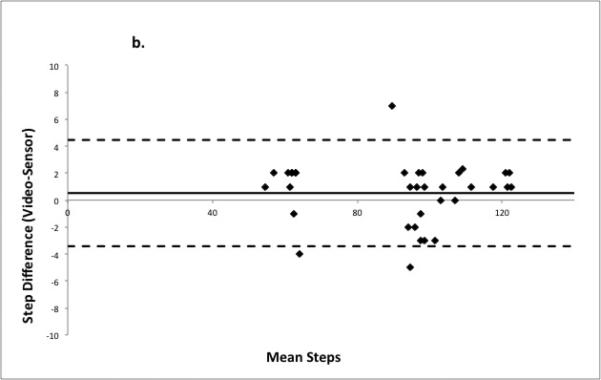
Bland Altman plot demonstrating step count agreement between SmartShoe and actual steps taken as counted from video at fastest safe pace for the unaffected lower extremity. Solid bold line is the mean difference between video counted steps and SmartShoe identified steps, dashed lines are 95% limits of agreement.
DISCUSSION
Our results indicate that the SmartShoe and accompanying ANN were able to accurately identify time spent in sitting, standing, or walking while people with mild to moderate stroke performed common ADLs. When combining the data for all eight subjects in the validation group, overall accuracy, recall and precision were ≥95.0%. These rates are equal to or higher than other researchers have found when using multiple accelerometers in multiple locations in healthy individuals31-33 and people with stroke.34-37
An especially strong finding is that SmartShoe and accompanying ANN was able to accurately identify functional postures in a novel group of participants whose pressure and acceleration data were not used to develop the ANN. The SmartShoe may be able to identify sitting, standing and walking activity in the larger population of people with stroke. This is also true of the algorithm we developed to count steps. It was developed with a different set of participants while they walked a short distance (~ 5.18 meters or ~17 feet).19 The SmartShoe was very accurate in detecting steps both of the ALE and UALE over a longer period of time with a different set of participants. The mean difference in step counts at both SSP and FSP for both lower extremities was less than one.
There are few studies that have examined the validity of sensors to identify both functional postures and steps in people with stroke and other neurological disorders. Recently, Taraldsen et al35 used the ActivPal (PAL Technologies, Ltd) to distinguish between sedentary (sitting and lying) and upright (standing and walking) in older, frail adults. Their sample included a subset of 14 people with stroke. They found that the ActivPal, placed on both LEs and the chest, was able to distinguish between sedentary and upright postures with 100% accuracy. It was also able to identify steps with LOA range of -2.01 to 16.54 steps. Our results indicate that the SmartShoe and our ANN were better at identifying steps and nearly as accurate in identifying functional postures. The slight difference in accuracy may be due to the fact that we distinguished between upright postures (standing and walking) and participants were performing ADLs while in sitting and standing. In the study by Taraldsen and et al35, participants wearing ActivPal transitioned between different postures, but did not perform any ADLs in these postures. People are more likely to perform body movements in sitting and standing while actually performing ADLs as compared to statically holding a posture (i.e. sitting). For example, in our study when participants were standing and folding laundry they often took small steps to the side or shifted weight from one leg to another to reach the pile of laundry. These movements created pressure and acceleration data that may have resembled walking, but would need to be correctly classified as standing by the ANN and not walking.
With recent advances in sensor technology and signal processing there are a growing number of wearable sensors on the market; StepWatch Activity Monitor (Orthocare Innovations, LLC) ActivPal (PAL Technologies, Ltd), Actical (Mini-Mitter Co), and SenseWear (BodyMedia, Inc) are just some of the products on the market. These technologies offer researchers and clinicians the ability to monitor patients’ activities in their home and community environment. However, care should be taken when using these devices. Just as with functional, clinical, performance-based measures (i.e. Berg Balance Scale or gait speed) these technologies only measure what they are designed to measure. For example, the Actical accelerometer measures “activity counts”.38 An activity count is determined by the number of times the accelerometer signal crosses a preset threshold based on movement of the accelerometer.12 This information may or may not be useful to a clinician, researcher, or patient. It may provide an indication of overall activity, but is not likely to provide meaningful information about what the wearer was actually doing during the time the device was worn. When using monitors as a behavioral enhancement tool to self-monitor, set goals, and increase activity levels the monitor should provide easy-to-understand information that is meaningful to the user.39
Users must also be certain that the sensors have been validated with the specific patient population and types of activities the user intends to monitor. To the best of our knowledge most sensors, with the possible exception of the StepWatch Activity Monitor, have not been thoroughly validated with people with neurological disorders. In most instances the validation of these sensors has been done with non-neurologically impaired populations and has been done in closed environments in a design similar to the one employed in this study. There are not any studies that we are aware of in which an activity monitor has been thoroughly validated in the real world where neurologically impaired subjects were not restricted in the types of activities they were performing. Additionally, these sensors use proprietary algorithms to identify time in certain positions or activity counts and most rely on post processing of the data after the wearer takes off the sensor(s). Users, particularly clinicians or patients, may not be able to access and interpret the raw data and cannot receive information on activity levels in real time. Different sensors also have different levels of wearer burden, which may impact the consistency of wearing the device. Some of these monitors require multiple sensors worn on different body parts. We believe that physical therapists should partner with engineers in the early stages of development of body-worn sensors and other rehabilitation technologies so that these technologies more readily useful to physical therapists and their clients instead of trying to adopt existing technologies to the needs physical therapists and their clients.
In this study we improved on the capability of the SmartShoe to measure what people with stroke are doing, however there are still limitations that need to be addressed in future studies. The SmartShoe needs to be validated while people with stroke wear it in an open, free-living environment as they go about doing everyday tasks that are not scripted. To the best of our knowledge this has not been done with any sensor in people with stroke. We also need to expand the types of activities the SmartShoe can recognize to include stairs, transitions, and more specific tasks within sitting and standing. When combined with an accelerometer worn on the wrist as a wristwatch the SmartShoe system was able to accurately identify doing laundry, washing dishes, and vacuuming in single healthy subject (unpublished data). Our sample size was small and most of the participants were mildly to moderately impaired in terms of their motor function, balance and walking ability. The SmartShoe should be validated with a wider spectrum and larger number of people with stroke.
Wearable sensors provide not only the ability to directly measure mobility and activity levels in people with stroke but also the ability to self-monitor activity, receive feedback, and set goals to increase mobility and activity levels to improve health outcomes. This concept has been termed mobile health40 (see Figure 4). The SmartShoe sends data via Bluetooth to a smart phone that can be worn by the user. Although in this study the pressure and sensor data were downloaded from the smart phone to train and validate the ANN to identify activities, currently the ANN can process this data on the smart phone and provide immediate, real-time feedback to the user about activity levels (See Video, Supplemental Digital Content 1, http://links.lww.com/JNPT/A20, which demonstrates the SmartShoe and a smart phone providing real-time feedback on time in sitting standing and walking). The data can also be sent automatically over a secure, wireless internet connection to a server for further processing. This information can then be sent back to the user and rehabilitation professional so it can be viewed over a web-based appliance. The user and physical therapist can receive more detailed information, set activity goals, check on progress towards goals, and discuss barriers that are encountered towards increasing activity. This concept of mobile health has been used successfully in people who are sedentary and obese to increase activity levels and reduce weight.18 Further development and study is necessary to see if this mobile health intervention can be used in people with stroke who are sedentary to increase their activity levels.
Figure 4.
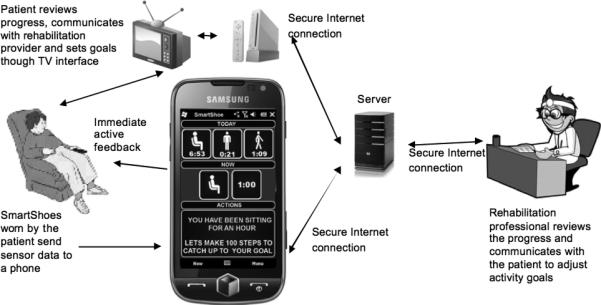
Mobile health concept using the SmartShoe as a method to self-monitor activity levels and receive real time feedback to promote increased activity levels.
Conclusion
Advances in wearable sensor technology and signal processing provide rehabilitation professionals with the ability to determine the impact of interventions on patients’ activity levels and social participation as they go about their everyday lives in their home and community. This technology could also be used to provide behavioral enhancing feedback to increase activity levels. Our findings indicate that the SmartShoe is able to accurately identify when people with stroke are sitting, standing, or walking and how many steps they have taken. The SmartShoe is unobtrusive and does not require a large burden on the part of the wearer. Further research is necessary to determine how well it can detect activity levels in an open, real-world environment.
Supplementary Material
Acknowledgments
Funding: This project was supported by Award Number R15HD061006 from the Eunice Kennedy Shriver National Institute Of Child Health & Human Development.
Footnotes
Conflict of interest: The authors have no conflict of interest related to this work. This work was presented in part at the APTA Combined Sections Meeting in February 2012, World Congress of Physical Therapy meeting in June 2011, and IEEE EMBS Conference in September 2011.
Publisher's Disclaimer: This is a PDF file of an unedited manuscript that has been accepted for publication. As a service to our customers we are providing this early version of the manuscript. The manuscript will undergo copyediting, typesetting, and review of the resulting proof before it is published in its final citable form. Please note that during the production process errors may be discovered which could affect the content, and all legal disclaimers that apply to the journal pertain.
References
- 1.Lloyd-Jones D, Adams RJ, Brown TM, et al. Heart Disease and Stroke Statistics--2010 Update. A Report From the American Heart Association. Circulation. 2010;121:e46–e215. doi: 10.1161/CIRCULATIONAHA.109.192667. [DOI] [PubMed] [Google Scholar]
- 2.Shaughnessy M, Michael KM, Sorkin JD, Macko RF. Steps after stroke: capturing ambulatory recovery. Stroke. 2005;36:1305–1307. doi: 10.1161/01.STR.0000166202.00669.d2. [DOI] [PubMed] [Google Scholar]
- 3.Fulk GD, Reynolds C, Mondal S, Deutsch JE. Predicting Home and Community Walking Activity in People with Stroke. Arch Phys Med Rehabil. 2010;91:1582–1586. doi: 10.1016/j.apmr.2010.07.005. [DOI] [PubMed] [Google Scholar]
- 4.van de Port IG, Kwakkel G, van Wijk I, Lindeman E. Susceptibility to deterioration of mobility long-term after stroke: a prospective cohort study. Stroke. 2006;37:167–171. doi: 10.1161/01.STR.0000195180.69904.f2. [DOI] [PubMed] [Google Scholar]
- 5.Bohannon RA, AW, Smith M. Rehabilitation goals of patients with hemiplegia. Int J Rehabil Res. 1988;11:181–183. [Google Scholar]
- 6.Harris JE, Eng JJ. Goal priorities identified through client-centred measurement in individuals with chronic stroke. Physioth Can. 2004;56(3):171–176. doi: 10.2310/6640.2004.00017. [DOI] [PMC free article] [PubMed] [Google Scholar]
- 7.Potter K, Fulk GD, Salem Y, Sullivan J. Outcome measures in neurological physical therapy practice: part I. Making sound decisions. J Neurol Phys Ther. 2011;35:57–64. doi: 10.1097/NPT.0b013e318219a51a. [DOI] [PubMed] [Google Scholar]
- 8.Andrews K, Stewart J. Stroke recovery: he can but does he? Rheumatol Rehabil. 1979;18:43–48. doi: 10.1093/rheumatology/18.1.43. [DOI] [PubMed] [Google Scholar]
- 9.Bravata DM, Smith-Spangler C, Sundaram V, et al. Using pedometers to increase physical activity and improve health: a systematic review. JAMA. 2007;298:2296–2304. doi: 10.1001/jama.298.19.2296. [DOI] [PubMed] [Google Scholar]
- 10.Fulk G, Sazonov E. Using sensors to measure activity in people with stroke. Top Stroke Rehabil. 2011;18:746–757. doi: 10.1310/tsr1806-746. [DOI] [PMC free article] [PubMed] [Google Scholar]
- 11.Gebruers N, Vanroy C, Truijen S, Engelborghs S, De Deyn PP. Monitoring of physical activity after stroke: a systematic review of accelerometry-based measures. Arch Phys Med Rehabil. 2010;91:288–297. doi: 10.1016/j.apmr.2009.10.025. [DOI] [PubMed] [Google Scholar]
- 12.Chen KY, Bassett DR., Jr The technology of accelerometry-based activity monitors: current and future. Med Sci Sports Exerc. 2005;37:S490–500. doi: 10.1249/01.mss.0000185571.49104.82. [DOI] [PubMed] [Google Scholar]
- 13.Wolf SL, Winstein CJ, Miller JP, et al. Effect of constraint-induced movement therapy on upper extremity function 3 to 9 months after stroke: the EXCITE randomized clinical trial. JAMA. 2006;296:2095–2104. doi: 10.1001/jama.296.17.2095. [DOI] [PubMed] [Google Scholar]
- 14.Duncan PW, Sullivan KJ, Behrman AL, et al. Body-weight-supported treadmill rehabilitation after stroke. N Engl J Med. 2011;364:2026–2036. doi: 10.1056/NEJMoa1010790. [DOI] [PMC free article] [PubMed] [Google Scholar]
- 15.Sazonov ES, Fulk G, Sazonova N, Schuckers S. Automatic Recognition of postures and activities in stroke patients. Conf Proc IEEE Eng Med Biol Soc. 2009;1:2200–2203. doi: 10.1109/IEMBS.2009.5334908. [DOI] [PubMed] [Google Scholar]
- 16.Hamilton MT, Healy GN, Dunstan DW, Zderic TW, Owen N. Too Little Exercise and Too Much Sitting: Inactivity Physiology and the Need for New Recommendations on Sedentary Behavior. Curr Cardiovas Risk Rep. 2008;2:292–298. doi: 10.1007/s12170-008-0054-8. [DOI] [PMC free article] [PubMed] [Google Scholar]
- 17.Barry VW, McClain AC, Shuger S, et al. Using a technology-based intervention to promote weight loss in sedentary overweight or obese adults: a randomized controlled trial study design. Diabetes Metab Syndr Obes. 2011;4:67–77. doi: 10.2147/DMSO.S14526. [DOI] [PMC free article] [PubMed] [Google Scholar]
- 18.Shuger SL, Barry VW, Sui X, et al. Electronic feedback in a diet- and physical activity-based lifestyle intervention for weight loss: a randomized controlled trial. Int J Behav Nutr Phys Act. 2011;8:41. doi: 10.1186/1479-5868-8-41. [DOI] [PMC free article] [PubMed] [Google Scholar]
- 19.Lopez-Meyer P, Fulk G, Sazonov E. Automatic Detection of Temporal Gait Parameters in Post-Stroke Individuals. IEEE Trans Inf Tech Biomed. 2011;15(4):594–601. doi: 10.1109/TITB.2011.2112773. [DOI] [PMC free article] [PubMed] [Google Scholar]
- 20.Cristianini N, Shawe-Taylor J. An Introduction to Support Vector Machines and Other Kernel-based Learning Methods. 1st ed Cambridge University Press; 2000. [Google Scholar]
- 21.Holden MK, Gill KM, Magliozzi MR. Gait assessment for neurologically impaired patients. Standards for outcome assessment. Physical Therapy. 1986;66:1530–1539. doi: 10.1093/ptj/66.10.1530. [DOI] [PubMed] [Google Scholar]
- 22.Holden MK, Gill KM, Magliozzi MR, Nathan J, Piehl-Baker L. Clinical gait assessment in the neurologically impaired. Reliability and meaningfulness. Physical Therapy. 1984;64:35–40. doi: 10.1093/ptj/64.1.35. [DOI] [PubMed] [Google Scholar]
- 23.Folstein MF, Folstein SE, McHugh PR. “Mini-mental state”. A practical method for grading the cognitive state of patients for the clinician. J Psychiatr Res. 1975;12:189–198. doi: 10.1016/0022-3956(75)90026-6. [DOI] [PubMed] [Google Scholar]
- 24.Blum L, Korner-Bitensky N. Usefulness of the Berg Balance Scale in stroke rehabilitation: a systematic review. Phys Ther. 2008;88:559–566. doi: 10.2522/ptj.20070205. [DOI] [PubMed] [Google Scholar]
- 25.Fulk GD, Ludwig M, Dunning K, Golden S, Boyne P, West T. Estimating clinically important change in gait speed in people with stroke undergoing outpatient rehabilitation. J Neurol Phys Ther. 2011;35:82–89. doi: 10.1097/NPT.0b013e318218e2f2. [DOI] [PubMed] [Google Scholar]
- 26.Fulk GD, Echternach JL. Test-retest reliability and minimal detectable change of gait speed in individuals undergoing rehabilitation after stroke. J Neurol Phys Ther. 2008;3:8–13. doi: 10.1097/NPT0b013e31816593c0. [DOI] [PubMed] [Google Scholar]
- 27.Gladstone DJ, Danells CJ, Black SE. The fugl-meyer assessment of motor recovery after stroke: a critical review of its measurement properties. Neurorehabil Neural Repair. 2002;16:232–240. doi: 10.1177/154596802401105171. [DOI] [PubMed] [Google Scholar]
- 28.Fulk GD, Ludwig M, Dunning K, Golden S, Boyne P, West T. How Much Change in the Stroke Impact Scale-16 Is Important to People Who Have Experienced a Stroke? Top Stroke Rehabil. 2010;17:477–483. doi: 10.1310/tsr1706-477. [DOI] [PubMed] [Google Scholar]
- 29.Duncan PW, Wallace D, Lai SM, Johnson D, Embretson S, Laster LJ. The stroke impact scale version 2.0. Evaluation of reliability, validity, and sensitivity to change. Stroke. 1999;30:2131–2140. doi: 10.1161/01.str.30.10.2131. [DOI] [PubMed] [Google Scholar]
- 30.Haykin S. Neural Networks: A Comprehenisve Foundation. 2 ed. Prentice Hall; Upper Saddle River, NJ: 1999. [Google Scholar]
- 31.Aminian K, Robert P, Buchser EE, Rutschmann B, Hayoz D, Depairon M. Physical activity monitoring based on accelerometry: validation and comparison with video observation. Med Biol Eng Comput. 1999;37:304–308. doi: 10.1007/BF02513304. [DOI] [PubMed] [Google Scholar]
- 32.Foerster F, Smeja M, Fahrenberg J. Detection of posture and motion by accelerometry: a validation in ambulatory monitoring. Comput Human Behav. 1999;15:571–583. [Google Scholar]
- 33.Mantyjarvi J, Himberg J, Seppanen T. Recognizing human motion with multiple acceleration sensors. Conf Proc IEEE Int Conf Syst Man Cybern. 2001 [Google Scholar]
- 34.Uswatte G, Miltner WH, Foo B, Varma M, Moran S, Taub E. Objective measurement of functional upper-extremity movement using accelerometer recordings transformed with a threshold filter. Stroke. 2000;31:662–667. doi: 10.1161/01.str.31.3.662. [DOI] [PubMed] [Google Scholar]
- 35.Taraldsen K, Askim T, Sletvold O, et al. Evaluation of a body-worn sensor system to measure physical activity in older people with impaired function. Phys Ther. 2011;91:277–285. doi: 10.2522/ptj.20100159. [DOI] [PubMed] [Google Scholar]
- 36.Saremi K, Marehbian J, Yan X, et al. Reliability and validity of bilateral thigh and foot accelerometry measures of walking in healthy and hemiparetic subjects. Neurorehabil Neural Repair. 2006;20:297–305. doi: 10.1177/1545968306287171. [DOI] [PubMed] [Google Scholar]
- 37.Macko RF, Haeuber E, Shaughnessy M, et al. Microprocessor-based ambulatory activity monitoring in stroke patients. Med Sci Sports Exerc. 2002;34:394–399. doi: 10.1097/00005768-200203000-00002. [DOI] [PubMed] [Google Scholar]
- 38.Rand D, Eng JJ, Tang P-F, Jeng J-S, Hung C. How active are people with stroke?: use of accelerometers to assess physical activity. Stroke. 2009;40:163–168. doi: 10.1161/STROKEAHA.108.523621. [DOI] [PubMed] [Google Scholar]
- 39.Tudor-Locke C, Lutes L. Why Do Pedometers Work? A Reflection upon the Factors Related to Successfully Increasing Physical Activity. Sports Med. 2009;39:981–993. doi: 10.2165/11319600-000000000-00000. [DOI] [PubMed] [Google Scholar]
- 40.Dobkin BH, Dorsch A. The Promise of mHealth: Daily Activity Monitoring and Outcome Assessments by Wearable Sensors. Neurorehabil Neural Repair. 2011;25:788–798. doi: 10.1177/1545968311425908. [DOI] [PMC free article] [PubMed] [Google Scholar]
Associated Data
This section collects any data citations, data availability statements, or supplementary materials included in this article.


