Abstract
Background
The seat selection and classroom dynamics may have mutual influence on the student performance and participation in both assigned and random seating arrangement.
Purpose
The aim of the study was to understand the influence of seat selection on educational achievement.
Methods
The seating positions of the medical students were recorded on an architectural plan during each class session and the means and standard deviations of the students’ locations were calculated in X and Y orientations. The locations of the students in the class were analyzed based on three architectural classifications: interactional zone, distance from the board, and access to the aisles. Final exam scores were used to measure the students’ educational achievement.
Results
Our results demonstrate that there is a statistically significant relationship between the student's locations in the class and their attendance and educational achievements.
Conclusion
Two factors may effect on educational achievement: student seating in the high interactional zone and minimal changes in seating location. Seating in the high interaction zone was directly associated with higher performance and inversely correlated with the percentage of absences. This observation is consistent with the view that students in the front of the classroom are likely more motivated and interact with the lecturer more than their classmates.
Keywords: seating position, educational achievement, class attendance, education, medical student, architecture
Several studies have investigated the association between students’ seating positions and their educational performance (1–6). Architectural spaces include all of the spatial features created within constructions, including light, spatial dimensions, interior design, and circulation. In a classroom, the architectural spaces affect all students. A student's position with respect to these structural properties, such as the entrance, distance from the screen and professor, and accessibility to aisles, may affect the student's educational performance. In addition, educational performance may itself be affected by the student's seating position. The influence of seat selection and classroom dynamics on student performance and participation has been studied previously (1, 7, 8). Using an assigned row-and-column seating arrangement, Marx et al. (9) reported an active rectangular and T-shaped zone in the front of the classroom in which the students asked more questions per lesson. In a similar study (10), Perkin and Wieman demonstrated that seat location in a randomly assigned arrangement had a noticeable effect on the students’ success in the course, whereas other researchers observed no evidence of this effect in small or large classes (11, 12). However, it is still not clear if the majority of students sit in a fixed location (zone) in class and if there is any association between students’ performance and changes in seat location. In addition, there is limited research in medical education regarding this topic. The aims of this study were to determine whether medical students sit in a specific location in class and whether their seating positions influence their academic performance and participation.
Methods
This research is a case study on the Medical Mycology and Parasitology course at the School of Medicine of Shiraz University of Medical Sciences (SUMS). The Medical Mycology and Parasitology course is a sophomore-level course on the pathogenesis and treatment of mycotic and parasitic infections for medical students. The class included 106 medical students who attended two 90-min lectures and one 2-hours laboratory session each week for 25 weeks. The lectures were presented using PowerPoint and included some case studies. To encourage active learning, the students were asked to answer questions and participate in short discussions and dialogues. The students were informed that they may be randomly called on to answer questions. Moreover, the students were free to ask questions during the lectures.
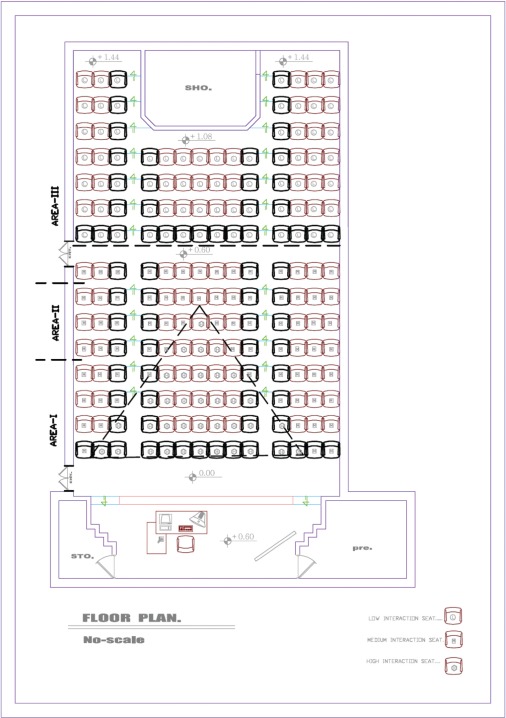
The course was presented in a large-sized lecture hall. As shown in the architectural plan of the hall (Fig. 1), a 5 m wide screen was placed on the stage in the front of the class 10 m from the first row. There were 14 columns and 15 rows of seats arranged on a gentle slope and subdivided by aisles into six areas, as shown in Fig. 1. The hall was large enough for the students to find their preferred seats freely. The position of each seat was coded in two dimensions: X (horizontal axis) and Y (vertical axis). X in each seat corresponded to the position of that seat in a row (or number of the column) and Y in each seat corresponded to the position of that seat in a column (or the number of the row) Y in each seat corresponded to the position of that seat in a column (or the number of the row). As the distance of the seats in a column from each other is about 63.5 cm, the distance of each seat from the lecturer and the board can be estimated by its corresponding Y.
Fig. 1.
The architectural plan of the classroom.
Random sampling was performed and each student's position was recorded using digital photos taken during 15 of the 26 sessions of the course. Following identification of each student in the photos, the positions were coded by superposing (placing) the positions within the architectural plan. The students were told that the photographs were used to check their attendance throughout the course. To determine students’ preferred seating position in medical school courses, students were asked to record their preferred seating position by marking it on an architectural plan of the classroom distributed during the last session.
We analyzed the seating positions in the classroom based on three different viewpoints. First, as described by McCroske and McVetta (7), we divided the classroom into three student-teacher interactional zones: high, medium, and low. As shown in Fig. 1, the students sitting within the triangle in the front of the class next to the teacher had a high interactional level (H). The remaining students sitting in the front half of the classroom had a medium interactional level (M). The students sitting at the back of the classroom had the lowest interaction level (L). Second, since previous studies (1, 2, 5) showed that the distance from the lecturer influenced students’ educational achievement, the classroom was divided in the Y orientation into three areas named I, II, and III. Third, the seats were divided into two groups based on the students’ access to the aisles: direct access (were shown in bold) and indirect access.
The students’ educational achievement was measured using their final exam scores. The exams were composed of multiple choice questions, short essays, and true/false questions. Only the multiple choice questions were used for the both mid-term and final exams and the scores of each of them were calculated out of 20. Reliability of the tests was measured by the split-half and Kuder Richardson methods and indicated respectively a reliability of 0.81 and 0.84 for the final exam. The final exam has been validated by measuring the correlation coefficient between midterm and final exams (r = 0.77, p = 0.01). The students’ presence in the classroom was recorded by digital camera and students were divided into two groups based on the number of absences (having more than 10 absence sessions or not).
The study was approved by the Institutional Review Board and Ethical Committee of Shiraz University of Medical Sciences. All the students willingly signed an informed consent that was attached to the distributed architectural plan of the classroom. In addition, in the last session, the students were informed about the details of the study and gave permission to issue the results.
Statistical analysis
The Pearson correlation was used to test for associations between continuous variables. Moreover, the Mantel-Haenszel chi-square test was used to test for associations between categorical variables in the presence of confounding factors. One-way analysis of variance (ANOVA), the independent sample t-test, and the nonparametric Mann-Whitney U test were applied to test for differences between group. Additionally, the chi-square test was used to test for differences between categorical variables. For the statistical analysis, the level of significance was set at 0.05. SPSS11.0 was used to perform all the statistical analyses.
Results
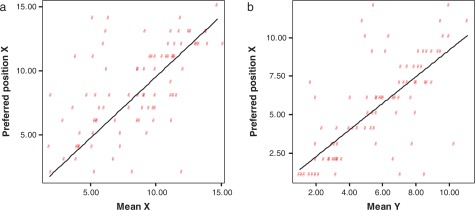
Of 106 students, 58 (54.7%) were female. The students’ mean seating positions were classified in three manners as described in the materials and methods section. Under the interactional zones classification, 27 (25.5%) students had high interactions with the teacher, 60 (56.6%) had medium interactions, and 19 (17.9) had low interactions. Based on the area classification, 39 (36.8%) students sat in area I, 49 (46.2%) sat in area II, and 18 (17%) sat in area III. Under the classification based on student access to the aisles, 48 (45.3%) of the 106 students had direct access and 58 (54.7%) had indirect access to the aisles. In addition, the students’ seat position changes were measured by calculating the standard deviations from their mean positions in the X (SD-X) and Y (SD-Y) orientations. Of the studied students, 56 (54.9%) had an SD-X≤2, 24 (23.5%) had 2<SD-X≤3, and 22 (21.6%) had an SD-X>3. In addition, the majority of the students (71 students, 69.6%) had an SD-Y≤2, 18 (17.7%) had 2<SD-Y≤3, and 13 (12.7%) had an SD-Y>3. There was a significant correlation between SD-X and SD-Y (r=0.31, p=0.001). The students’ preferred positions were determined from the questionnaire, and there was a significant correlation between the students’ seating positions and their preferred positions in both the X (r=0.62, p<0.001) and Y (r=0.72, p<0.001) orientations as shown in Fig. 2a,b.
Fig. 2.
The students’ preferred seating positions and mean seating positions in the X (a) and Y (b) orientations.
The seating distribution of the female and male students in the three classifications is shown in Table 1. Statistically, the proportion of females in areas I and II was significantly higher than the number of males. However, in area III, the proportion of males was significantly higher than the proportion of females (odds ratio=8.3, p<0.01). No statistical significant association was found between aisle seating and the students’ sex. Moreover, independent sample t-tests showed that there were no significant differences in SD-Y and SD-X between males and females. By focusing on the 10% of the students with the highest level of changes in seat position (SD-Y≥5), there were significant differences between the sexes (eight males vs. two females, p=0.041).
Table 1.
Distribution of female and male students in the three seating classifications
| Area | Interactional zone | Access to the corridors | Total | ||||||
|---|---|---|---|---|---|---|---|---|---|
| I | II | III | H | M | L | Direct | Indirect | ||
| N (%) | N (%) | N (%) | N (%) | N (%) | N (%) | N (%) | N (%) | N (%) | |
| Sex | |||||||||
| Female | 26 (66.7) | 29 (59.2) | 3 (16.7) | 17 (63.0) | 38 (63.3) | 3 (15.8) | 27 (56.3) | 31 (53.4) | 58 (54.7) |
| Male | 13 (33.3) | 20 (40.8) | 15 (83.3) | 10 (37.0) | 22 (36.7) | 16 (84.2) | 21 (43.8) | 27 (54.7) | 48 (45.3) |
| Total | 39 (100.0) | 49 (100.0) | 18 (100.0) | 27 (100.0) | 60 (100.0) | 19 (100.0) | 48 (100.0) | 58 (100.0) | 106 (100.0) |
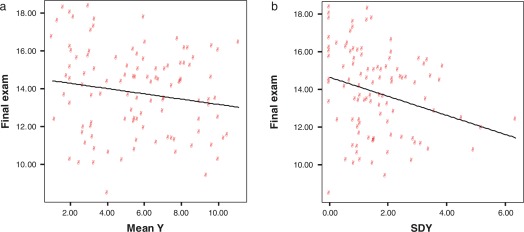
The students’ educational performance was assayed by their final exams scores. Our results showed that there were statistically significant correlations between the final (r=−0.2, p=0.031) exam scores and the students’ seating positions in the Y orientation (Fig. 3a). Of the nine students with final exam grades of A (grades ≥17), six students (66.6%) were seated in the H zone and three were seated in the M zone. None of the A-level students were seated in the L zone. As shown in Fig. 3b, a statistically significant correlation was found between the students’ final exam scores and SD-Y (r=−0.29, p=0.003). Of the students, 97 (90.7%) had a SD-Y≤4, and interestingly all nine students with final exam grades of A (scores≥17) had a SD-Y≤2. Moreover, the students with a SD-Y≥5 had average final exam scores of 12.2±0.9, while the other students had average final exam scores of 13.9±2.2. This difference was statistically significant (p=0.001). Using t-test, no significant difference was observed between the male and female students’ grades.
Fig. 3.
Distribution of the students based on their final exam scores and either their mean seating positions (a) or the standard deviations of their seating positions (b) in the Y orientation.
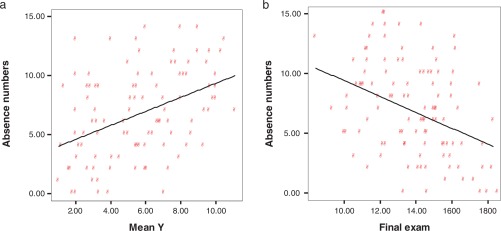
As shown in Fig. 4a, there was a significant positive correlation between the number of absences and the distance from the board (r=0.41, p<0.001). In other words, the number of absences increased with increasing distance from the board. There were significant negative associations between the number of absences and the students’ final exam scores (r=−0.36, p<0.001) as shown in Fig. 4b. Although there was no significant correlation between the number of absences and sex, when we divided the students into two groups based on the number of absences, there were significant differences between the sexes (p<0.01). Of the 21 (20.4%) students who were absent from more than 10 class sessions, 16 (76.2%) were male and 5 (23.8%) were female.
Fig. 4.
Distribution of the students based on their number of absences and either their mean seating positions in the Y orientation (a) or their final exam scores (b).
Discussion
Traditional classrooms are the most common type of educational setting in universities, especially for medical students (13). In this study, we examined the mutual interactions among the chosen seating of medical students, exam scores, and the students’ attendance. We observed that only five (4.6%) of the students sat in the same seat, all of whom, interestingly, had no movement in the Y orientation during the semester. We compared the students’ educational achievements and attendance based on three types of spatial classification: distance from the lecturer in the Y orientation, interactional zones, and access to the aisles. The majority of the students (n=88, 82.2%) chose seats in specific areas. The remaining students changed their positions frequently in both the X and Y orientations (SD-X>3, SD-Y>3). Previous studies distributed the students in the classroom by assigning their positions randomly or by assigning the students their favorite seating positions. In our study, students had the opportunity to choose their seat since the number of seats was nearly double the number of students. Moreover, the students’ actual seating positions and their preferred seats were correlated, indicating that the association between seating position and educational performance was not a random event as the students intentionally chose the places where they sat. A previous report by Cinar (13) showed that the distance to the stage is negatively associated with feeling secure in large spaces. In the present study, the number of males in area III was five times greater than the number of females. Several authors (1, 2, 4, 5) have shown that there is an association between better academic performance and the option of sitting close to the board, while other researchers did not observe this correlation even when the students sat a considerable distance away from the board in very large classrooms (11, 12). Although the data presented in this report demonstrated no significant correlation between the students’ exam performance and their seating in different areas (I, II and III) of the classroom, a significant association was found between the students’ performance and seating positions in the high and medium interactional zones. The differences between the results of this study on student performance in different interactional zones or area classifications and previous reports (1, 2, 4, 5) may be due to differences in the types and sizes of the classrooms. In the present study, the comparison of area I with zone I showed that those students seated in the corners of the area I did not have a high level of interaction with the lecturer despite their close proximity to the stage. Moreover, of all the A-level students, almost two thirds were seated in the H zone, and the rest were in the M zone, which suggests that eye-contact and interaction with the lecturer contributed to better performance. These data supported the previous hypotheses (10, 13, 14) that proximity to the lecturer enhances student motivation and improves their scholastic performance. Another possible explanation for these results was provided by a recent study, which noted the possible relationship between seat location and test scores was mainly due to the motivation of the students who sat in the front of the class rather than their seat position (11). In large classrooms with assigned seating, the researchers observed no effect or a negative correlation between the seat location and exam scores. Meanwhile, when the students were free to choose their seats, those in the front received higher grades than those in the back, suggesting that more motivated and engaged students chose seat nearer to the lecturer (11). On the other hand, we observed a negative significant association between student performance and changes in seat location, with A-level students rarely changing their seating locations (SD-Y≤2). Likewise, the students who changed their seating locations frequently received significantly lower grades than the rest of the class. Evidence suggests that these students chose their seats by chance and not preference. However, another variable like motivation may exist that affects both seat location and educational performance. These students might have lower motivation than the fixed seat students, which may in turn affect their educational performance. Tardiness might also contribute to these findings. Typically in classes, those who are frequently late also perform less well than those who arrive on time. Tardy students also have to take whatever empty seats are left and easy to get to, rather than the seats they would prefer if they had more choice.
The front seats were usually occupied by students with high attendance. Our results demonstrate that the students’ number of absences increased with increasing distance from the board. As in previous studies (4, 10, 15) the number of absences was negatively associated with the students’ final exam scores. Although no significant correlation was found between the number of absences and sex, when we divided the students into two groups based on the number of absences, we observed there were significantly more males in the group of students that was absent from more than 10 sessions. On the other hand, the low number of students attending the educational classes might be natural consequence of modern educational techniques used. In some medical schools such as ours, all the lectures are presently recorded, typed and accessible for all students and these together with the online atlases and slides, has resulted in the students feeling no necessity to attend the class physically. By monitoring the students’ participation through taking unannounced quizzes, we are making an attempt to obligate the students to participate in the class.
Previously, Furnham et al. (16) reported that there was a relationship between educational achievement in sophomore students and sex. We observed no significant correlation between educational achievement and sex. Our results were similar to a previous report (17). We conclude that two factors may impact educational achievement: student seating in the high interactional zone and minimal changes in seating location. Our results showed that the students in the high interactional zone had higher educational performance and attendance than the rest of the class. This observation is consistent with the view that students in the front of the classroom are likely more motivated and interact with the lecturer more than their classmates.
These results suggest that engaging students at the back of the class (area III) or persuading them to sit closer might positively influence their academic performance and participation. However, further studies in large size lecture halls is still needed to verify if assigning poorer performing students and those who change their seat frequently to the seats, would improve their performances and participation.
Acknowledgements
We gratefully acknowledge the medical students of alumina 86 for their participation in this research. We thank all the professors of the Medical Mycology and Parasitology Department at Shiraz University of Medical Sciences for supporting this research. The authors would also like to Dr. Shorkpour and Dr. Ingrid A. Lobo for reviewing and editing of the manuscript.
Conflict of interest and funding
The authors have not received any funding or benefits from industry or elsewhere to conduct this study.
References
- 1.Benedict ME, Hoag J. Seating location in large lectures: are seating preferences or location related to course performance? J Econ Educ. 2004;35:215–31. [Google Scholar]
- 2.Pedersen DM. Personality and classroom seating. Percept Motor Skill. 1994;33:1355–60. [Google Scholar]
- 3.Shivani S, Mukherjee SK, Sharan R. Socio-cultural influences on Indian entrepreneurs: the need for appropriate structural interventions. J Asian Econ. 2006;17:5–13. [Google Scholar]
- 4.Tagliacollo VA, Volpato GL, Pereira Junior A. Association of student position in classroom and school performance. Educ Res. 2010;1:198–201. [Google Scholar]
- 5.Totusek P, Staton-Spicer A. Classroom seating preference as a function of student personality. J Exp Educ. 1982;505:159–63. [Google Scholar]
- 6.Weinstein CS. Seating arrangements in the classroom. In: Huseun T, Postlethwaite TN, editors. International encyclopedia of education. New York, NY: Pergamon; 1985. pp. 103–45. [Google Scholar]
- 7.McCroske JC, McVetta RW. Classroom seating arrangements: Instructional communication theory versus student preferences. Commun Educ. 1978;27:99–111. [Google Scholar]
- 8.Grump P. School and classroom environments. In: Stokols D, Altman I, editors. Handbook of environmental psychology. New York, NY: Wiley; 1987. pp. 698–701. [Google Scholar]
- 9.Marx A, Fuhrer U, Hartig T. Effect of classroom seating arrangements on children's question-asking. Learn Environ Res. 2000;2:249–63. [Google Scholar]
- 10.Perkins KK, Wieman C. The surprising impact of seat location on student performance. The Physic Teach. 2005;43:30–3. [Google Scholar]
- 11.Armstrong N, Chang S. Location- dose seat location affect performance in large class. J Coll Sci Teach. 2007;37:54–8. [Google Scholar]
- 12.Kalinowski S, Taper ML. The effect of seat location on exam grades and student perceptions in an introductory biology class. J Coll Sci Teach. 2007;36:54–7. [Google Scholar]
- 13.Cinar A. Classroom geography: who sit where in the traditional classroom? J Int Sco Res. 2010;3:200–12. [Google Scholar]
- 14.Adams RS, Biddle BJ. New York, NY: Holt, Rinehart & Winston; 1970. Realities of teaching: explorations with the video tape; p. 110. [Google Scholar]
- 15.Chamorro-Premuzic T, Furnham A. Personality predicts academic performance: evidence from two longitudinal university sample. J Res Pers. 2003;3:319–38. [Google Scholar]
- 16.Furnham A, Chamorro-Premuzic T, McDougall F. Personality, cognitive ability and beliefs about intelligence as predictors of academic performance. Learn Individ Differ. 2003;14:49–66. [Google Scholar]
- 17.Furnham A, Chamorro-Premuzic T. Personality and intelligence as predictors of statistics examination grades. Pers Indiv Differ. 2004;37:943–55. [Google Scholar]


