Abstract
Thyroid hormones have a profound influence on human development and disease. The hypothalamic-pituitary-thyroid axis involves finely tuned feedback mechanisms to maintain thyroid hormone (TH) levels. Despite the important role of TH-negative feedback in regulating this axis, the mechanism by which this occurs is not clearly defined. Previous in vivo studies suggest separate roles for the two thyroid hormone receptor isoforms, THRA and THRB, in this axis. We performed studies using a unique pituitary thyrotroph cell line (TαT1.1) to determine the relative roles of THRA and THRB in the regulation of Tshb. Using chromatin immunoprecipitation assays, we found that THRB, not THRA, bound to the Tshb promoter. By selectively depleting THRB, THRA, or both THRA and THRB in TαT1.1 cells, we found that simultaneous knockdown of both THRB and THRA abolished T3-mediated down-regulation of Tshb at concentrations as high as 100 nm T3. In contrast, THRA knockdown alone had no effect on T3-negative regulation, whereas THRB knockdown alone abolished T3-mediated down-regulation of Tshb mRNA levels at 10 nm but not 100 nm T3 concentrations. Interestingly, chromatin immunoprecipitation assays showed that THRA becomes enriched on the Tshb promoter after knockdown of THRB. Thus, a likely mechanism for the differential effects of THR isoforms on Tshb may be based on their differential DNA-binding affinity to the promoter.
The thyroid hormones, T3 and T4, profoundly influence human development and metabolic regulation. Thyroid hormone (TH) production is regulated by a feedback system involving TSH secreted by the pituitary thyrotrophs and TRH secreted by discrete nuclei in the hypothalamus. In this hypothalamic-pituitary-thyroid (HPT) axis, TSH occupies a central position. TSH production is stimulated by TRH acting through TRH receptors. TSH production is reduced by TH acting through thyroid hormone receptors. Negative feedback of the HPT axis occurs primarily through the action of TH at the level of both the pituitary and the hypothalamus (1–5), but Tshb and Trh are not the only negatively regulated genes in the axis. The TRH receptor (TRHR) is also repressed by TH and helps control the HPT axis. TH reduces TRHR density in vivo and in normal pituitary cells in culture (6–8).
TH action is mediated by thyroid hormone receptors (THR). There are several different THR isoforms encoded by two separate genes: Thra and Thrb. The receptor isoforms THRα1, THRβ1, and THRβ2 (THRA1, THRΒ1, and THRB2) are considered to be relevant for the TH regulation of TSH (9, 10). The Thra gene also generates another isoform, THRA2, which does not bind T3 and whose function is unclear; there are indications that this isoform can act as an antagonist of the other THR (11, 12). THR isoforms are differentially expressed in a tissue-specific manner. Thra1 and Thra2 are widely expressed. In contrast, Thrb1 appears in several cell types but is most highly expressed in liver, whereas Thrb2 expression is present mostly in pituitary, hypothalamic TRH neurons, the developing inner ear, and the retina (13–15).
The relative roles of THR isoforms have been investigated using several animal models. Both Thrb1 and Thrb2 knockout mice displayed features of resistance to thyroid hormone, with reduced suppression of serum thyrotropin and Tshb mRNA levels by thyroid hormone (16–19). Mice deficient in all Thra isoforms (Thra1, Thra2, and the truncated transcripts) have levels of TSH similar to the wild-type mouse but with significantly lower levels of T4 (20). Interestingly, in animals with the deletion of both Thrb and Thra, the circulating levels of TSH are significantly higher than the levels in animals with the deletion of Thrb only (21, 22). From studies in which a mutation known to cause resistance to thyroid hormone was introduced into THRA1 or THRB1 (Thra1PV and Thrb1PV), only the Thrb1PV mutant recapitulated the resistance to thyroid hormone phenotype. The Thra1PV mouse displayed dwarfism (23). Thus, based on mouse models, it appears that although THRB has a predominant role in the regulation of Tshb, THRA also contributes to the regulation of Tshb.
TRH is the major positive regulator of thyrotropin-β production and as such is a potential site for regulation of the HPT axis. Indeed, negative regulation of the HPT axis occurs at the level of the paraventricular nucleus of the hypothalamus in which TH is a negative regulator of TRH production (24, 25). In addition to TH, reduced nutritional status down-regulates TRH through leptin-modulated signaling pathways and possibly through the effects of fasting on type 2 deiodinase expression. The role of TH and its receptors in modulating the activation of Tshb expression by TRH remains to be further elucidated.
Despite the above-described advances suggesting a critical and differential role for THR, a molecular mechanism for the down-regulation of gene expression by T3 has not been established. Studies suggest that THR must be bound to DNA for T3-mediated down-regulation of gene expression to occur (26, 27). Negative thyroid hormone response elements (TRE) have been proposed and described in heterologous cell systems for genes such as Tshb and Trhr (28–32). Furthermore, both in vitro and in vivo studies with a THRB DNA-binding mutant suggest that THR binding to DNA is critical for normal T3-negative feedback on the HPT axis (26, 27). However, a model describing what happens after binding of T3 to THR is lacking.
We hypothesized that differences in THR isoform binding to the proximal promoter region of Tshb may explain the apparently nonredundant roles for THRA and THRB in the regulation of Tshb. To test this hypothesis, we used the TαT1.1 cell line, a subclone of the unique TαT1 mouse thyrotoph cell line developed by Mellon and colleagues (33) in which the physiological regulation of Tshb is maintained. TH reduced Tshb and Trhr1 mRNA levels but had no effect on common glycoprotein α-subunit (Cga) mRNA levels. TRH increased Tshb mRNA, which is an effect reduced by TH. Thus, this cell system provides a useful, physiologically relevant tool to more precisely define the mechanism of T3 mediated gene down-regulation. Our studies suggest that under nonmanipulated conditions, only THRB isoforms bind to the proximal region of Tshb but that THRA can partially compensate in cases when THRB is knocked down, by binding to the Tshb promoter.
Materials and Methods
Cell culture and hormone treatments
TαT1.1 cells were plated in DMEM (Cellgro; Mediatech Inc., Manassas, VA) containing 10% fetal bovine serum (Invitrogen Corp., Carlsbad, CA), 4.5 mg/ml glucose, 110 mg/liter pyruvate, 584.0 mg/liter l-glutamine, 100 U/ml penicillin, and 0.1 mg/ml streptomycin (Invitrogen). Before the cells were seeded, the plates were coated with Matrigel (BD Biosciences, Bedford, MA), to facilitate adhesion. Matrigel was diluted 30-fold with Dulbecco's PBS (Invitrogen) before coating the plates. Cells were maintained at 37 C in an environment of 5% CO2. Treatment of cells with either 10 nm T3 or 100 nm TRH (Sigma, St. Louis, MO) was performed for the indicated duration and the time after media replacement with DMEM containing 10% fetal bovine serum stripped of thyroid hormone by treatment with AG1X-8 resin (Bio-Rad Laboratories, Inc., Hercules, CA) and charcoal (Sigma).
RNA analysis
Total RNA from TαT1.1 cells was extracted by standard methodology (TRIzol reagent; Invitrogen). One microgram of total RNA was reverse transcribed using the iScript cDNA synthesis kit (Bio-Rad Laboratories). Real-time PCR analyses were performed in a fluorescent temperature cycler (MyiQ single color real time PCR detection system; Bio-Rad Laboratories) according to the recommendations of the manufacturer. Reaction protocol was described before (34). Primers for Tshb, 36b4, Cga, Thrb, Thrb1, Thrb2, Thra1, Thra2, and Trhr1 are listed in Supplemental Table 1, published on The Endocrine Society's Journals Online web site at http://mend.endojournals.org. All primer sets were verified to provide a PCR efficiency between 90 and 110% and a single peak on melt curve analysis. Relative mRNA levels were determined using the 2-ΔΔCt method (35). Cycle threshold values for 36B4 were used to normalize each sample. Samples were measured in duplicates, and each experiment was repeated at least three times. All results are expressed as a fraction of samples treated with vehicle only.
Chromatin immunoprecipitation (ChIP) assays
ChIP assays were performed on TαT1.1 cells at approximately 90% of confluence using ChIP-IT Express kit (Active Motif, Carlsbad, CA) following the manufacturer's protocol. Antibodies used included nonspecific rabbit IgG (Santa Cruz Biotechnologies, Santa Cruz, CA), anti-THRΒ1 (Upstate Biotechnology, Lake Placid, NY), anti-TΗRA1 (Rockland, Gilbertsville, PA), and anti-THRB2 (rabbit polyclonal, developed in-house; please see Supplemental Data for details). Immunoprecipitation was performed at 4 C overnight. The DNA recovered from the assay was subjected to PCR using specific primers designed to detect enrichment in the proximal promoters and the 3-kb 5′-flanking region of Tshb, Cga (Supplemental Data). Primers were designed to amplify PCR products of 500 bp, with an overlap of around 100 bp. To determine the relative enrichment of THRA vs. THRB1 and THRB2, a ChIP scanning approach was used. Briefly, DNA isolated after the ChIP assay was subjected to quantitative PCR (qPCR) using primer sets that covered a region approximately 5 kb proximal and 5 kb distal to the established transcriptional start site (TSS). The amplicons were approximately 90–160 bp in size and separated by approximately 500-1000 bp (primer sequences available on request). Enrichment of respective isoforms was calculated as percentage of input using the 2-ΔCt method [where ΔCt = Ct(IP) − Ct(input)].
Adenoviral transduction
Adenoviruses expressing nonspecific scrambled short hairpin RNA (shRNA) or shRNA against Thrb common mRNA (that is, designed to knock down both THRB isoforms), Thra common mRNA and Thra1-specific mRNA (sequences available on request) were generated using a BLOCK-iT adenoviral RNAi expression system following the manufacturer's protocol (Invitrogen). TαT1.1 cells were transduced 24 h after the cells were seeded with various adenoviruses to knock down the gene(s) of interest. The medium was changed on the following day and cells were treated with 10 nm T3. The concentration of adenoviruses was determined and all solutions had equivalent titering. The control scramble adenovirus was used in the same concentration as the virus of interest.
Statistical analysis
Data were reported as means ± sem. ANOVA followed by Bonferroni multiple comparisons posttest was used for assessment of significance when comparisons were made within different hormone and/or shRNA treatments (GraphPad Prism, version 5.03; GraphPad Software, La Jolla, CA). In ChIP-qPCR experiments, one-way ANOVA was used to assess whether enrichment of a receptor isoform, as measured by percentage input, at a particular location was significantly different from the enrichment at other locations. All locations found not be statistically different from each other were then assumed to be background and averaged. ChIP qPCR data were then expressed as fold enrichment relative to this background. Post hoc analysis was performed as noted above. Differences were considered to be significant at P < 0.05.
Results
Thyrotropin subunit mRNA levels were differentially regulated by T3 in TαT1.1 cell line
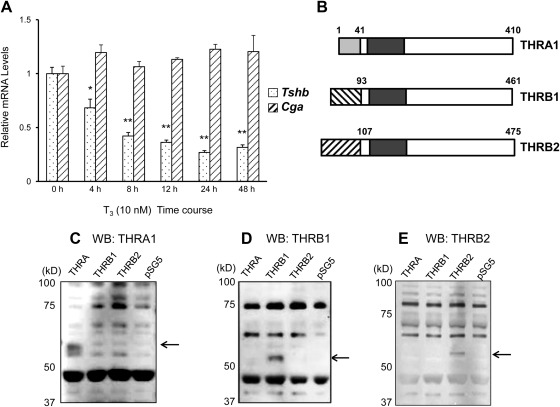
Using the TαT1 cells, workers have previously shown that Tshb but not the Cga subunit gene expression was negatively regulated by T3 in a concentration- and time-dependent manner (33). We began these studies using the TαT1 cell line but noted heterogeneity in the T3 response. To achieve maximal regulation by T3 and TRH, subclones were derived from TαT1 cells by limited dilution cloning. We sought to determine whether the TαT1 subclones were similarly regulated by T3. Cell cultures were treated with medium containing 10% resin-charcoal-stripped serum supplemented with 10 nm T3 for 0, 4, 8, 12, 24, and 48 h (Fig. 1A). One subclone showed the best response (TαT1.1), and real-time PCR analysis (RT-qPCR) demonstrated that T3 reduced Tshb mRNA levels starting at 4 h (relative to vehicle treated cells) and with maximum effect at 24 h; T3 treatment had no effect on Cga mRNA levels. These data confirmed and extended previous findings (33, 36–38) and also indicated that thyrotropin subunit gene expression is differentially regulated in this cell line.
Fig. 1.
Time-course effect of T3 on Tshb and Cga mRNA levels in TαT1.1 cells. A, Cells were treated with stripped serum medium without or with 10 nm T3 for 4, 8, 12, 24, and 48 h. After treatment, total RNA was extracted, and the samples were subjected to RT-qPCR analysis using primers to amplify Tshb mRNAs (dotted columns) or Cga mRNAs (shaded columns). Data were normalized to vehicle-treated samples. Data are shown in means ± sem of at least three separate experiments each performed in triplicate. *, P < 0.01; **, P < 0.001. B, Diagram of isoforms THRA1, THRB1, and THRB2. Immunoblot demonstrating specificity of antibodies to THRA1 (C), THRB1 (D), and THRB2 (E) is shown. cDNA for THRA, THRB1, and THRB2 were cloned into pSG5 vector and expressed using in vitro transcription translation kits. Lysates were subjected to SDS-PAGE and a Western blot was performed as described.
THR bound to a defined area of Tshb promoter
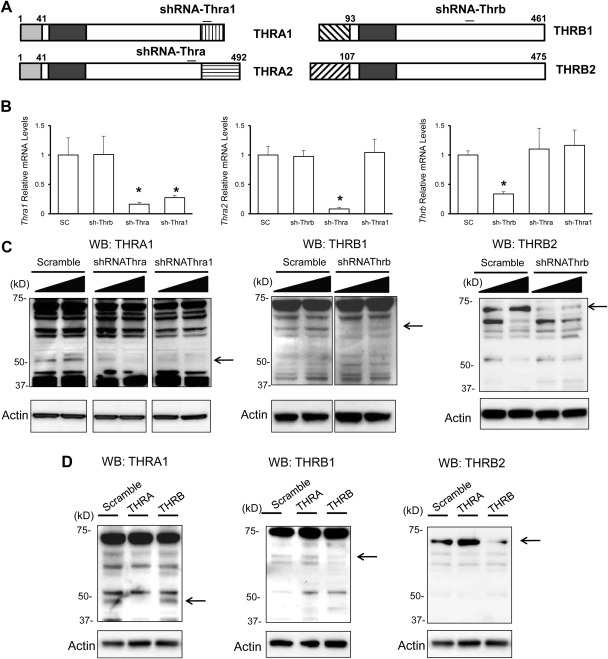
Prior work from our group demonstrated the importance of THR DNA binding for T3-induced negative regulation of the Tshb subunit gene both in vitro and in vivo (26, 27). However, the location of THR binding remains unclear, with descriptions of possible negative TRE in the promoter region of Tshb only in heterologous cells systems (31, 32). To determine whether THR could be enriched around the Tshb TSS, we performed a ChIP assay of TαT1.1 cells. First, we validated that the antibodies to THRA1, THRB1, and THRB2 (diagrammed in Fig. 1B) could detect the respective isoforms specifically by probing the products of in vitro transcription translation systems with the respective antibodies after SDS-PAGE (Fig. 1, C–E). Furthermore, we determined that Thra, Thrb1, and Thrb2 are all detectable in TαT1.1 cells by RT-qPCR (data not shown) and found detectable protein levels of THRA, THRB1, and THRB2 by immunoblot as well (discussed in detail below, see Fig. 4).
Fig. 4.
Effect of Thra common shRNA, Thra1 shRNA, and Thrb shRNA on specific mRNA and protein levels in TαT1.1 cells. TαT1.1 cells were infected with virus expressing a scrambled shRNA (control) or a virus expressing specific shRNA. The cells were lysed 72 h later and subjected to RNA or protein extraction. A, Schematic of the target location of respective shRNA. B, RNA analysis for the silencing activity of the shRNA. The three graphs from left to right are Thra1, Thra2, and Thrb mRNA levels, all relative to scrambled shRNA-treated cells. Data are expressed as mean ± sem. There was a significant reduction in mRNA expression of the gene for each one of the respective shRNA. *, P < 0.05. C, Western blot analysis of THR and ACTIN (control) protein levels was performed. Left panel, Antibody against THRA was used to analyze samples treated with Thra or Thra1 shRNA. Right panel, Antibody against THRB1 or THRB2 was used to analyze samples treated with Thrb shRNA. D, shRNA against THRA may increase amount of THRB protein Western blot analysis of THRA (left panel), THRB1 (middle panel), and THRB2 (right panel) with actin control below each blot. In each representative immunoblot, the effect of shRNA against THRA or THRB on protein levels is shown with amount of protein in cells treated with scramble shRNA (left column of each blot) shown for control.
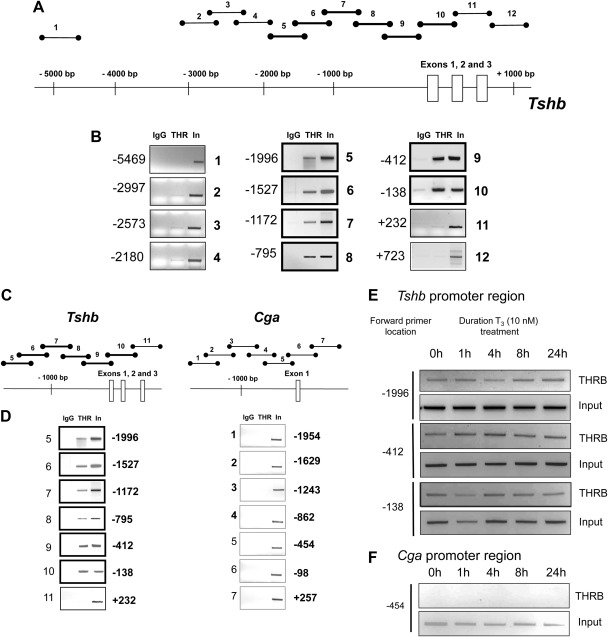
Next, using the PCR primers described above, we scanned the region denoted in Fig. 2A for enrichment by THR by performing ChIP assays using both THRA and THRB1 antibodies together. This approach identified a defined area of THR enrichment spanning the proximal promoter and first two exons of the Tshb gene (Fig. 2B). We also performed this ChIP-PCR assay with THRB1 and THRA antibodies separately and did not find appreciable enrichment of THRA in this region of Tshb (data not shown) and investigated this further in experiments detailed in Fig. 3.
Fig. 2.
THR binding pattern to the promoter region of Tshb gene. A, This diagram represents the location of PCR amplicons used to identify areas of THR binding in the Tshb gene. The thicker lines symbolize samples positive for THR enrichment based on PCR. B, ChIP assays were performed in TαT1.1 cells. Cell lysates were immunoprecipitated with IgG (control) or a pool of THR antibodies. Eluted DNA was subjected to PCR using primer sets diagrammed in A, and samples were subjected to agarose gel electrophoresis to determine whether this region of DNA was enriched by the particular antibody. Samples were loaded in the following sequence: IgG (negative control), THR, and input. To the left of each gel picture is the location of the forward primer used. THR binding to Tshb and Cga promoter region is different. Similar to Fig. 2, ChIP assay samples were analyzed by PCR to amplify fragments of the corresponding region of Cga promoter. C, Diagram of PCR strategy. D, Agarose gels displaying THR binding to the Tshb (first column) and Cga promoter regions (second column). Forward primer locations are labeled to the left of each gel. The agarose gels are representative examples of PCR products performed in at least three separate experiments. T3 treatment does not substantially alter THR enrichment in promoter regions of Tshb and Cga. ChIP assay was performed on TαT1.1 cells after treatment with 10 nm T3 for the indicated times. E, Cell lysates were immunoprecipitated antibody against THRB Tshb promoter region. The agarose gels are representative examples of PCR products using primer sets for the locations indicated. F, Cga promoter region. The agarose gels are representative examples of PCR products using primer set 5 from Fig. 3. The experiments were repeated at least three times.
Fig. 3.
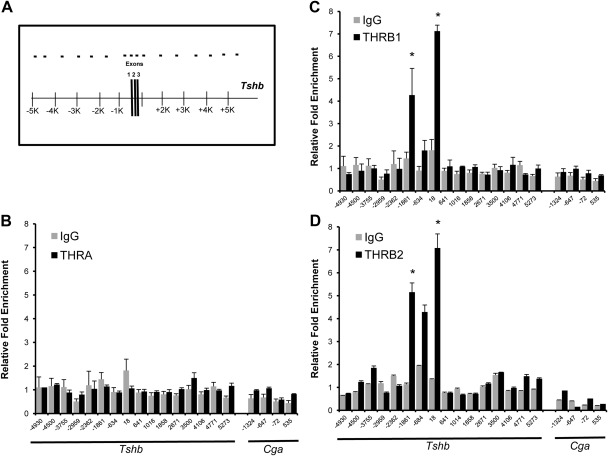
Enrichment of THRA, THRB1, and THRB2 in a region approximately 10 kb surrounding the Tshb TSS. ChIP assays were performed with antibodies specific for THRA, THRB1, THRB2, or IgG (as a negative control). Eluted DNA and input DNA was subjected to qPCR to better quantify differences between the different antibodies. Primer sets were designed to scan a region of approximately 10 kb surrounding the Tshb TSS. Results are expressed relative fold enrichment ± sem compared with background enrichment (details in Materials and Methods). Schematic (A) demonstrating qPCR strategy of THRA (dark bars) and IgG (gray bars) (B) or THRB1 (dark bars) and IgG (gray bars) (C) is shown. D, THRB2 (dark bars) and preimmune serum (gray bars) are shown. On the x-axis is the location of forward primer relative to Tshb TSS. *, P < 0.05 for enrichment compared with other regions of PCR.
THR bound to Tshb but not to the Cga promoter
Next we used a strategy similar to that described above to determine whether THR are bound to the Cga gene in a region similar to that of the Tshb promoter region. We found no evidence of THR enrichment on the Cga promoter region. (Fig. 2, C and D). These results are consistent with those in Fig. 1 demonstrating that Tshb but not Cga mRNA levels were negatively regulated by T3 in TαT1.1 cells.
T3 did not affect THR recruitment to the TSHβ gene promoter
Whether T3 induces recruitment of THR to genes that are negatively regulated by T3 and THR is controversial. In heterologous GH3 cells that do not express thyrotropin subunit genes, others have suggested that T3 caused THR recruitment and histone deacetylation (33). To study the time-dependent THRB1 recruitment in this thyrotroph cell line, ChIP assays were performed on cells harvested at 0, 1, 4, 8, and 24 h after the addition of T3. As shown in Fig. 2E, T3 treatment of TαT1.1 cells did not substantially affect THRB1 enrichment on Tshb. We did not see substantial THRA binding (data not shown), and THRB1 did not bind to the Cga promoter region (Fig. 2F) at the time points studied. Taken together, the above findings suggest that THRB1 but not THRA is enriched near the TSS of Tshb in unperturbed conditions, despite the fact that we are able to detect both THRB1 and THRA by Western blot in these cells. Furthermore, T3 does not affect the binding of THRB1 to Tshb proximal to the TSS.
In TαT1.1 cells, THRB1, but not THRA, is bound to the proximal promoter
Finally, we performed a ChIP-scanning strategy (Fig. 3A) followed by qPCR to quantitatively determine the relative THR isoform (THRA, THRB1, and THRB2) binding patterns. We found that only THRB1 and THRB2 are significantly enriched in two of the interrogated regions, at approximately −1861 and +18 relative to the TSS (Fig. 3, C and D). We did not detect any enrichment of THRA above the background (Fig. 3B).
Knockdown of THRB results in THRA enrichment to areas previously enriched by THRB
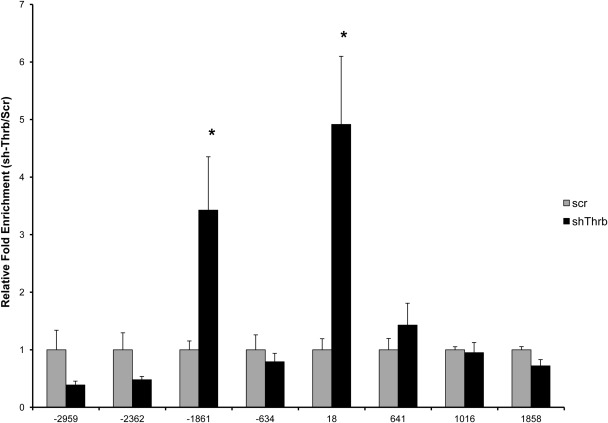
Next, we performed adenoviral delivery of shRNA designed to reduce protein levels of all Thra isoforms (Thra common), Thra1 only, and all Thrb isoforms (Thrb common) in TαT1.1 cells (approximate location of target shRNA is diagrammed in Fig. 4A). Specific knockdown of Thra1, Thra2, and Thrb using Thra common, Thra1, and Thrb common shRNA were confirmed using both mRNA and protein levels (Fig. 4, B and C). Knockdown of Thrb did not appear to affect protein levels of THRA. However, there appears to be a slight increase in THRB protein levels after Thra knockdown. (Fig. 4D). Next, we performed ChIP-qPCR to determine whether specific isoform knockdown could affect the enrichment of the other isoforms. Surprisingly, we found that THRA enrichment increased after knockdown of THRB at the previously described locations of enrichment (Fig. 5). Knockdown of Thra does not appear to substantially affect THRB enrichment (Supplemental Fig. 1). This also indicates that THRA enrichment could be detected in this system because we do not have another positive control for THR enrichment in this cell system.
Fig. 5.
Knockdown of THRB results in dramatically increased enrichment of THRA in regions previously enriched with THRB. ChIP-qPCR was performed to scan a region around the Tshb in TαT1.1 cells treated with Thrb shRNA (sh-Thrb) or scrambled shRNA (scr). The x-axis shows the location of the forward primer relative to the TSS. Data are expressed as relative fold enrichment of THRA in sh-Thrb vs. scr cells ± sem. *, P < 0.05, sh-Thrb vs. scr.
THRB, but not THRA, is essential for the Tshb-negative regulation by T3
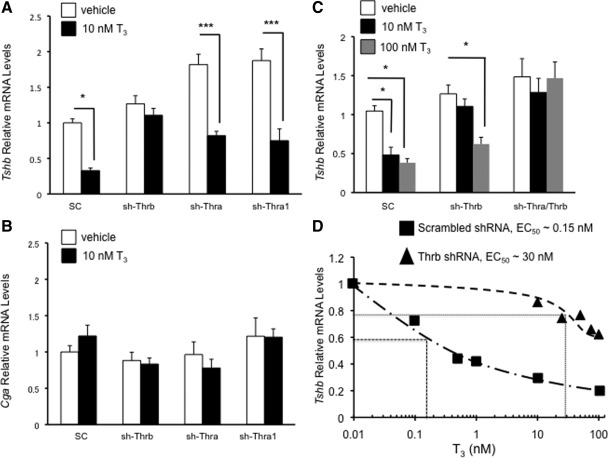
Next we examined the effect of knockdown of either THRA or THRB on T3-mediated regulation of Tshb. Only depletion by Thrb common shRNA abolished 10 nm T3 induced down-regulation of Tshb mRNA (Fig. 6A); knockdown of THRA1 or THRA2 had no effect on T3 mediated down-regulation of Tshb. None of the shRNA affected the expression of Cga in either the absence or presence of 10 nm T3, indicating that T3-dependent effects of the adenoviruses on Tshb gene expression were specific (Fig. 6B). Given our findings that THRA could bind to the 5′-region of the Tshb gene after knockdown of THRB, we tested higher doses of T3 (100 nm) to determine whether the set point for Tshb negative regulation may be different in cells in which THRB had been knocked down. We found in cells depleted of THRB that T3 was able to down-regulate Tshb mRNA significantly only at 100 nm but not at 10 nm (Fig. 6C, middle bars). Interestingly, with knockdown of both THRA and THRB, no T3 inhibition was observed either at 10 nm or at 100 nm (Fig. 6C, bars on the right), in contrast to scrambled shRNA-treated cells. Thus, it seems that in the absence of THRB, THRA is able to partially rescue the effect of T3 on Tshb, albeit at much higher doses. Finally, we performed a concentration response curve, comparing cells treated with scrambled shRNA or Thrb shRNA (Fig. 6D). Interestingly, we found that the approximate EC50 is higher after Thrb shRNA treatment compared with cells treated with scrambled shRNA (∼30 nm vs. ∼0.15 nm). Given our finding that THRA is recruited to the Tshb promoter after THRB knockdown, this suggests that in vivo, the DNA or even ligand binding properties of the THR isoforms may be different.
Fig. 6.
Tshb and Cga mRNA levels are differentially regulated by THR. TαT1.1 cells were transduced with adenovirus expressing scrambled shRNA (SC) or shRNA against Thrb (sh-Thrb), Thra common (shThra), or Thra1 (sh-Thra1). The cells were treated with vehicle or T3 (10 nm) for 48 h and were harvested for total RNA. RT-qPCR analysis for Tshb mRNA levels (A) and Cga mRNA (B) was performed. C, Tshb relative mRNA is shown after cells were transduced scrambled, Thrb, or both Thrb and Thra shRNA. Cells were treated with vehicle, T3 10 nm, or T3 100 nm for 48 h. D, We show the results of a more extensive dose-response curve for cells treated with scrambled shRNA (■) or Thrb shRNA (▴), with approximate EC50 shown for each treatment group. In all the experiments, relative mRNA levels are expressed as fold change compared with vehicle-treated cells exposed to scrambled shRNA. At least three determinations were performed for each treatment group, and data are shown as mean ± sem. *, P < 0.05 vs. vehicle, scrambled shRNA treatment.
THRB is essential for T3-negative regulation of Trhr
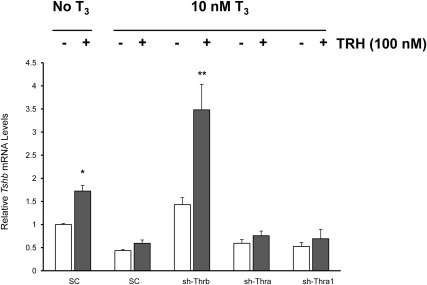
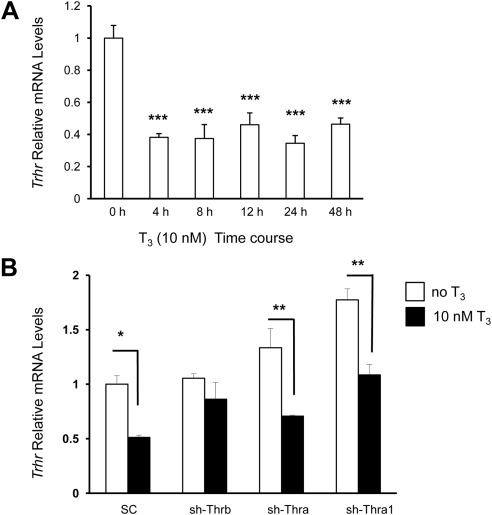
The above findings strongly suggest that THRB is important for T3-induced negative regulation of Tshb, whereas THRA may have a role in the absence of THRB or at very high levels of thyroid hormone. Feedback of T3 on Tshb gene may also involve an indirect pathway in the thyrotroph involving blunting of TRH stimulatory effect on the Tshb gene. We found that TRH (100 nm) can increase Tshb mRNA levels by 1.8-fold in TαT1.1 cells (Fig. 7). In the presence of thyroid hormone, cells treated with scrambled shRNA showed a blunted TRH effect (Fig. 7, second set of bars). Interestingly, only those cells depleted of THRB showed a rescue of the TRH effect that occurred even in the presence of T3 (Fig. 7, third set of bars). There is evidence that the TRHR density is negatively regulated by T3. Therefore, we were interested to know whether the above-described effect of THRB depletion to restore TRH responsiveness may be due to an alteration of TRHR. For example, Trhr mRNA levels in the anterior pituitary are elevated in hypothyroid rats (8). To characterize further T3 negative regulation of the Trhr gene in TαT1.1 cells, we measured Trhr mRNA levels over a time after the addition of 10 nm of T3. Figure 8A demonstrates that as early as 4 h after T3 treatment, Trhr mRNA levels were significantly reduced (P < 0.001) and remained suppressed over the 48-h treatment period.
Fig. 7.
Knockdown of THRB rescues TRH despite concurrent T3 treatment. TαT1.1 cells were treated as indicated in the upper part of the figure. Tshb relative mRNA after vehicle (white bars) or TRH 100 nm (gray bars) is compared. The x-axis shows the different shRNA used. Data were normalized for each mRNA relative to the samples without T3 or TRH treatment and exposed to scrambled shRNA viral infection. Data are shown as mean ± sem of at least three separate experiments performed in triplicate. *, P < 0.05; **, P < 0.01.
Fig. 8.
In TαT1.1 cells, Trhr mRNA is down-regulated by T3. A, A time-course experiment shows the effect of T3 on Trhr mRNA levels in TαT1.1 cells. Cells were treated with stripped serum medium containing 10 nm T3 for 4, 8, 12, 24, and 48 h. After treatment, total RNA was extracted and subjected to RT-qPCR analysis using primers to amplify the Trhr gene. Data were normalized for each mRNA level relative to vehicle-treated samples. B, RT-qPCR analysis of Trhr mRNA relative expression before and after treatment with 10 nm T3 for 48 h after transduction with indicated shRNA viral. Data were normalized for each mRNA relative to the scrambled shRNA-exposed samples treated with vehicle. Data are shown as mean ± sem of at least three separate experiments performed in triplicate. *, P < 0.05; **, P < 0.01; ***, P < 0.001.
Next, we analyzed the role of THR isoforms on Trhr gene expression in TαT1.1 cells using the shRNA-expressing adenoviruses as described above. After viral transduction, TαT1.1 cells were treated with either vehicle or 10 nm T3. Only THRB depletion blocked Trhr mRNA down-regulation by T3 (Fig. 8B, second set of bars). These data suggest that T3 may exert its effect on Tshb mRNA levels, either by down-regulating TRHR through an interaction with THRB (Fig. 8B) or because the liganded THRB has a suppressive effect on TRH induced Tshb (Fig. 7). At this point we cannot say which of these mechanisms is important in vivo. Also, we note that TRH secretion is pulsatile, whereas our treatment of TαT1.1 cells consisted of a single dose and the situation in vivo maybe quite different.
Discussion
The importance of TH-negative feedback in the control of the HPT axis is well established, and THR play a critical role. We were interested in knowing the relative roles of THR isoforms in regulation of Tshb by T3. Our study using a homologous pituitary cell line with specific antibodies to interrogate THR enrichment on DNA supports the notion that THRB binds preferentially to DNA near the Tshb TSS. Our knockdown studies show that there is no effect of THRA knockdown on T3-mediated down-regulation of Tshb, consistent with our ChIP assay findings. In contrast, knockdown of THRB abolishes the effect of 10 nm T3 to suppress Tshb mRNA levels. However, at 100 nm T3, there was a significant decrease in Tshb mRNA levels despite THRB knockdown. Interestingly, we found that THRA was able to bind to Tshb when THRB is knocked down, suggesting a partial compensation by THRA for THRB depletion. This was confirmed by our findings in cells depleted of both THRB and THRA; Tshb mRNA levels were not affected by either 10 nm or 100 nm T3. Interestingly, comparing the Tshb concentration response in cells depleted of THRB vs. control cells indicates that the in vivo EC50 of THRA and THRB may be context dependent. A more detailed analysis of why this occurs requires further, extensive in vitro molecular studies.
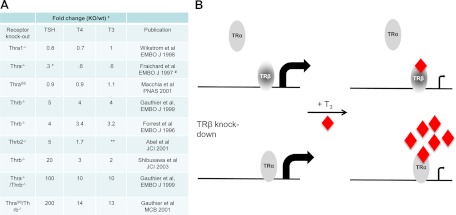
Based on these data, we suggest a model (Fig. 9B) for regulation of Tshb mRNA by T3 that requires THRB bound in the Tshb promoter region. THRA can compensate for THRB, although only at higher T3 levels. Such an on-DNA model is also supported by reports that have identified possible negative TRE near the TSS (31, 32, 39, 40). In addition, several in vitro and in vivo studies support the importance of DNA binding for THR action in the negative regulation of Tshb gene. For example, the THR-DNA binding mutant GS125 THRB has a two-amino acid substitution within the P box so that it resembles the P box of the glucocorticoid receptor. This mutant THR displayed low binding affinity for both positive and proposed negative TRE. In transient transfection studies, the mutant THR abolished regulation of all negatively regulated promoters in the HPT axis while preserving normal interactions with transcriptional cofactors (27). Finally, a GS125 THRB knock-in mouse model shows that homozygous animals have a phenotype similar to that observed in Thrb knockout (KO) animals, with disruption of T3-negative regulation of the axis. This confirmed the importance of THR DNA binding in this mechanism (26). It seems clear that binding of THR to DNA is important for T3 mediated down-regulation of Tshb, and our data suggest that the major THR isoform bound to DNA in the pituitary is THRB. We believe our findings to be specific because we did not identify any THR enrichment in a similar region of the Cga gene, which is not regulated by T3 in this cell line.
Fig. 9.
A, Summary of available THR KO mouse models. This table compares the circulating TSH and TH levels unless otherwise indicated, with values expressed as an approximate fold change relative to wild-type controls. Where possible, the authors' original values have been used; otherwise, we have chosen to estimate based on the available data. Methodologies for measurement vary substantially. *, Tshb mRNA levels; **, not measured; #, substantial postnatal death reported (values from 3 wk old mice used for this table). B, Model for the relative roles of THRA and THRB in T3-mediated down-regulation of the Tshb gene.
Mouse KO models have also been useful in dissecting the roles of the different thyroid hormone receptor isoforms. The accompanying table (Fig. 9A) summarizes information from published mouse KO models. Although different methodologies have been used to quantify thyrotropin and thyroid hormone levels, we concluded that although KO of THRA is associated with either no change or mild decreases in both thyrotropin and either T4 or T3 (20, 41, 42), KO of THRB is associated with significant increases in both thyrotropin and thyroid hormone levels (18, 19, 43). Interestingly, KO of both THRB and THRA is associated with markedly increased levels of thyrotropin and TH, almost 10-fold compared with that seen in THRB KO alone (43, 44). Therefore, we concluded that although both THR isoforms have important roles in regulating Tshb, their roles are clearly distinct. Finally, the analysis of a patient with dominant-negative THRA mutations has been recently reported (45). The patient has a distinct phenotype of growth retardation but not pituitary resistance to thyroid hormone; thyrotropin and T3 levels appear within the normal range, whereas T4 levels are low.
Our study provides novel insight into the reasons for this distinction. Previous studies involving heterologous cell lines have not investigated the potential for THRA to bind to Tshb, and transfection studies may have missed THR isoform-specific differences in DNA-binding affinity because of the artificial nature of the overexpression experiments. Using the novel pituitary thyrotroph cell line, TαT1.1, and antibodies that we established as specific for THRA, THRB1, and THRB2, we are able to define important but different roles for these isoforms. Although our studies do not define whether THRB1 or THRB2 has a predominant role, we are not aware of a precise description of relative amounts of protein isoforms in vivo. Given that our Thrb shRNA was directed at both THRB isoforms, we suspect but cannot prove that THRB1 and THRB2 have at least partially overlapping roles. This would be supported by evidence suggesting that some mutations that cause resistance to thyroid hormone proportionally reduce responsiveness to T3, when expressed in either THRB1 or THRB2 context (46). However, given that our findings are consistent with observations from in vivo models, we believe this model is appropriate and has the potential for allowing further mechanistic insights, specifically related to events that occur after T3 binding to THR.
Another important component of the HPT axis is the predominant role of TRH as a stimulator of thyrotropin synthesis and secretion. Indeed, studies have shown that hypothalamic TRH is important in establishing the set point for the negative regulation of the HPT axis by T3 (47). Although our study cannot address the role of T3 and THR in the regulation of TRH itself, we have begun to investigate the downstream effects of TRH in TαT1.1 cells. First, knockdown of THRB, but not THRA, abolishes the effect of T3 on TRH-mediated increase in Tshb mRNA. Furthermore, we show that this may be due to the effect of T3 on TRHR levels because down-regulation of TRHR mRNA is abolished by THRB knockdown but is maintained after THRA knockdown.
Determination of the THR structure allowed the design of the THRB isoform-specific thyromimetics. Studies have shown that it is possible to dissociate presumed THRB effects from THRA effects using such thyromimetics, although THRA-specific thyromimetics have not been convincingly developed yet (48–51). These effects depend at least in part on tissue-selective expression of the different THR isoforms. Our study raises the question of whether THRB and THRA have different binding affinities for the negative TH response element(s) on Tshb and as to whether there is differential ligand sensitivity in different DNA contexts. It has already been suggested that THRA1 and THRB1 display different transcriptional properties on individual target genes (52). Furthermore, studies show THRB more readily forms homodimers than THRA and, perhaps by consequence, suggest that THRA forms heterodimers more strongly than THRB (53, 54). Furthermore, DNA response elements may direct THR recruitment. For example, direct repeat TRE bind heterodimers preferentially (55), whereas inverted palindromes bind homodimers (56). Previous studies have suggested that a negative TRE is near the TSS and that this site binds THR as monomer (39). However, THR binding may be promoter-context specific, and for this reason our study provides a more physiologically relevant model for further mechanistic studies.
In summary, we establish differential roles for the THR isoforms in T3-induced negative regulation of the HPT axis due to differences in DNA binding to the Tshb promoter. Based on our data and that available from mouse models of THR isoform KO, we propose a model for T3-mediated down-regulation of Tshb (Fig. 9B). The liganded THRB induces events that lead to down-regulation of Tshb mRNA. If THRB is knocked down, THRA can enrich in similar regions and can induce down-regulation of Tshb mRNA, although only at higher concentrations of T3. This model therefore proposes another level of redundancy in the HPT axis-regulatory system via THRA and highlights the potential importance that evolution placed on feedback regulation of this axis.
Acknowledgments
This work was supported by National Institutes of Health (NIH) Grant R01DK049126 D from the Molecular Mechanisms of Thyroid Hormone Action and by NIH Grant P60 DK07963 from the Johns Hopkins University-University of Maryland Diabetes and Research Training Center.
Disclosure Summary: M.I.C., A.R.S., S.M., T.M.O.-C., K.H., Q.H., and F.E.W. have nothing to disclose.
NURSA Molecule Pages†:
Ligands: Thyroid hormone.
Annotations provided by Nuclear Receptor Signaling Atlas (NURSA) Bioinformatics Resource. Molecule Pages can be accessed on the NURSA website at www.nursa.org.
- Cga
- Common glycoprotein α-subunit
- ChIP
- chromatin immunoprecipitation
- HPT
- hypothalamic-pituitary-thyroid
- KO
- knockout
- qPCR
- quantitative PCR
- RT-qPCR
- real-time PCR analysis
- shRNA
- short hairpin RNA
- TH
- thyroid hormone
- THR
- thyroid hormone receptor
- TRE
- thyroid hormone response element
- TRHR
- TRH receptor
- TSS
- transcriptional start site.
References
- 1. Shupnik MA, Chin WW, Ridgway EC. 1989. T3 regulation of TSH gene expression. Endocr Res 15:579–599 [DOI] [PubMed] [Google Scholar]
- 2. Shupnik MA, Ridgway EC, Chin WW. 1989. Molecular biology of thyrotropin. Endocr Rev 10:459–475 [DOI] [PubMed] [Google Scholar]
- 3. Larsen PR. 1982. Thyroid-pituitary interaction: feedback regulation of thyrotropin secretion by thyroid hormones. N Engl J Med 306:23–32 [DOI] [PubMed] [Google Scholar]
- 4. Koller KJ, Wolff RS, Warden MK, Zoeller RT. 1987. Thyroid hormones regulate levels of thyrotropin-releasing-hormone mRNA in the paraventricular nucleus. Proc Natl Acad Sci USA 84:7329–7333 [DOI] [PMC free article] [PubMed] [Google Scholar]
- 5. Segerson TP, Kauer J, Wolfe HC, Mobtaker H, Wu P, Jackson IM, Lechan RM. 1987. Thyroid hormone regulates TRH biosynthesis in the paraventricular nucleus of the rat hypothalamus. Science 238:78–80 [DOI] [PubMed] [Google Scholar]
- 6. Hinkle PM, Perrone MH, Greer TL. 1979. Thyroid hormone action in pituitary cells. Differences in the regulation of thyrotropin-releasing hormone receptors and growth hormone synthesis. J Biol Chem 254:3907–3911 [PubMed] [Google Scholar]
- 7. Hinkle PM, Perrone MH, Schonbrunn A. 1981. Mechanism of thyroid hormone inhibition of thyrotropin-releasing hormone action. Endocrinology 108:199–205 [DOI] [PubMed] [Google Scholar]
- 8. Yamada M, Monden T, Satoh T, Iizuka M, Murakami M, Iriuchijima T, Mori M. 1992. Differential regulation of thyrotropin-releasing hormone receptor mRNA levels by thyroid hormone in vivo and in vitro (GH3 cells). Biochem Biophys Res Commun 184:367–372 [DOI] [PubMed] [Google Scholar]
- 9. Lazar MA. 1993. Thyroid hormone receptors: multiple forms, multiple possibilities. Endocr Rev 14:184–193 [DOI] [PubMed] [Google Scholar]
- 10. Cheng SY, Leonard JL, Davis PJ. 2010. Molecular aspects of thyroid hormone actions. Endocr Rev 31:139–170 [DOI] [PMC free article] [PubMed] [Google Scholar]
- 11. Koenig RJ, Lazar MA, Hodin RA, Brent GA, Larsen PR, Chin WW, Moore DD. 1989. Inhibition of thyroid hormone action by a non-hormone binding c-erbA protein generated by alternative mRNA splicing. Nature 337:659–661 [DOI] [PubMed] [Google Scholar]
- 12. Tagami T, Kopp P, Johnson W, Arseven OK, Jameson JL. 1998. The thyroid hormone receptor variant α2 is a weak antagonist because it is deficient in interactions with nuclear receptor corepressors. Endocrinology 139:2535–2544 [DOI] [PubMed] [Google Scholar]
- 13. Chassande O, Fraichard A, Gauthier K, Flamant F, Legrand C, Savatier P, Laudet V, Samarut J. 1997. Identification of transcripts initiated from an internal promoter in the c-erbAα locus that encode inhibitors of retinoic acid receptor-α and triiodothyronine receptor activities. Mol Endocrinol 11:1278–1290 [DOI] [PubMed] [Google Scholar]
- 14. Prost E, Koenig RJ, Moore DD, Larsen PR, Whalen RG. 1988. Multiple sequences encoding potential thyroid hormone receptors isolated from mouse skeletal muscle cDNA libraries. Nucleic Acids Res 16:6248. [DOI] [PMC free article] [PubMed] [Google Scholar]
- 15. Plateroti M, Chassande O, Fraichard A, Gauthier K, Freund JN, Samarut J, Kedinger M. 1999. Involvement of T3Rα- and β-receptor subtypes in the mediation of T3 functions during postnatal murine intestinal development. Gastroenterology 116:1367–1378 [DOI] [PubMed] [Google Scholar]
- 16. Abel ED, Kaulbach HC, Campos-Barros A, Ahima RS, Boers ME, Hashimoto K, Forrest D, Wondisford FE. 1999. Novel insight from transgenic mice into thyroid hormone resistance and the regulation of thyrotropin. J Clin Invest 103:271–279 [DOI] [PMC free article] [PubMed] [Google Scholar]
- 17. Weiss RE, Forrest D, Pohlenz J, Cua K, Curran T, Refetoff S. 1997. Thyrotropin regulation by thyroid hormone in thyroid hormone receptor β-deficient mice. Endocrinology 138:3624–3629 [DOI] [PubMed] [Google Scholar]
- 18. Forrest D, Erway LC, Ng L, Altschuler R, Curran T. 1996. Thyroid hormone receptor β is essential for development of auditory function. Nat Genet 13:354–357 [DOI] [PubMed] [Google Scholar]
- 19. Abel ED, Ahima RS, Boers ME, Elmquist JK, Wondisford FE. 2001. Critical role for thyroid hormone receptor β2 in the regulation of paraventricular thyrotropin-releasing hormone neurons. J Clin Invest 107:1017–1023 [DOI] [PMC free article] [PubMed] [Google Scholar]
- 20. Macchia PE, Takeuchi Y, Kawai T, Cua K, Gauthier K, Chassande O, Seo H, Hayashi Y, Samarut J, Murata Y, Weiss RE, Refetoff S. 2001. Increased sensitivity to thyroid hormone in mice with complete deficiency of thyroid hormone receptor α. Proc Natl Acad Sci USA 98:349–354 [DOI] [PMC free article] [PubMed] [Google Scholar]
- 21. Wondisford FE. 2003. Thyroid hormone action: insight from transgenic mouse models. J Investig Med 51:215–220 [DOI] [PubMed] [Google Scholar]
- 22. Gauthier K, Plateroti M, Harvey CB, Williams GR, Weiss RE, Refetoff S, Willott JF, Sundin V, Roux JP, Malaval L, Hara M, Samarut J, Chassande O. 2001. Genetic analysis reveals different functions for the products of the thyroid hormone receptor α locus. Mol Cell Biol 21:4748–4760 [DOI] [PMC free article] [PubMed] [Google Scholar]
- 23. Fozzatti L, Lu C, Kim DW, Park JW, Astapova I, Gavrilova O, Willingham MC, Hollenberg AN, Cheng SY. 2011. Resistance to thyroid hormone is modulated in vivo by the nuclear receptor corepressor (NCOR1). Proc Natl Acad Sci USA 108:17462–17467 [DOI] [PMC free article] [PubMed] [Google Scholar]
- 24. Vella KR, Hollenberg AN. 2009. The ups and downs of thyrotropin-releasing hormone. Endocrinology 150:2021–2023 [DOI] [PMC free article] [PubMed] [Google Scholar]
- 25. Sugrue ML, Vella KR, Morales C, Lopez ME, Hollenberg AN. 2010. The thyrotropin-releasing hormone gene is regulated by thyroid hormone at the level of transcription in vivo. Endocrinology 151:793–801 [DOI] [PMC free article] [PubMed] [Google Scholar]
- 26. Shibusawa N, Hashimoto K, Nikrodhanond AA, Liberman MC, Applebury ML, Liao XH, Robbins JT, Refetoff S, Cohen RN, Wondisford FE. 2003. Thyroid hormone action in the absence of thyroid hormone receptor DNA-binding in vivo. J Clin Invest 112:588–597 [DOI] [PMC free article] [PubMed] [Google Scholar]
- 27. Shibusawa N, Hollenberg AN, Wondisford FE. 2003. Thyroid hormone receptor DNA binding is required for both positive and negative gene regulation. J Biol Chem 278:732–738 [DOI] [PubMed] [Google Scholar]
- 28. Carr FE, Kaseem LL, Wong NC. 1992. Thyroid hormone inhibits thyrotropin gene expression via a position-independent negative L-triiodothyronine-responsive element. J Biol Chem 267:18689–18694 [PubMed] [Google Scholar]
- 29. Satoh T, Yamada M, Iwasaki T, Mori M. 1996. Negative regulation of the gene for the preprothyrotropin-releasing hormone from the mouse by thyroid hormone requires additional factors in conjunction with thyroid hormone receptors. J Biol Chem 271:27919–27926 [DOI] [PubMed] [Google Scholar]
- 30. Hollenberg AN, Monden T, Flynn TR, Boers ME, Cohen O, Wondisford FE. 1995. The human thyrotropin-releasing hormone gene is regulated by thyroid hormone through two distinct classes of negative thyroid hormone response elements. Mol Endocrinol 9:540–550 [DOI] [PubMed] [Google Scholar]
- 31. Carr FE, Wong NC. 1994. Characteristics of a negative thyroid hormone response element. J Biol Chem 269:4175–4179 [PubMed] [Google Scholar]
- 32. Wondisford FE, Farr EA, Radovick S, Steinfelder HJ, Moates JM, McClaskey JH, Weintraub BD. 1989. Thyroid hormone inhibition of human thyrotropin β-subunit gene expression is mediated by a cis-acting element located in the first exon. J Biol Chem 264:14601–14604 [PubMed] [Google Scholar]
- 33. Yusta B, Alarid ET, Gordon DF, Ridgway EC, Mellon PL. 1998. The thyrotropin β-subunit gene is repressed by thyroid hormone in a novel thyrotrope cell line, mouse TαT1 cells. Endocrinology 139:4476–4482 [DOI] [PubMed] [Google Scholar]
- 34. Machado DS, Sabet A, Santiago LA, Sidhaye AR, Chiamolera MI, Ortiga-Carvalho TM, Wondisford FE. 2009. A thyroid hormone receptor mutation that dissociates thyroid hormone regulation of gene expression in vivo. Proc Natl Acad Sci USA 106:9441–9446 [DOI] [PMC free article] [PubMed] [Google Scholar]
- 35. Livak KJ, Schmittgen TD. 2001. Analysis of relative gene expression data using real-time quantitative PCR and the 2[-ΔΔC(T)] method. Methods 25:402–408 [DOI] [PubMed] [Google Scholar]
- 36. Janssen JS, Sharma V, Pugazhenthi U, Sladek C, Wood WM, Haugen BR. 2011. A rexinoid antagonist increases the hypothalamic-pituitary-thyroid set point in mice and thyrotrope cells. Mol Cell Endocrinol 339:1–6 [DOI] [PMC free article] [PubMed] [Google Scholar]
- 37. Ohba K, Sasaki S, Matsushita A, Iwaki H, Matsunaga H, Suzuki S, Ishizuka K, Misawa H, Oki Y, Nakamura H. 2011. GATA2 mediates thyrotropin-releasing hormone-induced transcriptional activation of the thyrotropin β gene. PLoS One 6:e18667. [DOI] [PMC free article] [PubMed] [Google Scholar]
- 38. Matsushita A, Sasaki S, Kashiwabara Y, Nagayama K, Ohba K, Iwaki H, Misawa H, Ishizuka K, Nakamura H. 2007. Essential role of GATA2 in the negative regulation of thyrotropin β gene by thyroid hormone and its receptors. Mol Endocrinol 21:865–884 [DOI] [PubMed] [Google Scholar]
- 39. Bodenner DL, Mroczynski MA, Weintraub BD, Radovick S, Wondisford FE. 1991. A detailed functional and structural analysis of a major thyroid hormone inhibitory element in the human thyrotropin β-subunit gene. J Biol Chem 266:21666–21673 [PubMed] [Google Scholar]
- 40. Cohen O, Flynn TR, Wondisford FE. 1995. Ligand-dependent antagonism by retinoid X receptors of inhibitory thyroid hormone response elements. J Biol Chem 270:13899–13905 [DOI] [PubMed] [Google Scholar]
- 41. Wikström L, Johansson C, Saltó C, Barlow C, Campos Barros A, Baas F, Forrest D, Thorén P, Vennström B. 1998. Abnormal heart rate and body temperature in mice lacking thyroid hormone receptor α1. EMBO J 17:455–461 [DOI] [PMC free article] [PubMed] [Google Scholar]
- 42. Fraichard A, Chassande O, Plateroti M, Roux JP, Trouillas J, Dehay C, Legrand C, Gauthier K, Kedinger M, Malaval L, Rousset B, Samarut J. 1997. The T3R α gene encoding a thyroid hormone receptor is essential for post-natal development and thyroid hormone production. EMBO J 16:4412–4420 [DOI] [PMC free article] [PubMed] [Google Scholar]
- 43. Gauthier K, Chassande O, Plateroti M, Roux JP, Legrand C, Pain B, Rousset B, Weiss R, Trouillas J, Samarut J. 1999. Different functions for the thyroid hormone receptors TRα and TRβ in the control of thyroid hormone production and post-natal development. EMBO J 18:623–631 [DOI] [PMC free article] [PubMed] [Google Scholar]
- 44. Gauthier K, Aubert D, Chassande O, Flamant F, Samarut J. 2002. Null mutant mice for thyroid hormone receptors. Methods Mol Biol 202:13–29 [DOI] [PubMed] [Google Scholar]
- 45. Bochukova E, Schoenmakers N, Agostini M, Schoenmakers E, Rajanayagam O, Keogh JM, Henning E, Reinemund J, Gevers E, Sarri M, Downes K, Offiah A, Albanese A, Halsall D, Schwabe JW, Bain M, Lindley K, Muntoni F, Khadem FV, Dattani M, Farooqi IS, Gurnell M, Chatterjee K. 2012. A mutation in the thyroid hormone receptor α gene. N Engl J Med 366:243–249 [DOI] [PubMed] [Google Scholar]
- 46. Wan W, Farboud B, Privalsky ML. 2005. Pituitary resistance to thyroid hormone syndrome is associated with T3 receptor mutants that selectively impair β2 isoform function. Mol Endocrinol 19:1529–1542 [DOI] [PubMed] [Google Scholar]
- 47. Nikrodhanond AA, Ortiga-Carvalho TM, Shibusawa N, Hashimoto K, Liao XH, Refetoff S, Yamada M, Mori M, Wondisford FE. 2006. Dominant role of thyrotropin-releasing hormone in the hypothalamic-pituitary-thyroid axis. J Biol Chem 281:5000–5007 [DOI] [PubMed] [Google Scholar]
- 48. Berkenstam A, Kristensen J, Mellström K, Carlsson B, Malm J, Rehnmark S, Garg N, Andersson CM, Rudling M, Sjöberg F, Angelin B, Baxter JD. 2008. The thyroid hormone mimetic compound KB2115 lowers plasma LDL cholesterol and stimulates bile acid synthesis without cardiac effects in humans. Proc Natl Acad Sci USA 105:663–667 [DOI] [PMC free article] [PubMed] [Google Scholar]
- 49. Ribeiro MO, Bianco AC. 2011. Crossing the hurdles of thyroid hormone receptor-α activation. Endocrinology 152:745–747 [DOI] [PMC free article] [PubMed] [Google Scholar]
- 50. Amorim BS, Ueta CB, Freitas BC, Nassif RJ, Gouveia CH, Christoffolete MA, Moriscot AS, Lancelloti CL, Llimona F, Barbeiro HV, de Souza HP, Catanozi S, Passarelli M, Aoki MS, Bianco AC, Ribeiro MO. 2009. A TRβ-selective agonist confers resistance to diet-induced obesity. J Endocrinol 203:291–299 [DOI] [PMC free article] [PubMed] [Google Scholar]
- 51. Grijota-Martínez C, Samarut E, Scanlan TS, Morte B, Bernal J. 2011. In vivo activity of the thyroid hormone receptor β- and α-selective agonists GC-24 and CO23 on rat liver, heart, and brain. Endocrinology 152:1136–1142 [DOI] [PMC free article] [PubMed] [Google Scholar]
- 52. Chan IH, Privalsky ML. 2009. Isoform-specific transcriptional activity of overlapping target genes that respond to thyroid hormone receptors α1 and β1. Mol Endocrinol 23:1758–1775 [DOI] [PMC free article] [PubMed] [Google Scholar]
- 53. Lazar MA, Berrodin TJ, Harding HP. 1991. Differential DNA binding by monomeric, homodimeric, and potentially heteromeric forms of the thyroid hormone receptor. Mol Cell Biol 11:5005–5015 [DOI] [PMC free article] [PubMed] [Google Scholar]
- 54. Darling DS, Carter RL, Yen PM, Welborn JM, Chin WW, Umeda PK. 1993. Different dimerization activities of α and β thyroid hormone receptor isoforms. J Biol Chem 268:10221–10227 [PubMed] [Google Scholar]
- 55. Kurokawa R, Yu VC, Näär A, Kyakumoto S, Han Z, Silverman S, Rosenfeld MG, Glass CK. 1993. Differential orientations of the DNA-binding domain and carboxy-terminal dimerization interface regulate binding site selection by nuclear receptor heterodimers. Genes Dev 7:1423–1435 [DOI] [PubMed] [Google Scholar]
- 56. Wahlström GM, Sjöberg M, Andersson M, Nordström K, Vennström B. 1992. Binding characteristics of the thyroid hormone receptor homo- and heterodimers to consensus AGGTCA repeat motifs. Mol Endocrinol 6:1013–1022 [DOI] [PubMed] [Google Scholar]


