Abstract
We previously showed that the N6-methyladenosine (m6A) mRNA methylase is essential during Arabidopsis thaliana embryonic development. We also demonstrated that this modification is present at varying levels in all mature tissues. However, the requirement for the m6A in the mature plant was not tested. Here we show that a 90% reduction in m6A levels during later growth stages gives rise to plants with altered growth patterns and reduced apical dominance. The flowers of these plants commonly show defects in their floral organ number, size, and identity. The global analysis of gene expression from reduced m6A plants show that a significant number of down-regulated genes are involved in transport, or targeted transport, and most of the up-regulated genes are involved in stress and stimulus response processes. An analysis of m6A distribution in fragmented mRNA suggests that the m6A is predominantly positioned toward the 3′ end of transcripts in a region 100–150 bp before the poly(A) tail. In addition to the analysis of the phenotypic changes in the low methylation Arabidopsis plants we will review the latest advances in the field of mRNA internal methylation
Keywords: post-transcriptional, mRNA methylation, MT-A70, IME4, METTL3
Introduction
N6-methyladenosine (m6A) is a ubiquitous base modification found internally in the mRNA of most Eukaryotes. Levels of methylation equivalent to at least 50% of transcripts carrying m6A are common (Zhong et al., 2008; Bodi et al., 2010), although its relative abundance may vary between species, or between tissue types within a species (Desrosiers et al., 1974; Adams and Cory, 1975; Perry et al., 1975; Wei et al., 1976; Beemon and Keith, 1977; Levis and Penman, 1978; Aloni et al., 1979; Kennedy and Lane, 1979; Nichols, 1979; Haugland and Cline, 1980). Ribonuclease fragmentation and labeling studies on mRNA show m6A to be present only at the central A within the sequence context GAC and AAC, with a 75% preference for GAC, and this consensus appears to be conserved amongst plants, yeast and mammals (Wei et al., 1976; Nichols and Welder, 1981; Harper et al., 1990; Shimba et al., 1995; Zhong et al., 2008; Bodi et al., 2010). Whilst other types of post-transcriptional base modification, such as C-to-U editing, or A-to-I conversions result in a change following reverse transcription, m6A is recognized as adenosine and so is not revealed by cDNA sequencing. For this reason it is technically demanding to map its position in specific messages, and this has only been achieved in two, relatively abundant, transcripts. In Rous sarcoma virus a 1865 nt region of the genomic RNA contains seven m6A sites in a GAC context (Kane and Beemon, 1985; Csepany et al., 1990), and in bovine prolactin mRNA, methylation occurs at a single AGACU site within the 3′ untranslated region (UTR; Horowitz et al., 1984). In both cases, this conformed to an extended consensus sequence RRACH (where R represents purine, A is the methylation site, and H is any base other than G), previously proposed by Schibler et al. (1977) Consistent with this, the partially purified mammalian mRNA methylase shows strongest activity for GGACU and, to a lesser extent, AGACU sequences (Harper et al., 1990). Whilst m6A is clearly abundant within the mRNA pool, very few methylated transcripts have been identified to date. However, using an anti-m6A immunoprecipitation approach, four Saccharomyces cerevisiae messages, expressed during early meiosis were recently shown to be methylated (Bodi et al., 2010). The position of m6A in the meiotic kinase IME2, was mapped to the 3′ half of the message, a region where the translational suppressor Khd1 has previously been predicted to bind (Hasegawa et al., 2009; Bodi et al., 2010).
Bokar et al. (1997) identified MT-A70 (assigned as METTL3 by HUGO Gene Nomenclature Committee) as the human mRNA m6A methyltransferase. A phylogenetic analysis of proteins homologous to METTL3 has identified conserved orthologs among most sequenced eukaryote genomes, including mammals, fish, amphibians, insects, plants, and some fungi (S. cerevisiae; Bujnicki et al., 2002). In S. cerevisiae, the METTL3 homolog (IME4) is only expressed in starved, diploid cells. Under these conditions, sporulation would normally occur, but disruption of IME4 abolishes mRNA methylation and prevents the initiation of this developmental pathway (Clancy et al., 2002; Bodi et al., 2010). Arabidopsis thaliana homozygous for an insertional knockout of the METTL3 homolog (MTA) arrest at the globular stage of embryonic development and the poly(A) RNA purified from these embryos lacks m6A (Zhong et al., 2008). More recently, a deletion of the Drosophila METTL3 homolog (Dm ime4) was shown to inhibit oogenesis, though the methylation status of the wild type or knockout flies was not reported (Hongay and Orr-Weaver, 2011). The consequence of knockout or silencing of the mammalian METTL3 is currently not known, and may well be lethal. However, in a recent paper (Jia et al., 2011) it is shown that the primary function of the human fat mass and obesity associated protein (FTO) is to remove the methyl groups from N6 methylated adenosines in mRNA. Overexpression of FTO (implying reduced methylation) is associated with obesity, diabetes, and risk of Alzheimer’s. Thus there is an intriguing link between nutrition and mRNA methylation in both yeast and mammals. This link may also exist in plants, as AtFIP37 (a protein partner of the Arabidopsis MTA) is the only known target of Arabidopsis FKBP12, a component of the target of rapamycin (TOR) pathway – a conserved pathway that regulates cellular responses to growth factors and nutrient availability in Eukaryotes.
Whilst an association between mRNA methylation and stress, particularly nutrient, signaling may exist, the function that m6A performs at a molecular level remains a mystery. Tuck et al. (1999) proposed that the presence of m6A in a message increases translatability. These authors observed an in vitro methylated dihydrofolate reductase message translated more efficiently than the non-methylated transcript in an in vitro translation assay. Roles in mRNA nuclear export or splicing have also been suggested. A role in splicing was also supported by the interaction between A. thaliana FIP37 (FKBP12 interacting protein) and MTA (Zhong et al., 2008), as AtFIP37 is a homolog of Drosophila female-lethal(2)d, required for sex-specific splicing. However, in yeast none of the methylated messages identified so far are spliced (Bodi et al., 2010) and no involvement of AtFIP37 in splicing has so far been demonstrated. Other functions for mRNA methylation could also be envisaged, such as regulating siRNA or miRNA susceptibility, sub-cellular localization, nonsense mediated decay (NMD) or message turnover.
In this manuscript we demonstrate that Arabidopsis plants with decreased m6A levels show reduced apical dominance, abnormal organ definition, and increased number of trichome branches. In addition, a global transcriptome analysis revealed that groups of messages involved in localization and establishment of localization are significantly down regulated, whilst genes associated with response to external and internal stimuli are up-regulated in these plants. We also demonstrate that globally, the m6A is predominantly positioned toward the 3′ end of transcripts in a region 100–150 bp before the poly(A) tail.
Materials and Methods
Construction of MTA partial complementation plants
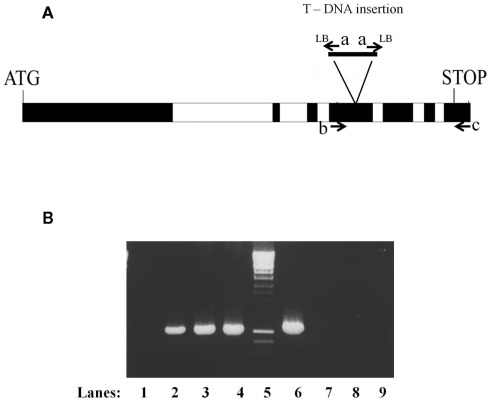
The MTA cDNA was cloned into the plant binary vector pGHABI3GWG (GenBank accession number FM177581) via an LR clonase (Invitrogen) reaction from a pENTR/D-TOPO (Invitrogen) vector containing the full MTA coding sequence (Zhong et al., 2008). After transfer to Agrobacterium tumefaciens C58, this vector was used for floral dip transformation of A. thaliana ecotype Columbia (Col) plants heterozygous for the SALK_074069 insertion. Transgenic seedlings were selected on hygromycin, and lines heterozygous for the SALK_074969 were identified by the production of a 1050-bp fragment following amplification with oligonucleotides Lba1 (TCGTTCACGTAGTGGGCCATCG) and A63UTRR (GACATTGGCTTTGTTTTTTTTGGAATTGAA). After self-pollination, T2 plants homozygous for SALK_074969 were identified by the absence of the wild type 1080 bp fragment obtained following PCR amplification with oligonucleotides A63UTRR and A6E4F (GACTTGCAAATACGTGCATTACG) and the presence of the 1050 bp fragment obtained with oligonucleotides Lba1 and A63UTRR (Figure 1). In each case the presence of the transgene was confirmed by amplification of a fragment of 799 bp after PCR amplification with oligonucleotides A6rev (CTAAGCTGTGATTGAGTCAATAG) and A6E4F.
Figure 1.
Confirmation of the homozygous nature of the SALK_074069 insertion in plants containing the ABI3MTA complementation cassette. (A) Structure of the MTA locus showing the location of the SALK_0749069 insertion (a rearranged T-DNA insertion line with two left borders) and the oligonucleotides used in the analysis. (B) The presence of the SALK_074069 insertion was confirmed by the presence of a band of 1050 bp following PCR amplification with oligonucleotides a (Lba1) and c (A63UTRR) (lanes 1–4). The homozygosity of the SALK insertion was confirmed by the lack of the 1080 bp wild type band seen after amplification with oligonucleotides b (A6E4F) and c (A63UTRR) (lanes 6–9). Lanes 1 and 6 wild type, 2 and 7 Line 8, 3 and 8 Line 10, 4 and 9 Line 14.
Mapping m6A distribution in the mRNA pool
Total RNA was extracted from Arabidopsis tissue samples using the method of Chomczynski and Sacchi (1987). Poly(A) RNA was purified using oligodT-Cellulose columns (Fluka) following a standard protocol (Sambrook and Russel, 2001). The oligo(dT) chromatography was carried out at least three times on each sample and the quality of the mRNA was checked on an RNA 6000 LabChip, with Agilent Bioanalyzer (Ambion). The alkaline fragmentation of the mRNA samples was carried out using a 100-mM carbonate/bicarbonate buffer system. The buffered mRNA samples had 60 mM Na2CO3 and 40 mM NaHCO3 as final concentrations, and were incubated at 60°C. The size of fragments was determined by the time of incubation, which was calculated according to the following formula:
where Lo = initial length of transcript (in kb)
Lt = desired RNA fragment length (in kb)
k = constant = 0.11 kb/min
t = time (min)
The initial length of the mRNA was approximated as 1.2 kb thus a desired fragment length of 150 nt was achieved by a 53-min incubation time. The fragmentation was stopped by adding 3 M sodium acetate, one tenth of the original volume, and three volumes of absolute Ethanol. After overnight precipitation (−20°C) the RNA pellet was obtained by centrifugation, washed with 80% ethanol, and resuspended in water. The size of fragments was checked on an RNA 6000 LabChip, with Agilent Bioanalyzer (Ambion). To prevent unwanted labeling of free 5′ ends, the fragments were phosphorylated using 20 units of T4 polynucleotide kinase (PNK; Fermentas) in the presence of 10 mM cold ATP and 1X PNK buffer in a final volume of 40 μL at 37°C for 1 h. The fragments containing poly(A) tails were purified away from the non-polyadenylated species by using oligo(dT) magnetic beads, PolyTtrack System 1000 (Promega). These were released by elution with 20 μL water. The m6A content of this sample was measured as previously described (Zhong et al., 2008). The unbound fraction, representing the 5′ end and middle region of the mRNA pool, was separated from the excess ATP using a micro-spin column (BioRad) with a 6 nt cut-off. This step was also used for buffer exchange (Tris–HCl). An aliquot of these fragments was used for m6A quantification. The rest of the sample was further processed for the analysis of fragments from caped 5′ ends. This sample was digested with 1 μL Terminator™ nuclease (Epicenter Biotechnologies) in a final volume of 70 μL with 1X reaction buffer at 30°C for 1 h. The reaction mixture was put through a micro-spin column and extracted with phenol–chloroform to stop the reaction. After ethanol precipitation, the RNA was resuspended in 7 μL of water and the m6A content was determined.
Microarray analysis
Trays of wild type and homozygous SALK_074069 ABI3MTA plants were grown in parallel for 3 weeks, at which point the 3rd to 6th rosette leaves were taken from each of four plants and these were pooled for RNA extraction. Three biological repeats of the wt and reduced m6A samples were prepared. The Affymetrix Arabidopsis ATH1 GeneChip® Genome Array was used for microarray analysis. Hybridizations were carried out at the NASC’s Affymetrix service (Nottingham Arabidopsis Stock Centre, University of Nottingham, UK). Total RNA samples were labeled, hybridized, and scanned following the standard protocol from the manufacturer (GeneChip Expression Analysis, Affymetrix1). The GeneChip Command Console Software (AGCC; Affymetrix) was used to generate “.cel” files for each of the hybridizations. These are available from the NASCArrays database (accession ID: NASCARRAYS-6122) and from GEO (accession ID: GSE349243). The raw chip data were normalized using the Robust Multichip Average (RMA) pre-normalization algorithm (Irizarry et al., 2003) in the GeneSpring GX (version 11; Agilent Technologies) analysis software package. Following RMA pre-normalization, the signals were further normalized by standardizing the signal value of each probe-set to the median of that probe-set across all hybridizations. Differentially expressed probe-sets were identified using a two-step process (i) fold-change ≥1.5 between mutant and wild type and (ii) a t-test (p ≤ 0.05) using the Benjamini and Hochberg multiple testing correction (Benjamini and Hochberg, 1995). All further analysis was carried out using different functions in GeneSpring GX. Gene Ontology analysis was performed using the GO analysis function in GeneSpring GX, with the p-value calculated using a hypergeometric test with Benjamini–Yekutieli correction (Benjamini and Yekutieli, 2001). The significance of gene list overlaps was calculated using a hypergeometric distribution test4.
Results
Complementation of MTA homozygous lines with the MTA cDNA under the control of the ABI3 promoter
We previously reported that the SALK_074069 T-DNA insertion in the AT4G10760 (MTA) gene in homozygous form results in an arrest at the globular stage during embryonic development (Zhong et al., 2008). This embryo lethality can be successfully rescued by a constitutively expressed MTA cDNA. All mature tissues tested were also shown to contain m6A in their mRNA and we wished to test if this was also performing an important or essential function. The role of mRNA methylation in normal mRNA metabolism is not known, and it remains possible that methylation plays a positive or negative role in post-transcriptional gene silencing; for this reason we wished to avoid an RNAi based approach for reducing MTA levels. Instead, we used the MTA cDNA under the control of the embryo-specific ABI3 promoter to rescue the homozygous embryo-lethal phenotype of the SALK_074069. This promoter construct directs the expression of MTA during embryonic development but limits the production of MTA beyond this stage. The expression of ABI3 has previously been extensively characterized and the promoter has been used to rescue other embryo-lethal mutations in order to study vegetative gene function (Rhode et al., 1999; Despres et al., 2001).
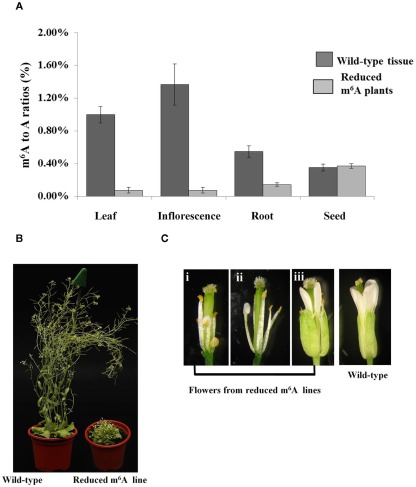
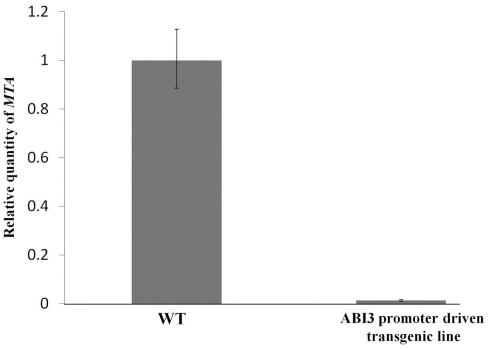
The full length MTA cDNA expressed under the control of the ABI3 promoter was used to transform plants hemizygous for the SALK_074069 insertion. Three transgenic lines that contained the SALK insertion were selected and allowed to self-pollinate. Among the progeny of each of these plants were individuals homozygous for the SALK_074069 insertion (Figures 1A,B), demonstrating that this construct was able to complement the embryo-lethal phenotype. Reduced levels of m6A methylation were assayed using thin layer chromatography (TLC) for separation and quantification of radio labeled nucleotides (Zhong et al., 2008). As expected, the m6A to A ratio in the seeds was similar to that of the wild type plants. However, in leaves, and in flowers there was a 90–93% reduction when the homozygous SALK_074069 insertion plants were compared to wild type (Figure 2A). This was consistent with the lower level of expression of the MTA cDNA on the Affymetrix ATH1 GeneChip (Tables S1 and S4 in Supplementary Material) and verified by qRT-PCR (Figure A1 in Appendix).
Figure 2.
Homozygous SALK_074069 plants complemented with the ABI3MTA transgene have reduced mRNA methylation and associated developmental defects. Samples were collected from three different plants from Line 8 transgenic plants. m6A measurements were carried out using the TLC method. Error bars represent SD of three replicates. Levels of m6A within mRNA is reduced by more than 90% in the leaves and flowers of the SALK_074069 ABI3MTA transgenic lines (A). Plants with reduced levels of m6A are more compact, have leaf crinkling, shorter inflorescence, and reduced apical dominance (B). Floral defects are common in the reduced m6A plants. Some stamens show partial conversion to petals [(i,ii), sepals and petals removed for clarity] and organ order is also sometimes affected (iii) (C).
Less than one quarter of the T2 generation was homozygous for the SALK_074069 insertion, and all of these had various developmental defects. Most of the observed plants had reduced inflorescence internode lengths, and a small, but bushy rosette compared to wild type plants. A general increase in the number of rosette leaves was also observed (Figure 2B) and these were more crinkled. However, the severity of the phenotypes varied between and amongst the three lines. This is probably due to variations in the copy number of the complementing ABI3MTA construct, since one third of homozygous plants are expected to have two copies of the construct. The architecture of flowers is also affected (Figure 2C), particularly in the first flowers of the inflorescence, where stamens often showed partial conversion to petals. Reduced seed set was also observed, but viable seed were recovered.
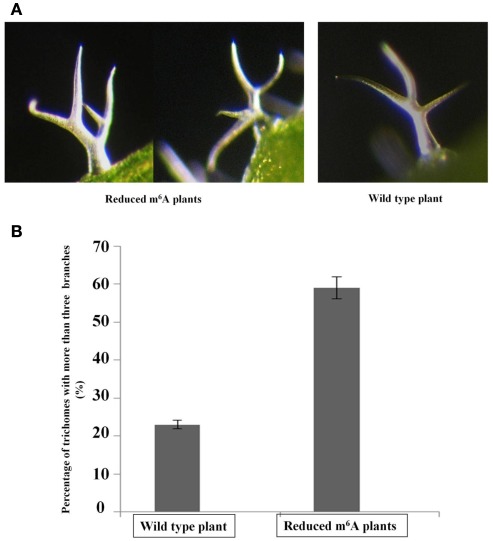
It was previously reported that overexpression of AtFIP37, the interacting partner of MTA (Zhong et al., 2008) increases trichome branching in Arabidopsis (Vespa et al., 2004). Trichomes have been used as a model for cell shape and polarity control in plants, and the degree of branching may also be an indication of endoreduplication levels, as appeared to be the case with AtFIP37 overexpression (Vespa et al., 2004). Interestingly, the reduced m6A plants showed a trichome phenotype similar to that of the AtFIP37 over-expressing lines. The fraction of trichomes with four or more branches is increased from 24 to 60% in the low methylation plants (Figure 3).
Figure 3.
Altered levels of trichome branching in 3-week-old seedlings. The third and fourth leaves from 3-weeks-old seedlings of wild type and homozygous SALK_074069 ABI3MTA plants were examined for changes in their trichome phenotypes. Light micrographs of trichomes from plants with low m6A levels and from wild type plants (A). The low m6A plants are characterized by a higher proportion of trichomes with four or more branches. Trichomes from the abaxial side were analyzed for the third and fourth leaves from four wild type and four low m6A plants, each from different transgenic lines (554 and 521 trichomes respectively). Sixty-three percentage of trichomes from low methylation plants had four or more branches compared to just 24% in wild type (B). Error bars represent SD of the replicates.
Global gene expression analysis in the low level methylation plants
Transcriptional changes in the reduced m6A plants compared to wild type were determined by hybridizing RNA from 3-week-old rosette leaves to the Affymetrix Arabidopsis ATH1 GeneChip. We identified 1537 differentially expressed genes (fold-change ≥1.5, corrected p ≤ 0.05). The differentially expressed gene set had 883 up-regulated and 654 down-regulated genes (Table S1 in Supplementary Material). Gene Ontology analysis was performed on the up and down-regulated genes separately to identify over represented terms. The most significantly enriched GO categories were “response to stimulus,” “response to stress,” “response to other organism,” and “response to biotic stimuli” 36, 28, 14, and 14% respectively of the up-regulated genes falling in these groups, this was followed by “response to external stimulus” 11%. This may suggest a function for mRNA methylation in the proper execution of responses to external, environmental and internal stimuli, or may be the consequence of a perceived stress due to reduced methylase activity. We also observed that there are a significant number of up-regulated genes involved in metabolism (58%), response to carbohydrate stimulus (4%), or carbohydrate binding (4%; Table S2 in Supplementary Material). The most significant GO terms enriched in the down-regulated set were associated with “establishment of localization,” “localization,” and “transport” (22% each). As well as “phospholipid biosynthetic process,” “phospholipid metabolic process,” “cellular lipid metabolic process” (4% each) “nitrate metabolic process,” and “nitrate assimilation” (2.5% each) were also represented (Table S3 in Supplementary Material). It is possible that loss of methylation in the vegetative state may interfere with localization of proteins, organelles, or mRNA. However, gene expression changes in the low methylation plants are likely to be a complex combination of superimposed secondary and primary outcomes of the lack of mRNA methylation in the mature plant.
We were particularly interested in genes which belong to GO categories such as RNA methyl transferase activity, RNA metabolic processes, vegetative to reproductive transmission, and meristem maintenance (Table S4 in Supplementary Material). Not surprisingly, the MTA gene was the most significantly down-regulated member of the RNA metabolic processes and methyl transferase activity groups.
The flowering time regulator FLOWERING LOCUS T (FT) gene was also found as a significant down-regulated gene in the vegetative to reproductive transmission group. We also found that ATFIP37, the only documented interacting partner of MTA (Zhong et al., 2008), is significantly up-regulated. This is consistent with our observation of increased trichome branch number.
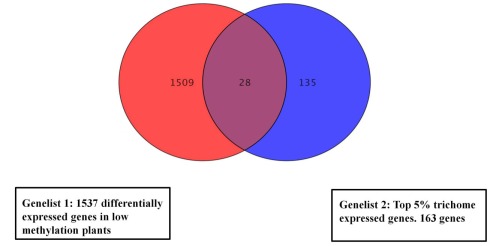
We compared gene lists generated from the methylation deficient plants data and a published data set of trichome expressed genes (Jakoby et al., 2008). In total, 28 (p < 0.01) overlapping genes (Figure 4) were identified and are listed in Table S5 in Supplementary Material. The most frequently represented categories in the trichome gene list are genes involved in responses to external or internal stimuli.
Figure 4.
Venn diagram showing overlapping expression changes of genes between low methylation plants and a trichome specific set. For the overlap search all genes with significant change were used from the low methylation versus wild type dataset (1537 genes). The central region corresponds to genes with changed expression in both trichomes and low methylation plants. The gene list is in Table S5 in Supplementary Material.
m6A is enriched in the 3′ end of the transcript
The 5′ cap and the 3′ poly(A) tail of Eukaryotic mRNA have a well recognized function in translation and RNA processing. The adjacent 5′ and 3′ UTRs may also contain binding sites for regulatory proteins or (particularly in animals) microRNAs. Nucleotide modification in these regions might alter RNA–protein interactions and so could impact upon gene expression. In order to determine if m6A is randomly distributed in the body of a transcript or shows a positional bias, we fragmented mRNA and separated the fragments into those derived from the 3′, 5′, or 5′ and middle of the transcripts. The amount of m6A in the different fractions was then determined using the previously described TLC quantification method (Zhong et al., 2008).
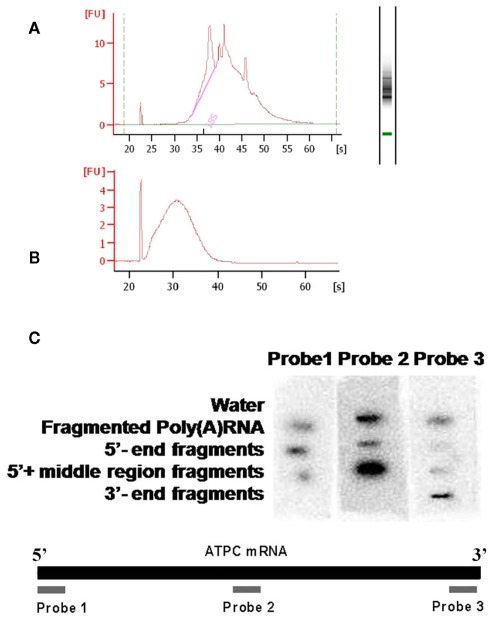
Poly(A) RNA was prepared from Arabidopsis wild type seedlings and was subjected to alkali hydrolysis using a sodium carbonate/hydrocarbonate buffer system. This method allowed a controlled fragmentation of the mRNA, where the fragment size was determined by the length of incubation time. An average 180 or 120 nt fragment size was achieved under our conditions, which was confirmed by RNA6000 LabChip (Agilent; Figure A2 in Appendix).
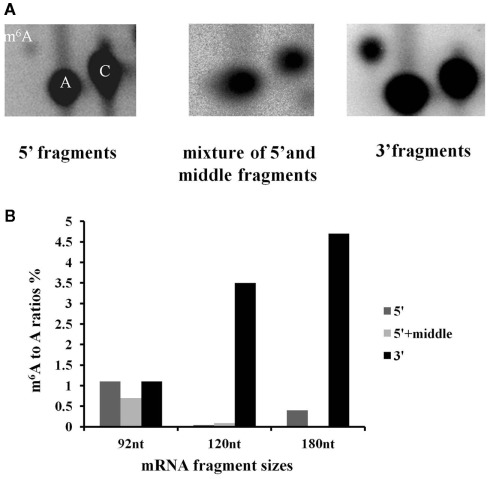
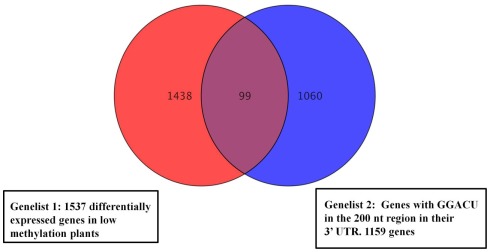
Following the hydrolysis, the exposed 5′ ends were polished using PNK and an excess of cold ATP to prevent subsequent labeling of the free ends. The fragments containing a poly(A) tail were obtained by hybridization to an oligo(dT) column, and the remaining 3′ end depleted fraction was considered to be a mixture of fragments from the 5′ end and middle part of the transcripts. An aliquot of this depleted fraction was further treated with terminator nuclease which eliminated all fragments with a 5′ monophosphate end and left only the 5′ caped fragments behind. This fraction was regarded as representing the 5′ end of the transcriptome. The enrichment of these three fractions was confirmed by hybridization to labeled probes from the 3′, 5′, and mid region of an ATP synthase cDNA (AT1G15700; Figure A2 in Appendix). All three fractions were then assayed for their m6A content in a GA context using the established TLC method (Zhong et al., 2008). When the mRNA was fractionated to 120 or 180 nt, the majority of the m6A was observed in the most 3′ fragments (m6A:A ratios of 3.5 and 4.7% respectively; Figures 5A,B). When mRNA was fragmented to 90 nt or less, this 3′ bias was no longer apparent, possibly due to the inefficient enrichment of the respective fractions. Thus, globally at least 85% of the m6A appears to be in the 3′ end of the transcripts. Using a PATMATCH (TAIR5) search for the GGACU expanded methylation consensus established in mammals, we identified a list of 1159 genes with at least one GGACU in the last 200 nt of their 3′ UTR. This list was compared to the list of differentially expressed genes from low methylation plants for overlaps. In total, 99 genes in the differentially expressed genes were identified (Figure 6; Table S6 in Supplementary Material). This is a significant enrichment (p < 0.01) of 3′ UTR GGACU containing messages and may indicate that the expanded GGACU consensus is also favored in plants. Many of the transcripts that change in abundance in the low methylation plants are likely to change as an indirect consequence of altered expression of other messages, rather than as a direct outcome of methylation deficiency in the transcripts themselves. Thus, an over-representation of 3′ UTR GGACU containing transcripts in the messages that change following reduced methylation, may be even more significant than our overlap search suggests.
Figure 5.
N6-methyl adenosine is enriched in the 3′ end of transcripts. Fragmented high purity mRNA was fractionated into 3′, middle + 5′ and 5′ regions and the m6A content was measured for each fraction using the published TLC based method. The positions of m6A, A and C are indicated in the left hand panel. The spot corresponding to m6A is enriched on the TLC carried out on the 3′ end, compared to the 5′ and 5′ + middle samples (A). (The example is from mRNA fragmented to 180 nt). The graph shows the distribution of m6A for three different fragmentation experiments (B). When the fragment size is 90 nt or less, m6A enrichment associated with polyadenylated fragments is no longer seen.
Figure 6.
Venn diagrams representing overlapping genes between the list of cDNAs with GGACU in the last 200 nt of the 3′ UTR and the differentially expressed genes in the low methylation plants. Ninety-nine Genes from the low methylation plants had at least one GGACU in the last 200 nt end of their 3′ UTR. Genes with no annotated 3′ UTR were not analyzed.
Discussion
The Arabidopsis MTA gene encodes a close homolog of the mammalian mRNA methyltransferase and is required for the synthesis of m6A in planta. Disruption of MTA by T-DNA insertion results in embryo arrest at the globular stage (Zhong et al., 2008), however wild type plants have mRNA methylation in all tissues, and in order to study the role of this methylation during normal growth and development alternative approaches have to be employed. We used the ABI3 promoter to drive embryonic-expression of an MTA cDNA in order to bypass the embryo-lethal effects of the homozygous mutation (Rhode et al., 1999; Despres et al., 2001). Using this method allowed us to recover mature plants homozygous for the disrupted MTA gene and avoided RNAi based approaches which might themselves have been affected by altered methylation levels. Strong gene expression under the control of ABI3 promoter is restricted to embryonic development, however, low level expression can occur during different quiescent states, depending on light conditions (Rhode et al., 1999). We achieved a 90–93% decrease in m6A levels in the mature plant leaf and floral tissues. The remaining small amount of m6A most probably results from the low level basal expression of the MTA cDNA from the ABI3 promoter. Indeed full knockout of MTA in mature tissues may well be lethal as is suggested by certain inducible RNAi constructs (not shown). It is also possible that some of this remaining low level of m6A may be a result of mRNA methylation being carried out by the related methylase AT4G09980. AT4G09980 is a member of the MT-A70 family sub-lineage B (Bujnicki et al., 2002) that is also found in most Eukaryotes. Homozygous knockout of this methylase in Arabidopsis also results in embryo lethality, however, a role in mRNA adenosine methylation for this sub family has yet to be demonstrated. It also remains a possibility that, in addition to its role in mRNA methylation, MTA may also have an as yet unidentified function that is required for normal gene expression in these tissues.
The phenotypic changes in the leaf and flower structures of the reduced methylation plants indicate a reduced apical dominance and suggest problems with organ definition. We also observed significant changes in trichome branching. Trichomes have been used as a model for cell shape and polarity control in plants, and the degree of branching may also be an indication of changed endoreduplication (Hülskamp et al., 1994). Endoreduplication is the first developmental step in trichome development after cell division ceases (Hülskamp et al., 1994). It was previously reported that overexpression of AtFIP37, the interacting partner of MTA (Zhong et al., 2008) increases trichome branching in Arabidopsis (Vespa et al., 2004) as a result of increased endoreduplication levels. The overlap of messages that change in the low methylation plants and with trichome-associated genes does not reveal any of the genes which are involved in the trichome branch determination processes, or in trichome cell differentiation. Though this is perhaps not surprising, as these cells would have contributed a very small proportion of the leaf RNA analyzed and these messages are likely expressed at a low level. Nevertheless, ATFIP37 is up-regulated in the low methylation plants, and this is consistent with the previous observation that overexpression of ATFIP37 causes increased branching (Vespa et al., 2004). Those trichome-associated messages which are also increased in the low methylation plants are mostly associated with stress related processes. Indeed, there was a general enrichment among the overexpressed genes for GO terms related to stress responses and responses to stimuli, both external and internal. It is not possible to determine if the overexpression of stress and stimuli response genes is a direct or indirect effect of the loss of methylation, as the plant morphology is so severely affected. However, there are parallels with yeast, where methylation of mRNA is induced by nutritional stress and subsequently leads to new developmental pathways (meiosis and sporulation).
The GO term analysis of the genes down regulated in the low m6A plants indicates an enrichment of genes associated with “phospholipid,” and nitrate biosynthesis, as well as with transport and localization. Since gene expression changes in a methylation deficient plant are likely to be a complex overlay of direct and indirect results of the lack of m6A in mRNA it is not realistic to pick single genes or a gene list as potential methylation candidates from this dataset. If the observed levels of m6A found in wild type plants is distributed evenly between transcripts, then more than 50% of all messages should be methylated (Zhong et al., 2008). Thus, it is likely that the phenotypes seen in the low methylation plants are a result of global changes in mRNA processing, transport, or translatability rather than the result of changes to just a few key transcripts.
The location of m6A within a transcript could give an indication of the possible role of the modification. Methylation has been found within the body of transcripts from Rous sarcoma virus, but this may not be representative of the modifications occurring in the endogenous messages of the host cell. In an in vitro assay a methylation competent cell extract was found to methylate a synthetic mouse dihydrofolate reductase transcript at three unmapped sites toward the 5′ end (Rana and Tuck, 1990). However, as similar extracts have been shown to be capable of efficiently methylating any RNA oligonucleotide containing a GGACU or AGACU consensus (Harper et al., 1990), such experiments may not reflect the true distribution of m6A within messages in vivo. Precise (Horowitz et al., 1984) or partial (Bodi et al., 2010) mapping of methylation in endogenous cellular transcripts has only been reported for two transcripts (bovine prolactin and yeast IME2 respectively). In bovine prolactin the methylation was located in the 3′ UTR (Horowitz et al., 1984), and in the yeast IME2 the m6A is located within the 3′ half of the message (Bodi et al., 2010).
Using a controlled alkali fragmentation approach followed by 3′ and 5′ fragment enrichment, we show a general preferential localization of m6A toward the 3′ end, of messages, probably within the last 100–150 nt before the poly(A) tail. We found an over-representation amongst the differentially expressed genes of the low methylation plants for transcripts containing a GGACU site within 200 nt before the end of their 3′ UTR. This may indicate that in plants as in mammals the extended RRACH methylation consensus is preferred and would support the preferential location for methylation that we observe. This enrichment could be even more significant as our gene set overlap search used sequences only which contained the extended consensus in the 3′ UTRs. Therefore genes without 3′ UTRs were not considered in the overlap search. We have previously suggested that in yeast the methylation in the 3′ half of the IME2 transcript may prevent the binding of Khd1 protein (Bodi et al., 2010), which is a translational suppressor, and is involved in message localization and asymmetric translation in yeast (Hasegawa et al., 2009). The global 3′ enrichment of m6A in an mRNA population is consistent with a similar general role in the regulation of translatability and localization.
Conflict of Interest Statement
The authors declare that the research was conducted in the absence of any commercial or financial relationships that could be construed as a potential conflict of interest.
Supplementary Material
The Supplementary Material for this article can be found online at http://www.frontiersin.org/plant_genetics_and_genomics/10.3389/fpls.2012.00048/abstract
Differentially expressed genes.
GO enrichment in upregulated gene set.
GO enrichment in down regulated gene set.
Differentially expressed genes in GO:0008173 RNA methyltransferase activity. Differentially expressed genes in GO:0016070 RNA metabolic process. Differentially expressed genes in GO:0010228 vegetative to reproductive phase transition. Differentially expressed genes in GO:0010073 meristem maintenance.
Differentially expressed genes also found in trichome specific (top 5%) gene list.
Differentially expressed genes with GGACU in the last 200 nt region of their 3′UTR.
Appendix
Figure A1.
Measuring levels of MTA in ABI3 promoter driven transgenic plants. Reverse transcription was carried out using SuperScript II reverse transcription kit (Invitrogen). Real-time PCR was carried out using the MX3005P qPCR machine and the Brilliant SYBR Green qPCR master mix (Stratagene). MAXPro software was used for data analysis. Primers used were, MTA primers: 5′-GGAACCTTTGGAGTTGTTATG-3′ and 5′-CAAAGCTCCAAACATTCACG-3′, and the β-actin2 (normalizer gene) primers: 5′-GTACAACCGGTATTGTGCT-3′ and 5′-ATCAGTAAGGTCACGTCCA-3′. Total RNA was isolated from young buds of three wild type plants, and three MTA homozygous T-DNA insertion lines complemented with the ABI3 promoter driven construct. The error bars are representing SD of three replicates.
Figure A2.
Quality control of fragmented mRNA. The poly(A) RNA used for the fragmentation experiments was purified using oligo(dT) at least three times, the quality of the mRNA was confirmed by RNA6000 LabChip (Agilent) (A). After fragmentation the average fragment size was confirmed by RNA6000 LabChip (Agilent) (B). A dot-blot was used for confirming that the fragments after fractionation were enriched in the predicted parts of the mRNA pool. Probes were made from the 5′, the middle and the 3′ regions of the ATPC mRNA and it was hybridized to membrane bound RNA pools of the different fractionated fragments (C).
Footnotes
References
- Adams J. M., Cory S. (1975). Modified nucleosides and bizzar 5′-termini in mouse myeloma messenger-RNA. Nature 255, 28–33 10.1038/255028a0 [DOI] [PubMed] [Google Scholar]
- Aloni Y., Dhar R., Khoury G. (1979). Methylation of nuclear simian virus-40 RNAs. J. Virol. 32, 52–60 [DOI] [PMC free article] [PubMed] [Google Scholar]
- Beemon K., Keith J. (1977). Localization of N6-methyladenosine in Rous-sarcoma virus genome. J. Mol. Biol. 113, 165–179 10.1016/0022-2836(77)90047-X [DOI] [PubMed] [Google Scholar]
- Benjamini Y., Hochberg Y. (1995). Controlling the false discovery rate: a practical and powerful approach to multiple testing. J. R. Stat. Soc. Ser. A 57, 289–300 [Google Scholar]
- Benjamini Y., Yekutieli D. (2001). The control of the false discovery rate in multiple testing under dependency. Ann. Statist. 29, 1165–1188 10.1214/aos/1013699998 [DOI] [Google Scholar]
- Bodi Z., Button J. D., Grierson D., Fray R. G. (2010). Yeast targets for mRNA methylation. Nucleic Acids Res. 38, 5327–5335 10.1093/nar/gkq266 [DOI] [PMC free article] [PubMed] [Google Scholar]
- Bokar J. A., Shambaugh M. E., Polayes D., Matera A. G., Rottman F. M. (1997). Purification and cDNA cloning of the AdoMet-binding subunit of the human mRNA (N6-adenosine)-methyltransferase. RNA 3, 1233–1247 [PMC free article] [PubMed] [Google Scholar]
- Bujnicki J. M., Feder M., Radlinska M., Blumenthal R. M. (2002). Structure prediction and phylogenetic analysis of a functionally diverse family of proteins homologous to the MT-A70 subunit of the human mRNA:m(6)A methyltransferase. J. Mol. Evol. 55, 431–444 10.1007/s00239-002-2339-8 [DOI] [PubMed] [Google Scholar]
- Chomczynski P., Sacchi N. (1987). Single-step method of RNA isolation by acid guanidinium thiocyanate phenol chloroform extraction. Anal. Biochem. 162, 156–159 10.1016/0003-2697(87)90021-2 [DOI] [PubMed] [Google Scholar]
- Clancy M. J., Shambaugh M. E., Timpte C. S., Bokar J. A. (2002). Induction of sporulation in Saccharomyces cerevisiae leads to the formation of N6-methyladenosine in mRNA: a potential mechanism for the activity of the IME4 gene. Nucleic Acids Res. 30, 4509–4518 10.1093/nar/gkf573 [DOI] [PMC free article] [PubMed] [Google Scholar]
- Csepany T., Lint A., Baldick C. J., Jr., Beemon K. (1990). Sequence specificity of mRNA N6-adenosine methyltransferase. J. Biol. Chem. 265, 20117–20122 [PubMed] [Google Scholar]
- Despres B., Delseny M., Devic M. (2001). Partial complementation of embryo defective mutations: a general strategy to elucidate gene function. Plant J. 27, 149–159 10.1046/j.1365-313x.2001.01078.x [DOI] [PubMed] [Google Scholar]
- Desrosiers R., Friderici K., Rottman F. (1974). Identification of methylated nucleosides in messenger RNA from Novikoff hepatoma cells. Proc. Natl. Acad. Sci. U.S.A. 71, 3971–3975 10.1073/pnas.71.10.3971 [DOI] [PMC free article] [PubMed] [Google Scholar]
- Harper J. E., Miceli S. M., Roberts R. J., Manley J. L. (1990). Sequence specificity of the human mRNA N6-adenosine methylase in vitro. Nucleic Acids Res. 18, 5735–5741 10.1093/nar/18.19.5735 [DOI] [PMC free article] [PubMed] [Google Scholar]
- Hasegawa Y., Irie K., Gerber A. P. (2009). Distinct roles for Khd1p in localization and expression of bud-localized mRNAs in yeast. RNA 14, 2333–2347 10.1261/rna.1016508 [DOI] [PMC free article] [PubMed] [Google Scholar]
- Haugland R. A., Cline M. G. (1980). Post-transcriptional modifications of oat coleoptile ribonucleic acids. 5′-Terminal capping and methylation of internal nucleosides in poly(A)-rich RNA. Eur. J. Biochem. 104, 271–277 10.1111/j.1432-1033.1980.tb04425.x [DOI] [PubMed] [Google Scholar]
- Hongay C. F., Orr-Weaver T. L. (2011). Drosophila inducer of Meiosis 4 (IME4) is required for Notch signalling during oogenesis. Proc. Natl. Acad. Sci. U.S.A. 108, 14855–14860 10.1073/pnas.1111577108 [DOI] [PMC free article] [PubMed] [Google Scholar]
- Horowitz S., Horowitz A., Nilsen T. W., Munns T. W., Rottman F. M. (1984). Mapping of N6-methyladenosine residues in bovine prolactin mRNA. Proc. Natl. Acad. Sci. U.S.A. 81, 5667–5671 10.1073/pnas.81.18.5667 [DOI] [PMC free article] [PubMed] [Google Scholar]
- Hülskamp M., Misera S., Jurgens G. (1994). Genetic dissection of trichome cell development in Arabidopsis. Cell 76, 555–566 10.1016/0092-8674(94)90118-X [DOI] [PubMed] [Google Scholar]
- Irizarry R. A., Hobbs B., Collin F., Beazer-Barclay Y. D., Antonellis K. J., Scherf U., Speed T. P. (2003). Exploration, normalization, and summaries of high density oligonucleotide array probe level data. Biostatistics 4, 249–264 10.1093/biostatistics/4.2.249 [DOI] [PubMed] [Google Scholar]
- Jakoby M. J., Falkenhan D., Mader M. T., Brininstool G., Wischnitzki E., Platz N., Hudson A., Hülskamp M., Larkin J., Schnittger A. (2008). Transcriptional profiling of mature Arabidopsis trichomes reveals that NOECK encodes the MIXTA-like transcriptional regulator MYB106. Plant Physiol. 148, 1583–1602 10.1104/pp.108.126979 [DOI] [PMC free article] [PubMed] [Google Scholar]
- Jia G., Fu Y., Zhao X., Dai Q., Zheng G., Yang Y., Yi C., Lindahl T., Pan T., Yang Y., He C. (2011). N6-methyladenosine in nuclear RNA is a major substrate of the obesity-associated FTO. Nat. Chem. Biol. 7, 885–887 10.1038/nchembio.687 [DOI] [PMC free article] [PubMed] [Google Scholar]
- Kane S. E., Beemon K. (1985). Precise localization of m6A in Rous sarcoma virus RNA reveals clustering of methylation sites: implications for RNA processing. Mol. Cell. Biol. 5, 2298–2306 [DOI] [PMC free article] [PubMed] [Google Scholar]
- Kennedy T. D., Lane B. G. (1979). Wheat embryo ribonucleates. XIII. Methyl-substituted nucleoside constituents and 5′-terminal dinucleotide sequences in bulk poly(AR)-rich RNA from imbibing wheat embryos. Can. J. Biochem. 57, 927–931 10.1139/o79-112 [DOI] [PubMed] [Google Scholar]
- Levis R., Penman S. (1978). 5′-Terminal structures of poly(A)+ cytoplasmic messenger RNA and of poly(A)+ and poly(A)– heterogeneous nuclear RNA of cells of the dipteran Drosophila melanogaster. J. Mol. Biol. 120, 487–515 10.1016/0022-2836(78)90350-9 [DOI] [PubMed] [Google Scholar]
- Nichols J. L. (1979). N6-methyladenosine in maize poly(A)-containing RNA. Plant Sci. Lett. 15, 357–361 10.1016/0304-4211(79)90141-X [DOI] [Google Scholar]
- Nichols J. L., Welder L. (1981). Nucleotides adjacent to N6-methyladenosine in maize poly(A)-containing RNA. Plant Sci. Lett. 21, 75–81 10.1016/0304-4211(81)90071-7 [DOI] [Google Scholar]
- Perry R. P., Kelley D. E., Friderici K., Rottman F. (1975). Methylated constituents of L cell messenger-RNA – evidence for an unusual cluster at 5′ terminus. Cell 4, 387–394 10.1016/0092-8674(75)90159-2 [DOI] [PubMed] [Google Scholar]
- Rana A. P., Tuck M. T. (1990). Analysis and in vitro localization of internal methylated adenine residues in dihydrofolate reductase mRNA. Nucleic Acids Res. 18, 4803–4808 10.1093/nar/18.16.4803 [DOI] [PMC free article] [PubMed] [Google Scholar]
- Rhode A., Van Montagu M., Boerjan W. (1999). The abscisic acid-insensitive gene ABI3 is expressed during vegetative quiescence processes in Arabidopsis. Plant Cell Environ. 22, 261–270 10.1046/j.1365-3040.1999.00428.x [DOI] [Google Scholar]
- Sambrook J., Russel D. W. (2001). Molecular Cloning: A Laboratory Manual. Cold Spring Harbor, NY: Cold Spring Harbor Laboratory Press, 7.13–7.17 [Google Scholar]
- Schibler U., Kelley D. E., Perry R. P. (1977). Comparison of methylated sequences in messenger RNA and heterogeneous nuclear RNA from mouse L cells. J. Mol. Biol. 115, 695–714 10.1016/0022-2836(77)90110-3 [DOI] [PubMed] [Google Scholar]
- Shimba S., Bokar J. A., Rottman F., Reddy R. (1995). Accurate and efficient N-6-adenosine methylation in spliceosomal U6 small nuclear RNA by HeLa cell extract in vitro. Nucleic Acids Res. 23, 2421–2426 10.1093/nar/23.13.2421 [DOI] [PMC free article] [PubMed] [Google Scholar]
- Tuck M. T., Wiehl P. E., Pan T. (1999). Inhibition of 6-methyladenine formation decreases the translation efficiency of dihydrofolate reductase transcripts. Int. J. Biochem. Cell Biol. 31, 837–851 10.1016/S1357-2725(99)00041-2 [DOI] [PubMed] [Google Scholar]
- Vespa L., Vachon G., Berger F., Perazza D., Faure J. D., Herzog M. (2004). The immunophilin-interacting protein AtFIP37 from Arabidopsis is essential for plant development and is involved in trichome endoreduplication. Plant Physiol. 134, 1283–1292 10.1104/pp.103.028050 [DOI] [PMC free article] [PubMed] [Google Scholar]
- Wei C. M., Gershowitz A., Moss B. (1976). 5′-Terminal and internal methylated nucleotide sequences in HeLa cell messenger-RNA. Biochemistry, 15, 397–401 10.1021/bi00647a024 [DOI] [PubMed] [Google Scholar]
- Zhong S., Li H., Bodi Z., Button J. D., Vespa L., Herzog M., Fray R. G. (2008). MTA is an Arabidopsis messenger RNA adenosine methylase and interacts with a homolog of a sex-specific splicing factor. Plant Cell 20, 1278–1288 10.1105/tpc.108.058883 [DOI] [PMC free article] [PubMed] [Google Scholar]
Associated Data
This section collects any data citations, data availability statements, or supplementary materials included in this article.
Supplementary Materials
Differentially expressed genes.
GO enrichment in upregulated gene set.
GO enrichment in down regulated gene set.
Differentially expressed genes in GO:0008173 RNA methyltransferase activity. Differentially expressed genes in GO:0016070 RNA metabolic process. Differentially expressed genes in GO:0010228 vegetative to reproductive phase transition. Differentially expressed genes in GO:0010073 meristem maintenance.
Differentially expressed genes also found in trichome specific (top 5%) gene list.
Differentially expressed genes with GGACU in the last 200 nt region of their 3′UTR.


