Abstract
Objective: Although it has been believed that brown adipose tissue (BAT) depots disappear shortly after the perinatal period in humans, positron emission tomography (PET) imaging using the glucose analog 18F-deoxy-d-glucose (FDG) has shown unequivocally the existence of functional BAT in humans, suggesting that most humans have some functional BAT. The objective of this study was to determine, using dynamic oxygen-15 (15O) PET imaging, to what extent BAT thermogenesis is activated in adults during cold stress and to establish the relationship between BAT oxidative metabolism and FDG tracer uptake. Methods: Fourteen adult normal subjects (9F/5M, 30 ± 7 years) underwent triple oxygen scans (H215O, C15O, 15O2) as well as indirect calorimetric measurements at both rest and following exposure to mild cold (16°C). Subjects were divided into two groups (BAT+ and BAT−) based on the presence or absence of FDG tracer uptake (SUV > 2) in cervical–supraclavicular BAT. Blood flow and oxygen extraction fraction (OEF) was calculated from dynamic PET scans at the location of BAT, muscle, and white adipose tissue (WAT). The metabolic rate of oxygen (MRO2) in BAT was determined and used to calculate the contribution of activated BAT to daily energy expenditure (DEE). Results: The median mass of activated BAT in the BAT+ group (5F, age 31 ± 8) was 52.4 g (range 14–68 g) and was 1.7 g (range 0–6.3 g) in the BAT − group (5M/4F, age 29 ± 6). Corresponding SUV values were significantly higher in the BAT+ as compared to the BAT− group (7.4 ± 3.7 vs. 1.9 ± 0.9; p = 0.03). Blood flow values in BAT were significantly higher in the BAT+ group as compared to the BAT− group (13.1 ± 4.4 vs. 5.7 ± 1.1 ml/100 g/min, p = 0.03), but were similar in WAT (4.1 ± 1.6 vs. 4.2 ± 1.8 ml/100 g/min) and muscle (3.7 ± 0.8 vs. 3.3 ± 1.2 ml/100 g/min). Moreover, OEF in BAT was similar in the two groups (0.56 ± 0.18 in BAT+ vs. 0.46 ± 0.19 in BAT−, p = 0.39). Calculated MRO2 values in BAT increased from 0.95 ± 0.74 to 1.62 ± 0.82 ml/100 g/min in the BAT+ group and were significantly higher than those determined in the BAT− group (0.43 ± 0.27 vs. 0.56 ± 0.24, p = 0.67). The DEE associated with BAT oxidative metabolism was highly variable in the BAT+ group, with an average of 5.5 ± 6.4 kcal/day (range 0.57–15.3 kcal/day). Conclusion: BAT thermogenesis in humans accounts for less than 20 kcal/day during moderate cold stress, even in subjects with relatively large BAT depots. Furthermore, due to the large differences in blood flow and glucose metabolic rates in BAT between humans and rodents, the application of rodent data to humans is problematic and needs careful evaluation.
Keywords: brown fat thermogenesis, oxidative metabolism, 15O PET imaging
Introduction
Brown adipose tissue (BAT or brown fat) is a thermogenic organ that plays a critical role in non-shivering thermogenesis (Foster and Frydman, 1979; Nedergaard et al., 2001). Most mammals, including humans, have abundant BAT during the perinatal period (Dawkins and Scopes, 1965; Blaza, 1983); however, prominent depots disappear shortly after the perinatal period in several species, and it has been widely assumed the same was true for humans. Nevertheless, several investigations have found convincing histological evidence of BAT in postmortem adults (Kortelainen et al., 1993). Recently, numerous papers have appeared in the positron emission tomography (PET) literature identifying symmetric foci of intense uptake of 18F-deoxy-d-glucose (FDG) uptake in humans, and correlative CT clearly indicates that these sites are adipose tissue. Indeed, a very recent series of papers has unequivocally demonstrated the existence of functional BAT in humans, suggesting that most, if not all, humans have some functional BAT (Cohade et al., 2003; Cypess et al., 2009; Lichtenbelt et al., 2009; Virtanen et al., 2009).
It is clear that beta-adrenergic agonists increase fat oxidation and thermogenesis in humans and that activation of BAT in humans (as assessed by FDG uptake) is sensitive to adrenergic activation. However, it is not known whether, and to what extent, the increase in FDG uptake in fact represents an increase in thermogenesis. Indeed, work in rodents has indicated that glucose contributes little to BAT thermogenesis and that most glucose that is taken up in BAT during activation is not oxidized (Ma and Foster, 1986). Therefore, it is critical to directly establish the relationship between BAT oxidative metabolism and FDG uptake, which is a widely used, but indirect and ambiguous measure (Ma and Foster, 1986; Nedergaard et al., 2007). In addition, it is important to determine the quantitative contribution of BAT thermogenesis to total energy expenditure in both resting state and during physiological activation by cold stress in order to judge the potential of BAT thermogenesis in contributing to weight loss in obese patients. Thus, the objective of this study was to determine, using dynamic oxygen-15 (15O) PET imaging, to what extent BAT thermogenesis can be activated in adults during cold stress and to establish the relationship between BAT oxidative metabolism and FDG uptake.
Materials and Methods
Subjects
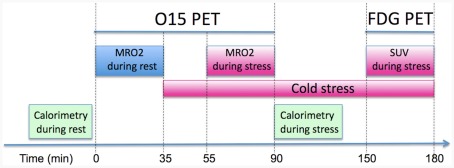
A total of 14 adult normal subjects (9F/5M, 30 ± 7 years) were studied following approval by the Institutional Review Board (IRB) of Wayne State University. The BMI of this study group was 23.7 ± 2.8 (range 19.1–27.4). All subjects underwent triple oxygen scans (H215O, C15O, 15O2) at rest and following exposure to mild cold (16°C; see Figure 1) following a 6-h fasting period. To induce cold stress, subjects rested in the PET scanner room in minimal clothing 20 min prior to the 15O stress scans and during the entire FDG uptake period. The room was held at a temperature of 16°C and fans were used to provide low-level airflow. All subjects reported experiencing cold stress, however, overt shivering was not reported or observed.
Figure 1.
Positron emission tomography protocol used to quantify the metabolic rate of oxygen (MRO2) in BAT at rest and stress (i.e., mild cold exposure at 16°C). Following the quantitative assessment of oxidative metabolism the patient underwent a FDG PET/CT scan in order to correlate MRO2 with FDG derived SUV measures.
PET data acquisition
All subjects were scanned on an EXACT HR PET scanner in 2D mode in order to decrease contribution of scatter from outside of the field-of-view (FOV). The EXACT HR scanner (Siemens, Knoxville, TN, USA) generates 47 image planes with a slice thickness of 3.2 mm and an isotropic spatial resolution of 8 mm FWHM for 15O studies. Initially, two venous catheters were established for tracer injection and venous blood sampling. Subsequently, a 10-min indirect calorimetric measurement was performed to obtain baseline total energy expenditure using a MedGraphics VO2000 Portable Metabolic Testing System (St. Paul, MN, USA). The instrument was calibrated against a known gas mixture prior to each experimental day, and auto-calibrated between experimental runs. During the entire baseline protocol, patients were wrapped in warm blankets and rested comfortably either inside the PET gantry or in an armchair in the scanner room. Subjects were positioned inside the PET scanner with the neck/shoulder region in the FOV and a 15-min transmission scan was performed to correct for photon attenuation. Subsequently, subjects inhaled 15O labeled oxygen (80 mCi) through a disposable plastic facemask for 5 s (1–2 deep breaths) which coincided with the start of a 2-min dynamic emission scan (60 × 2 s). Two venous blood samples (0.4 ml) were obtained at the end of the dynamic scan for determination of blood hematocrit. In addition, arterial oxygen saturation was monitored during the whole dynamic scan using a Dinamap ProCare 400 monitor (GE, Milwaukee, WI, USA). Following a 12-min period to allow for tracer decay, the subjects then inhaled 15O labeled CO gas (50 mCi) in one to two short breaths and after a 2-min equilibration phase, a 3-min static PET scan was initiated. Six venous blood samples (0.4 ml) were taken during the static scan to measure whole-blood radioactivity during the scanning period. Finally, 15O water (80 mCi) was injected as a slow bolus over 45 s and a 2-min dynamic PET scan was obtained (60 × 2 s). Again, two venous blood samples (0.4 ml) were obtained at the end of the dynamic scan and arterial oxygen saturation was monitored during the dynamic sequence as before. These three scans were then repeated during cold stress, which was induced by removing all blankets from the patient and letting the subjects rest in the PET scanner in minimal clothing exposed to a temperature of 16°C. Following a 20-min transition period to reach stable systemic oxygen consumption, the three 15O PET scans (O2, CO, and H2O) were repeated. At the conclusion of the oxygen PET scans (about 60 min after the beginning of cold exposure), another 10 min indirect calorimetric measurement was performed in order to obtain cold stress oxygen consumption. The FDG tracer (5 mCi) was then injected and the subject remained exposed to 16°C temperature during a 50-min uptake period. At the conclusion of the uptake period a 10-min static FDG scan was acquired at the same position as the oxygen scans. Finally, the subject was transported to the nearby PET/CT suite and a whole body PET/CT scan was obtained in order to verify the presence of BAT in adipose tissue and to calculate the BAT volume. The GE Discovery STE PET/CT scanner (GE Medical Systems, Milwaukee, WI, USA) combines a Light-Speed 16-slice CT with an advanced BGO PET system. CT images (acquisition parameters 100 keV, 80 mA) were acquired with an in-plane spatial resolution of ∼1 mm and a reconstructed slice thickness of 3.3 mm. The total dose to the subjects from all acquisitions was 21 mSv (2.1 rem).
Image data processing and analysis
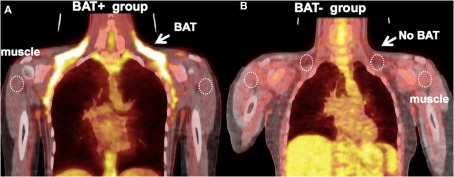
Regions of interest (ROIs) were defined in PET/CT images at the location of BAT, white adipose tissue (WAT), and muscle and subsequently transferred to the dynamic 15O scans. BAT was considered present if there were areas of tissue that were more than 5 mm in diameter, had the CT density of adipose tissue (-250 to -50 HU), and had a maximal SUV of FDG of at least 2.0. This cutoff represented more than 2 SD above the maximal SUV seen in typical depots of WAT. BAT volume was determined by thresholding both the CT image volume (−250 < HU < −50) and the FDG volume (SUV > 2.0) and then applying the logical AND operation to the two masks, followed by removal of all areas that were smaller than 0.125 cm3. The final BAT ROI was chosen at the location of the largest contiguous group of voxels that survived the masking operation. These regions most frequently represented the cervical, supraclavicular, and superior mediastinal depots, superficial and lateral to the sternocleidomastoid muscles (see Figure 2). The volume of BAT ROIs (cm3) was converted into weight (g) by assuming a density of 0.90 g/cm3. Moreover, WAT ROIs were defined manually on two to three adjacent planes at the location of subcutaneous neck fat as well as muscle ROIs at the location of the shoulder/deltoid area.
Figure 2.
(A) Representative image of a subject with high uptake of FDG in BAT. Five out of 14 subjects had high FDG uptake (BAT+ group, mean ± SD: SUV = 3.6 ± 0.5). ROIs were defined at the location of FDG-defined BAT, abdominal WAT (not shown), and shoulder muscle, which were then transferred to the dynamic 15O sequences for quantification. (B) Representative image of a subject from the BAT− group – there is an absence of FDG uptake at the location of BAT following exposure to cold (SUV ∼0.6).
Dynamic quantitative PET imaging has been established as gold standard for the in vivo determination of metabolic rate of oxygen (MRO2) in the brain (Frackowiak et al., 1980; Mintun et al., 1984) and skeletal muscle (Ruotsalainen et al., 1997; Kalliokoski et al., 2000). The measurement involves the combined use of 15O-labeled water, carbon monoxide, and molecular oxygen gas to measure the blood flow (F), blood volume (BV), and oxygen extraction fraction (OEF). Data are analyzed based on a three-compartment model that accounts for intravascular 15O hemoglobin and 15O water from systemic and tissue metabolism. The accuracy of this method for the measurement of oxygen OEF in brain tissue has been validated under physiological and pathological conditions over a range of OEF values from 0.05 to 0.80 (Mintun et al., 1984; Hattori et al., 2004). The arterial input function can be derived either from arterial sampling or, in case that the aortic arch is in the FOV of the PET scanner, from a small region at the location of the aorta. The metabolic rate of oxygen (MRO2; ml/100 g/min) in the tissues of interest is then calculated as the product of blood flow (F; ml/100 g/min), OEF (unitless), and the arterial oxygen concentration (cO2; mlO2/100 ml), which is derived from the patient’s arterial oxygen saturation (pSat%) and hematocrit (HCT) according to the equation
where pO2 was calculated from the measured pSat according to D:Severinghaus:1977] formula and the exact inversion by Ellis (1989). Finally, the daily energy expenditure (DEE; kcal/day) was calculated from the obtained MRO2 and the weight of BAT according to the formula
Where the conversion factor between kilocalorie and milliliter O2 was assumed for a respiratory quotient of 0.80 (Leonard, 2010).
Statistical analysis
Data are reported as mean ± SD and all analysis was performed with the use of the SPSS software version 19. FDG uptake in BAT following cold exposure was highly variable, with a few subjects showing extensive uptake in the cervical–supraclavicular depots, whereas most subjects displayed either no BAT, or only small pockets of activated BAT (Figure 2). To account for this skewed distribution, subjects were divided into two groups (BAT+, BAT−), with the threshold being set to 10 g of activated BAT. Normally distributed continuous variables were compared between the two groups using an independent sample t-test and non-normally distributed continuous variables using the Mann–Whitney U-test. Finally, correlation between variables were assessed using Pearson’s r. All reported p-values are two-tailed and values less than 0.05 were considered to indicate statistical significance.
Results
FDG uptake in BAT
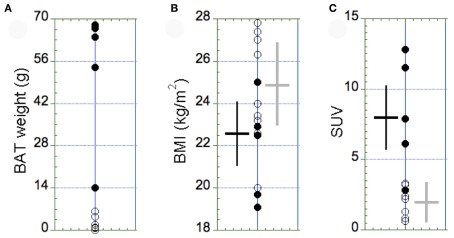
The amount of detectable BAT in cervical–supraclavicular depots showed a highly skewed distribution (Figure 3A). In the BAT+ group (age 31 ± 8), the median mass of activated BAT was 52.4 g (range 14–68 g) and was found to be 1.7 g (range 0–6.3 g) in the BAT− group (age 29 ± 6). The BAT+ group consisted exclusively of women (5F, 0M), whereas the BAT− group was dominated by men (5M, 4F), a result suggesting that women have a greater capacity to increase the mass and activity of their BAT. There was no significant difference in BMI between the BAT+ and BAT− groups (22.4 ± 2.3 vs. 24.9 ± 3.8, p = 0.38, Figure 3B). In accordance to the experimental design, corresponding SUV values were found to be significantly higher in the BAT+ group as compared to the BAT− group (7.4 ± 3.7 vs. 1.9 ± 0.9; p = 0.03, Figure 3C).
Figure 3.
Distribution of the amount of BAT (A), the BMI (B), and the maximal SUV in BAT (C) in the BAT+ group (full circles, N = 5) and in the BAT− group (open circles, N = 9). (A) The amount of BAT was highly variable, with most of the subjects displaying <10 g of active BAT in small supraclavicular depots. Accordingly, subjects with >10 g of active BAT were assigned to the BAT+ group. (B) The BMI was similar between the two groups (p = 0.38). (C) In contrast, the maximal SUV in BAT observed in the BAT+ group was significantly higher than in the BAT− group (p = 0.03). The error bars in (B,C) represent SD of the measurements.
Indirect calorimetry
Due to the fact that the BAT− group was dominated by males (5M, 4F), resting DEE in the BAT− group was higher than in the BAT+ group, which was comprised from females only (1776 vs. 1436 kcal/day). However, after males were removed from the BAT− group, the resting DEE was similar in the two study groups (1453 vs. 1436 kcal/day). As expected from previous work (Orava et al., 2011; Yoneshiro et al., 2011), individuals with and without detectible BAT responded differently to mild cold exposure. Each subject in the BAT+ group increased DEE by an average of 24 ± 11% (range: 238–492 kcal/day, p < 0.01). In contrast, the metabolic response of individuals lacking detectible BAT varied considerably (range: −311 to 345 kcal/day), and overall, cold stress failed to significantly increase DEE in this group (3 ± 19%). Finally, the respiratory quotient was similar between the two groups (0.83 ± 0.06 in the BAT+ group and 0.91 ± 0.09 in the BAT− group; p = 0.15) and was not significantly affected by cold stress.
Blood flow in BAT, WAT, and muscle
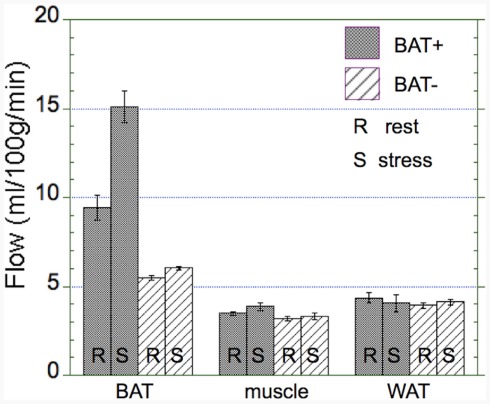
Absolute blood flow values were significantly higher in the BAT+ group as compared to the BAT− group only in BAT regions (13.1 ± 4.2 vs. 5.7 ± 1.1 ml/100 g/min, p = 0.04), but were similar in WAT (4.1 ± 1.6 vs. 4.2 ± 1.8 ml/100 g/min) and muscle (3.7 ± 0.8 vs. 3.3 ± 1.2 ml/100 g/min) regions (Figure 4). Moreover, in the BAT+ group the percent change in blood flow during cold exposure showed a large increase (44 ± 8%) in BAT regions, but remained on average almost unchanged in the BAT− group (5 ± 21%). Smaller increases in blood flow were determined in muscle regions for both groups (11 ± 25% in BAT+ and 8 ± 28% in BAT−), whereas blood flow changes in WAT were mixed. Blood flow in WAT regions decreased in the BAT+ group (−8 ± 15%), whereas these values increased in the BAT− group (13 ± 25%).
Figure 4.
Absolute changes in blood flow in the BAT+ and BAT− groups. Absolute blood flow (ml/100 g/min) in brow adipose tissue (BAT), muscle, and white adipose tissue (WAT) averaged during both rest (R) and cold exposure (S). Error bars represent the SEM. Blood flow in activated BAT is about 50% higher than in non-activated BAT and about threefold higher than in muscle and WAT (3–5 ml/100 g/min). Whereas there was a large increase in blood flow in activated BAT, virtually no increase in blood flow was determined in non-activated BAT, muscle, or WAT.
OEF and MRO2 in BAT, WAT, and muscle
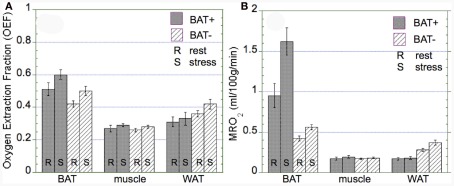
The OEF was found to be similar in both groups (BAT+, BAT−) in BAT, muscle, and WAT regions (Figure 5A). Specifically, overall BAT OEF was determined as 0.56 ± 0.18 in the BAT+ group and 0.46 ± 0.19 in the BAT− group (p = 0.39). Similarly, OEF values in muscle were 0.29 ± 0.08 and 0.28 ± 0.09 in the BAT+ and BAT− groups (p = 0.63), and were slightly higher in WAT regions (0.32 ± 0.15 vs. 0.39 ± 0.21, p = 0.21). Calculated MRO2 values in BAT based on corresponding blood flow and OEF values were found to be highest in the BAT+ group during both rest and cold exposure (Figure 5B). MRO2 estimates increased from a mean resting value of 0.95 ± 0.74 ml/100 g/min to a mean value of 1.62 ± 0.82 ml/100 g/min during cold exposure. These MRO2 values in BAT were significantly higher than those determined in the BAT− group (0.43 ± 0.27 at rest and 0.56 ± 0.24 during cold exposure, respectively). In comparison, MRO2 estimates in muscle tissue were found to be similar during rest and cold exposure in both groups (∼0.18 ± 0.09 ml/100 g/min). Finally, MRO2 values in WAT were significantly lower in the BAT+ group as compared to the BAT− group at both rest (0.17 ± 0.07 vs. 0.28 ± 0.18 ml/100 g/min) and exposure to cold (0.18 ± 0.09 vs. 0.38 ± 0.26 ml/100 g/min) condition (Figure 5B).
Figure 5.
Oxygen extraction fraction (OEF) and absolute metabolic rate of oxygen (MRO2) in brown adipose tissue (BAT), muscle, and white adipose tissue (WAT) observed in the BAT+ and BAT− groups. Error bars represent the SEM. (A) The OEF was similar in both groups in BAT, muscle, and WAT, although OEF in WAT was tended to be lower in the BAT+ group. (B) In the BAT+ group, MRO2 in BAT at rest was about twice as high as that determined in the BAT− group. Moreover, following cold exposure, MRO2 increased by about 50% in the BAT+ group, but remained at the same level in the BAT− group. In contrast, MRO2 in WAT was higher in the BAT− group at both rest and cold exposure condition. Finally, MRO2 in muscle was similar for both groups at rest and following cold exposure.
Energy consumption of BAT
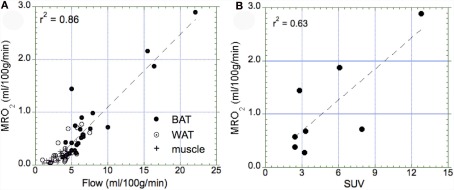
Our data showed a significant correlation between blood flow and the MRO2 (r2 = 0.86, p = 0.01, Figure 6A), suggesting that oxidative metabolism is the main determinant of BAT perfusion. Moreover, we also found a significant relationship between the semi-quantitative assessment of glucose uptake in BAT (SUV) and metabolic rate of glucose (r2 = 0.63, p = 0.02, Figure 6B). Based on the calculated MRO2 values, the DEE associated with BAT oxidative metabolism was highly variable in the BAT+ group, with an average of 5.5 ± 6.4 kcal/day (range 0.57–15.3 kcal/day). This value was significantly higher than that in the BAT− group, which was determined as only 0.14 + 0.12 kcal/day (range 0–0.38 kcal/day).
Figure 6.
Relationship between the metabolic rate of oxygen and blood flow as well as the maximal standard uptake value (SUV). (A) Correlation between the metabolic rate of oxygen in BAT (full circle), WAT (open circle), and muscle (cross) tissue. We determined a highly significant correlation (p = 0.01), indicating that tissue perfusion is the main determinant of oxidative metabolism in all three types of tissue. Highest values of oxidative metabolism was determined in activated BAT tissue (1–3 ml/100 g/min), followed by WAT tissue (0.2–0.5 ml/100 g/min), and muscle tissue (∼0.2 ml/100 g/min). (B) Correlation between maximal SUV in BAT and the metabolic rate of oxygen in those subjects who had a SUV > 2.0 (indicative of activated BAT). We found a significant correlation between glucose uptake and oxygen consumption (p = 0.02).
Discussion
Recent work has clearly established the presence of symmetric adipose depots in the cervical and supraclavicular region of humans which, in a subset of individuals, can be induced to greatly increase FDG tracer uptake in response to cold stress. These depots contain UCP1 positive multilocular adipocytes, and the fat cells within these depots express genes that are known to be enriched in brown adipocytes. In rodent models, cold-induced glucose uptake is correlated with a much larger increase in fatty acid-induced thermogenesis (Ma and Foster, 1986), suggesting that the FDG tracer uptake observed in humans might represent significant cold-induced heat production. Indeed, it has been estimated that 50 g of human BAT having the thermogenic activity of cold-adapted rodent BAT, might expend as much as 20% of daily energy intake (Rothwell and Stock, 1983), and thus might be a rational target for anti-obesity therapeutics. Despite these intriguing and potentially promising results, no experiments have directly evaluated oxidative metabolism in human BAT, or its relation to FDG tracer uptake and total energy expenditure.
Our results confirm recent experiments examining cold-induced FDG uptake in human BAT. This study demonstrates that mild cold exposure leads to high FDG tracer uptake in BAT in about a third of young adult subjects, whereas about half of a group of young subjects shows no FDG tracer uptake, with the rest displaying low-level FDG tracer uptake in scattered supraclavicular BAT depots. Similar to previous reports (Cypess et al., 2009), we found higher mass and activity of BAT in females than in males, with a ratio of ∼3:1. Our study group consisted entirely of young adults, so no relationship between BAT activation and age or BMI was observed. Baseline blood flow in BAT of subjects with high FDG tracer uptake was about twice that of subjects with low FDG uptake (10 vs. 5 ml/100 g/min) and increases by about 50% during cold stress (to ∼15 ml/100 g/min). These values are nearly identical to those recently published by Orava et al. (2011). Moreover, semi-quantitative assessment of glucose metabolism in BAT based on FDG SUVs showed a significant correlation with the calculated MRO2, suggesting that at least part of the glucose transported into adipose tissue might undergo oxidative metabolism. However, direct measurement of oxidative metabolism indicates that human BAT activation contributes little to total energy expenditure, despite the observed (significantly larger than background) FDG tracer uptake in BAT. Tissue oxygen MRO2 (consumption) is the product of blood flow and OEF. Moreover, the cold-induced increase in human BAT blood flow observed in the present study corresponds closely to that recently reported by Orava et al. (2011). Our data also includes estimates of OEF, allowing estimation of tissue MRO2 in the range of 1–3 ml/100 g/min during cold stress, which translates into an energy consumption in activated BAT of less than 20 kcal/day. Even if one assumes 100% OEF, blood flow data from both labs indicate that acutely activated human BAT contributes very little to cold-induced energy expenditure. In light of this data it is unclear whether the glucose that is transported into human BAT during cold stress is stored, oxidized, or released as lactate. Regardless, the energy content of the glucose that is taken up is small and is consistent with low overall contribution of human BAT to total energy expenditure. Intriguingly, a significant cold-induced increase in whole body energy expenditure (average of ∼300 kcal/day) was only observed in subjects demonstrating cold-activated BAT. Nonetheless, our quantitative data indicate that other, systemic effects are the likely cause of increased energy expenditure, and that the elevated FDG uptake in BAT is an epiphenomenon.
Speculation regarding the functional importance of human BAT has often invoked comparisons with rodent models of BAT function. In this regard, the classic experiments by Foster and Frydman (1978, 1979) demonstrated that cold exposure increases BAT blood flow by a factor of 10- to 20-fold, achieving a maximal rate of more than 1000 ml/100 g/min. This rate is 100 times greater than that observed in humans. Similarly, maximal glucose uptake rates in rodent BAT is at least 10-fold greater than that observed in human BAT. As mentioned above, glucose is a minor energy source for rodent thermogenesis. In the case of human BAT, the energy content of the cold-induced glucose uptake reported by Orava et al. 2011) amounts to less than 10 kcal/day, if fully oxidized.
Conclusion and Perspectives
Our results indicate that BAT thermogenesis in humans accounts for less than 20 kcal/day during moderate cold stress, even in subjects with relatively large BAT depots. Indeed, oxidative metabolism of the imaged BAT depots accounted for less than 2% of the total increase in energy expenditure observed during cold stress in BAT+ subjects. With regard to the potential impact of BAT activation on DEE, we note that moderate physical exercise (∼10 kcal/min) is far more effective than BAT in triggering controlled energy expenditure. The reasons for the relatively small contribution of human BAT, when present, to total thermogenesis is not known. The available histological data indicates that human BAT depots contain a mixture of multilocular brown adipocytes interspersed within a greater volume of unilocular white adipocytes, which have much lower metabolic activity. PET imaging does not have sufficient resolution to localize microscopic patches of brown adipocytes, and thus provides an average metabolic activity of a mixed cell population within the anatomically defined depot. Thus, the low average activity of human BAT depots may reflect the relatively low density of brown adipocytes. If the thermogenic potential of individual brown adipocytes is similar in humans and rodents, then the abundance of these cells would need to be increased greatly to impact DEE.
Positron emission tomography /CT imaging using the glucose analog FDG has entered clinical routine and although the use of radioactive tracers represents more than minimal risk, the effective dose to participants (in the range of 1–2 rem) is not prohibitive for carefully planned studies. Moreover, because of concerns that some active BAT might not accumulate FDG for unknown reasons, there is a need for other PET tracers that might allow better insight into the mechanisms of BAT activation. In the presented study we directly quantified oxidative metabolism in BAT depots based on independent measurements of both blood flow and oxygen extraction. As any increase in tissue metabolic activity will be necessarily accompanied by increased blood flow and oxygen consumption, we are confident that we were able to accurately assess metabolic activity of BAT, even if FDG accumulation might not have been present. Unfortunately, the applicability of PET imaging using isotopes with short half-life (such as 15O with 2 min) is hindered by the expensive methodology, which requires both an on-site cyclotron as well as sophisticated radio-synthesis modules. As a result, PET studies using short-lived isotopes are likely to be performed only in University research settings, but are ideally suited to study human BAT under various experimental conditions.
Conflict of Interest Statement
The authors declare that the research was conducted in the absence of any commercial or financial relationships that could be construed as a potential conflict of interest.
Acknowledgments
This study was supported by a grant from the NIDDK (R21DK090598-01). We would like to express our gratitude to Drs. Greg Gaehle, PhD, and Tom Videen, PhD, from the Radiology Department at Washington University in St. Louis for helpful advice with 15O radiochemistry as well as many fruitful discussions regarding PET modeling. Moreover, we thank Dr. Majid Khalaf, MD, for help with all clinical aspects of this study. Finally, we would like to thank Dr. William Leonard, PhD, for advice with respect to calorimetric measurements and for providing valuable insight about human energy expenditure.
References
- Blaza S. (1983). Brown adipose tissue in man: a review. J. R. Soc. Med. 76, 213–216 [DOI] [PMC free article] [PubMed] [Google Scholar]
- Cohade C., Osman M., Leal J., Wahl R. L. (2003). Direct comparison of (18)F-FDG PET and PET/CT in patients with colorectal carcinoma. J. Nucl. Med. 44, 1789–1796 [PubMed] [Google Scholar]
- Cypess A. M., Lehman S., Williams G., Tal I., Rodman D., Goldfine A. B., Kuo F. C., Palmer E. L., Tseng Y. H., Doria A., Kolodny G. M., Kahn C. R. (2009). Identification and importance of brown adipose tissue in adult humans. N. Engl. J. Med. 360, 1509–1517 10.1056/NEJMoa0810780 [DOI] [PMC free article] [PubMed] [Google Scholar]
- Dawkins M. J., Scopes J. W. (1965). Non-shivering thermogenesis and brown adipose tissue in the human new-born infant. Nature 206, 201–202 10.1038/206201a0 [DOI] [PubMed] [Google Scholar]
- Ellis R. K. (1989). Determination of PO2 from saturation. J. Appl. Physiol. 67, 902. [DOI] [PubMed] [Google Scholar]
- Foster D. O., Frydman M. L. (1978). Nonshivering thermogenesis in the rat. II. Measurements of blood flow with microspheres point to brown adipose tissue as the dominant site of the calorigenesis induced by noradrenaline. Can J. Physiol. Pharmacol. 56, 110–122 10.1139/y78-014 [DOI] [PubMed] [Google Scholar]
- Foster D. O., Frydman M. L. (1979). Tissue distribution of cold-induced thermogenesis in conscious warm- or cold-acclimated rats reevaluated from changes in tissue blood flow: the dominant role of brown adipose tissue in the replacement of shivering by nonshivering thermogenesis. Can. J. Physiol. Pharmacol. 57, 257–270 10.1139/y79-039 [DOI] [PubMed] [Google Scholar]
- Frackowiak R. S., Lenzi G. L., Jones T., Heather J. D. (1980). Quantitative measurement of regional cerebral blood flow and oxygen metabolism in man using 15O and positron emission tomography: theory, procedure, and normal values. J. Comput. Assist. Tomogr. 4, 727–736 10.1097/00004728-198012000-00001 [DOI] [PubMed] [Google Scholar]
- Hattori N., Bergsneider M., Wu H. M., Glenn T. C., Vespa P. M., Hovda D. A., Phelps M. E., Huang S. C. (2004). Accuracy of a method using short inhalation of (15)O-O(2) for measuring cerebral oxygen extraction fraction with PET in healthy humans. J. Nucl. Med. 45, 765–770 [PubMed] [Google Scholar]
- Kalliokoski K. K., Kemppainen J., Larmola K., Takala T. O., Peltoniemi P., Oksanen A., Ruotsalainen U., Cobelli C., Knuuti J., Nuutila P. (2000). Muscle blood flow and flow heterogeneity during exercise studied with positron emission tomography in humans. Eur. J. Appl. Physiol. 83, 395–401 10.1007/s004210000267 [DOI] [PubMed] [Google Scholar]
- Kortelainen M. L., Pelletier G., Ricquier D., Bukowiecki L. J. (1993). Immunohistochemical detection of human brown adipose tissue uncoupling protein in an autopsy series. J. Histochem. Cytochem. 41, 759–764 10.1177/41.5.8468458 [DOI] [PubMed] [Google Scholar]
- Leonard W. R. (2010). Measuring human energy expenditure and metabolic function: basic principles and methods. J. Anthropol. Sci. 88, 221–230 [PubMed] [Google Scholar]
- Lichtenbelt W. D., Vanhommerig J. W., Smulders N. M., Drossaerts J. M., Kemerink G. J., Bouvy N. D., Schrauwen P., Teule G. J. (2009). Cold-activated brown adipose tissue in healthy men. N. Engl. J. Med. 360, 1500–1508 10.1056/NEJMoa0808718 [DOI] [PubMed] [Google Scholar]
- Ma S. W., Foster D. O. (1986). Uptake of glucose and release of fatty acids and glycerol by rat brown adipose tissue in vivo. Can. J. Physiol. Pharmacol. 64, 609–614 10.1139/y86-101 [DOI] [PubMed] [Google Scholar]
- Mintun M. A., Raichle M. E., Martin W. R., Herscovitch P. (1984). Brain oxygen utilization measured with O-15 radiotracers and positron emission tomography. J. Nucl. Med. 25, 177–187 [PubMed] [Google Scholar]
- Nedergaard J., Bengtsson T., Cannon B. (2007). Unexpected evidence for active brown adipose tissue in adult humans. Am. J. Physiol. Endocrinol. Metab. 293, E444–E452 10.1152/ajpendo.00691.2006 [DOI] [PubMed] [Google Scholar]
- Nedergaard J., Golozoubova V., Matthias A., Asadi A., Jacobsson A., Cannon B. (2001). UCP1: the only protein able to mediate adaptive non-shivering thermogenesis and metabolic inefficiency. Biochim. Biophys. Acta 1504, 82–106 10.1016/S0005-2728(00)00247-4 [DOI] [PubMed] [Google Scholar]
- Orava J., Nuutila P., Lidell M. E., Oikonen V., Noponen T., Viljanen T., Scheinin M., Taittonen M., Niemi T., Enerbäck S., Virtanen K. A. (2011). Different metabolic responses of human brown adipose tissue to activation by cold and insulin. Cell Metab. 14, 272–279 10.1016/j.cmet.2011.06.012 [DOI] [PubMed] [Google Scholar]
- Rothwell N. J., Stock M. J. (1983). Luxusconsumption, diet-induced thermogenesis and brown fat: the case in favour. Clin. Sci. (Lond.) 64, 19–23 [DOI] [PubMed] [Google Scholar]
- Ruotsalainen U., Raitakari M., Nuutila P., Oikonen V., Sipilä H., Teräs M., Knuuti M. J., Bloomfield P. M., Iida H. (1997). Quantitative blood flow measurement of skeletal muscle using oxygen-15-water and PET. J. Nucl. Med. 38, 314–319 [PubMed] [Google Scholar]
- Severinghaus J. W. (1977). Pulmonary vascular function. Am. Rev. Respir. Dis. 115, 149–158 [DOI] [PubMed] [Google Scholar]
- Virtanen K. A., Lidell M. E., Orava J., Heglind M., Westergren R., Niemi T., Taittonen M., Laine J., Savisto N. J., Enerbäck S., Nuutila P. (2009). Functional brown adipose tissue in healthy adults. N. Engl. J. Med. 360, 1553–1556 10.1056/NEJMoa0808949 [DOI] [PubMed] [Google Scholar]
- Yoneshiro T., Aita S., Matsushita M., Kameya T., Nakada K., Kawai Y., Saito M. (2011). Brown adipose tissue, whole-body energy expenditure, and thermogenesis in healthy adult men. Obesity 19, 13–16 10.1038/oby.2010.105 [DOI] [PubMed] [Google Scholar]


