Abstract
A novel formulation containing polyvinylpyrrolidone (PVP) K30-coated norcantharidin (NCTD) chitosan nanoparticles (PVP–NCTD–NPs) was prepared by ionic gelation between chitosan and sodium tripolyphosphate. The average particle size of the PVP–NCTD–NPs produced was 140.03 ± 6.23 nm; entrapment efficiency was 56.33% ± 1.41%; and drug-loading efficiency was 8.38% ± 0.56%. The surface morphology of NCTD nanoparticles (NPs) coated with PVP K30 was characterized using various analytical techniques, including X-ray diffraction and atomic force microscopy. NCTD and its metabolites were analyzed using a sensitive and specific liquid chromatography-tandem mass spectrometry method with samples from mice and rats. The results indicated the importance of the PVP coating in controlling the shape and improving the entrapment efficiency of the NPs. Pharmacokinetic profiles of the NCTD group and PVP–NCTD–NP group, after oral and intravenous administration in rats, revealed that relative bioavailabilities were 173.3% and 325.5%, respectively. The elimination half-life increased, and there was an obvious decrease in clearance. The tissue distribution of NCTD in mice after the intravenous administration of both formulations was investigated. The drug was not quantifiable at 6 hours in all tissues except for the liver and kidneys. The distribution of the drug in the liver and bile was notably improved in the PVP–NCTD–NP group. The metabolites and excretion properties of NCTD were investigated by analyzing rat feces and urine samples, collected after oral administration. A prototype drug and two metabolites were found in the feces, and seven metabolites in the urine. The primary elimination route of NCTD was via the urine. The quantity of the parent drug eliminated in the feces of the PVP–NCTD–NP group, was 32 times greater than that of the NCTD group, indicating that the NPs dramatically increased the reduction quantity from liver to bile. We conclude that PVP–NCTD–NPs are an adequate formulation for enhancing the absorption of NCTD, and significantly improving therapeutic effects targeting the hepatic system. Decarboxylation and hydroxylation were the dominant metabolic pathways for NCTD. Metabolites were mainly excreted into rat kidney and finally into urine.
Keywords: pharmacokinetics, metabolites, NCTD, PVP, LC-MS/MS
Introduction
Norcantharidin (NCTD), a 7-oxabicyclo[2.2.1]heptane-2,3-dicarboxylic acid derivative, is the demethylated analogue of cantharidin. NCTD has been reported to be very effective against many types of carcinoma.1–3 Recent studies have discovered that NCTD has a potential for use in primary hepatic carcinoma chemotherapy, administered orally or intravenously. However, the clinical application of NCTD has been limited by a serious side-effect: intense irritation of urinary organs, leading to nephrotoxicity and inflammation.4,5 NCTD also has a short elimination half-life. Even administration in high doses is unable to maintain a high level of circulating activity.6,7 A number of new alternative dosage forms of NCTD, such as microspheres, microemulsions, liposomes, and nanoparticles, have been suggested for improving the safety and efficacy of NCTD treatment, to overcome the above-mentioned shortcomings.8,9
Chitosan (CS), obtained through the deacetylation of chitin, is an avirulent, biodegradable, and efficiently absorptive cationic polymer. CS is widely used in pharmaceutical research, and within the pharmaceutical industry, as a carrier for biomedical material and drug delivery.10 It is used in various nanoparticles (NPs) because of its recognized adhesive property and its ability to enhance the penetration of large molecules across mucosal surfaces.11 However, NPs prepared from CS are unstable. To overcome this problem, polyvinylpyrrolidone (PVP) K30 (molecular weight [MW] = 50 kDa) has been used extensively as a surface-active agent and coating material for NPs,12,13 protecting the drug within its framework. The extent of use of PVP K30 can be attributed to its excellent properties, such as biocompatibility, biodegradability, and low toxicity.
Early methods for NCTD analysis in biological samples typically involved high-performance liquid chromatography (HPLC) with UV detection (HPLC-UV) and gas chromatography- tandem mass spectrometry (GC/MS). The drug could not be detected in vivo because of the low resolution of HPLC-UV. GC/MS was unsuitable for rapid high sensitivity analysis of specific compounds, due to its instability.14 Hence, there are very few reports on the pharmacokinetics and metabolism of NCTD. Other reasons for a lack of related studies on NCTD include its extensive metabolism, wide distribution, and poor absorption. All of these result in poor bioavailability, which directly renders detection of NCTD difficult. HPLC, coupled with ion trap mass spectrometry, has recently been found to be more than nine times more sensitive than HPLC-UV, and is becoming a useful technique for drug metabolite detection and identification. 15 The ion trap can effectively produce full scan mass spectra, while still offering high sensitivity.16 Ion trap mass spectrometry also provides additional information for elucidating the structure of metabolites. Tandem mass spectrometry techniques have been proven to be more powerful and reliable for studying active components, and their metabolism and pharmacokinetics, than other conventional analytical methods.17,18 In this study, a novel liquid chromatography- tandem mass spectrometry (LC/MS) method was developed in order to investigate the pharmacokinetics, tissue distribution, and metabolism of NCTD and PVP–NCTD–NP treatments in rats and mice, after oral and intravenous administrations.
Materials and methods
Chemicals, reagents, and test subjects
CS (MW = 8–10 kDa; degree of deacetylation [DD] = 93.1%) was obtained from Jiangsu Nantong Xingcheng Biological Product Factory, Nantong; NCTD (Lot 20100515) was obtained from Suzhou Surui Pharmaceutical and Chemical, Suzhou; Cantharidin (CTD) (Lot ZL 20091215YY) was obtained from Nanjing Zelang Pharmaceutical Technology, Nanjing; and PVP K30 (MW = 50–55 kDa) (Lot F20100414), was obtained from Sinopharm Chemical Reagent, Shanghai, People’s Republic of China. All other chemicals used were of analytical grade.
Sprague-Dawley (SD) rats weighing 200–250 g, and ICR mice, weighing 15–20 g, in equal numbers of sex, were supplied by the Laboratory Animals Center of the Medical College of Soochow University, Suzhou. All animal experiments were performed following the guidelines of the National Institutes of Health for the Care of Animals, approved by the Experimental Animal Center, Soochow University, Suzhou, China.
Preparation and characterization of PVP–NCTD–NPs
Preparation of PVP–NCTD–NPs
PVP–NCTD–NPs were prepared using the procedure first reported by Calvo et al,19 which is based on the ionic gelation of CS with sodium tripolyphosphate (TPP) anions, with slight modification.20 First, 0.1 g of CS was dissolved in 50 mL of acetic acid solution (0.2% by volume), containing 0.04 g of NCTD. Second, 7.5 mL of 1.2 mg · mL−1 aqueous solution of TPP was added dropwise to the CS solution under magnetic stirring (500 rpm, 30°C), resulting in cross-linkage. Third, 0.26 g of PVP K30 was gradually added to the solution to fill the interspaces in the synthesized framework and coat the surface of the NPs. Finally, the resulting suspension was filtered through a 0.45 μm pore mesh to remove insoluble aggregate residue, yielding a colloidal solution of PVP–NCTD–NPs. Four factors (weight proportion of NCTD to CS, rotation speed, temperature, and concentration of PVP K30) were constantly monitored to optimize the technique for the preparation of PVP–NCTD–NPs. The entrapment efficiency (EE), drug-loading efficiency (DL), particle size, and polydispersity index (PDI) of the NPs were evaluated using an orthogonal design method. The optimized NPs were concentrated to 15 mL using a Vivaflow 50 ultrafilter with 10 KDa polyethersulfone ultrafiltration membranes (Sartorius Group, Goettingen, Germany), and then freeze-dried.
Evaluation of PVP–NCTD–NPs
The freeze-dried NPs were resuspended at the original concentration for characterization. The particle distribution and zeta potential of the PVP–NCTD–NPs were measured using a Zetasizer NP analyzer (HPP-5001, Malvern Instruments, Malvern, UK). The resuspended colloid was evenly dispersed on a piece of slide glass to dry naturally, then visualized using atomic force microscopy (AFM) (MultiMode® V, Veeco, Plainview, NY), in contact mode. The drug yield, drug EE, and DL of PVP–NCTD–NPs were determined using methods previously described by Zhang et al.21
Dosing and sampling
Pharmacokinetics
NCTD and freeze-dried powders of PVP–NCTD–NP were dissolved in 0.9% (weight to volume) sodium chloride. Blood samples from twelve SD rats were obtained from both groups at specific time points after an intravenous dose (5 mg/kg). The samples were then centrifuged at 3500 rpm for 10 minutes, and the supernatant plasma was collected. Approximately 180 μL of plasma sample, 20 μL of CTD (as the internal standard), and 800 μL of methanol were sequentially added to a test tube, followed by centrifugation at 10,000 rpm for 10 minutes. The supernatant was then transferred and dried using a stream of nitrogen gas. After dissolution in a 100 μL, metered volume of water, the sample was precipitated again with 20 μL of perchloric acid and water (1.75:8.25, by volume). Finally, 100 μL of the supernatant was stored in a clean Eppendorf tube at 4°C before analysis. Oral administration (5 mg/kg) in both drug groups was conducted with 12 rats. Blood samples were prepared for liquid chromatography coupled with tandem mass spectrometry (LC-MS/MS) analysis following the procedure described above. Finally, drug concentration was measured and drug concentration time curves were plotted. Pharmacokinetic parameters were computed using 3P97 software (Chinese Society of Mathematical Pharmacology, Beijing).
Tissue distribution and elimination
Tissue distribution and the elimination of total drug residues were determined after oral dosing with NCTD and PVP–NCTD–NP at 5 mg/kg. Blood specimens were collected from the eye socket vein of mice (six mice per group) at each sampling time. After the mice were euthanized by cervical dislocation, selected organs (heart, liver, kidney, spleen, and lung) were dissected, briefly rinsed with normal saline, blotted, and weighed. Immediately, bile was collected from the gall bladder using a syringe. All tissues and fluids were pounded to homogenization, then prepared using the method described above.22,23 They were then analyzed to measure the amount of NCTD in organs. Differences in elimination rates of organs were plotted.
Metabolites and excretion
Twelve rats were fasted overnight before experimentation, held in stainless steel metabolic cages, provided with urine–feces separators and access to water. Rat feces and urine were collected prior to drug administration, and for 24 hours after a single oral dose of NCTD or PVP–NCTD–NP. After feces and urine collection, the survival time of the rats was observed.
Approximately 1 g of sample feces from each rat was homogenized, dried, and then dissolved in 20 mL of a methanol-water mixture (2:1, by volume) via ultrasonication for 30 minutes. After centrifugation at 3000 rpm for 12 minutes, an aliquot of 160 μL of supernatant, mixed with 20 μL of perchloric acid and water (3:7, by volume), was whirled for 3 minutes, then centrifuged again for 15 minutes at 12,000 rpm, separating the supernatant into an Eppendorf tube. A 160 μL measure of urine was blended with 20 μL of perchloric acid and water (3:7, by volume). To prepare urine samples, The steps were similar to those used for feces samples, except that the perchloric acid and methanol methods of precipitation were reversed.
Samples were analysed to obtain measure of metabolite and drug concentration using enhanced mass spectrometry (EMS) and multiple reaction monitoring (MRM) modes. The same procedures were conducted for mouse subjects.
Analytical methods
LC-MS/MS analysis
Chromatographic analysis was carried out using an Agilent 1100 LC system (Agilent Technologies, Palo Alto, CA), equipped with a degasser, quaternary pump, and autosampler. Liquid chromatography was performed on a reversed phase column (Hypersil™ C18, [2.10 mm × 150 mm, 5 μm], Thermo, Scientific, Waltham, MA) at 35°C. The mobile phase used a methanol–water mixture (3:7, by volume), adjusted to pH 3.1 with formic acid, and pumped at a flow rate of 0.20 mL per minute, for isocratic elution. The injection volume was 5 μL for each sample.
Detection was carried out using a QTRAP™ 2000 triple quadrupole mass spectrometer (Applied Biosystems, Foster City, CA) with TurboIonSpray source interface. The mass spectrometer was operated in the negative ion mode at an ion source heater temperature of 350°C. Nitrogen was used as a nebulizer gas at 35 psi, curtain gas and high collision gas at 25 psi. Standard samples of NCTD and CTD were first scanned in EMS mode, to confirm that ions were consistent with the prototype molecules. Enhanced product ion mode was used to identify pairing of the molecules. Finally, a high mass resolution for NCTD and CTD ion pairs was obtained in MRM mode. The ramped parameters in MRM mode for NCTD and CTD included a −23 V declustering potential, −3.8 V entrance potential, −25 V collision energy, and −20 V collision cell exit potential. Because the ions hydrolyse easily, quantification was performed using the MRM mode of the transitions, from mass-to-charge ratio (m/z): 185.0–141.1, for NCTD, and from m/z 213.1–169.2, for CTD.
Calibration curves and quality control samples
An internal, matrix-matched standard calibration method was used for quantitative analyses. Standard stock solutions of NCTD and CTD were individually prepared in 0.5125 and 0.305 mg/mL methanol, respectively. These stock solutions were then serially diluted with methanol to obtain working solutions. All stock and working solutions were stored at 4°C until use. Calibration standards and quality control (QC) samples were prepared by spiking 20 μL of working solution, 20 μL of the internal standard (CTD, 30 μg/mL), and 20 μL of perchloric acid and water (3:7, by volume) into 160 μL of blank plasma. The resultant NCTD concentrations in the calibration standards were 0.1025, 0.2050, 0.5125, 1.025, 2.050, 5.125, and 10.25 μg/mL. QC samples were obtained with NCTD concentrations of 0.2050, 1.025, and 5.125 μg/mL. Quantification was based on the ratios of the peak areas of each compound against those of the internal standards.
Results and discussion
Characteristics and evaluation of PVP–NCTD–NPs
PVP–NCTD–NPs were prepared under optimal conditions (20% NCTD to CS, by weight, with addition of 0.260 g PVP K30, centrifuged at 500 rpm and 30°C). All experiments were repeated five times. The results showed that drug yield, EE, and DL of PVP–NCTD–NPs were 98.6% ± 0.2%, 56.33% ± 1.41%, and 8.38% ± 0.56%, respectively. The NPs had a mean particle size of 140.03 ± 6.23 nm, and a narrow size distribution PDI of 0.136 ± 0.029. The zeta potential was 12.26 ± 1.44 mV.
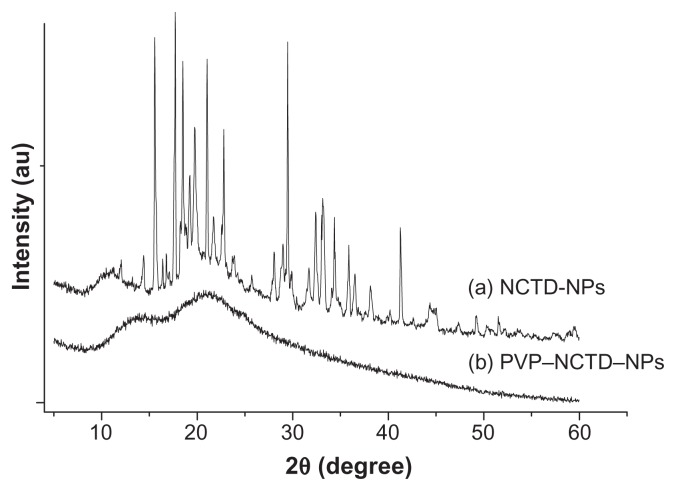
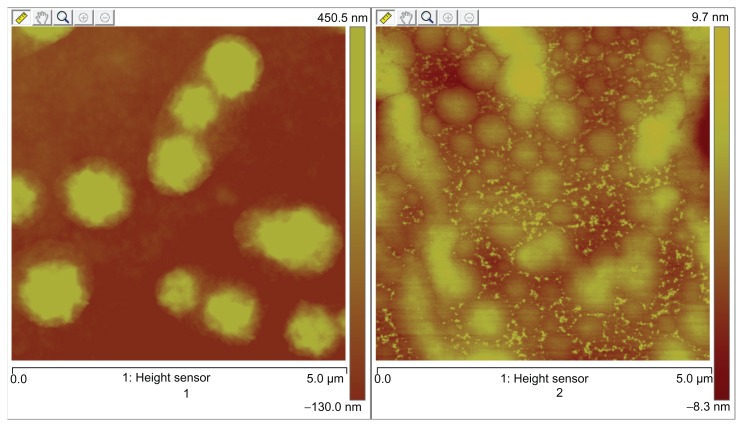
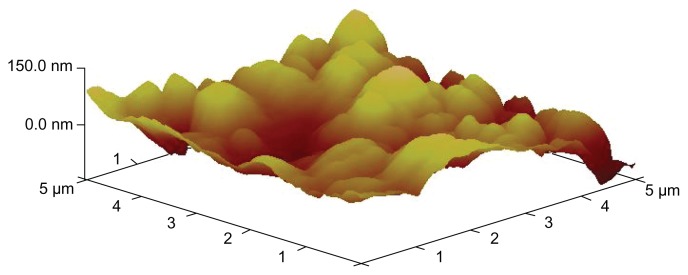
X-ray diffraction was employed to investigate the immobilization of PVP on NCTD NPs (Figure 1). However, the characteristic features seen in Figure 1a disappeared in Figure 1b. The reason for the difference might be that PVP adhered to the surface of the NPs, preventing crystallization, so that the characteristic features observed were only those of PVP.24 Figure 2 presents the difference between the NPs without PVP and those with PVP (PVP–NCTD–NPs). The PVP coating resulted in improved drug entrapment efficiency and narrow particle size distribution. Figure 3 shows the three-dimensional structure of the NPs. They appear approximately elliptical, with particle size measurements similar to those obtained by dynamic light scattering. PVP plays an important role in controlling the shape and size distribution of particles, as well as in decreasing the degree of agglomeration of NCTD NPs.25
Figure 1.
XRD pattern of NCTD and PVP–NCTD–NP nanoparticles.
Abbreviation: XRD, X-ray diffraction.
Figure 2.
AFM ichnography of NCTD-NPs and PVP–NCTD–NPs.
Notes: 1: nanoparticles without PVP; 2: nanoparticles with PVP.
Abbreviation: AFM, atomic force microscopy.
Figure 3.
AFM image of PVP–NCTD–NPs.
Method validation
The ionization and fragmentation patterns of NCTD and CTD were analyzed from mass spectra scanned from m/z 50–500, in negative ionization modes. The dominating ions of NCTD were charged molecular ions at m/z 185, in contrast to the charged ions at m/z 167 (specific for CTD, based on the m/z 169–213 transition). The retention times of NCTD and CTD were 2.95 and 6.90 minutes, respectively.
The specificity of this method was demonstrated by comparing chromatograms of NCTD and CTD obtained from a blank sample, a spiked sample, and a sample collected 30 minutes after drug administration. In the negative ion MRM mode, no endogenous substance in the samples interfered with NCTD or CTD, and the standard curves exhibited excellent linearity. The limit of detection, defined as the lowest concentration at which the analytical assay can reliably differentiate analyte liquid chromatograph peaks from background levels (signal-to-noise ratio >3), was 50 ng/mL in the samples. The results of accuracy and precision tests revealed intraday and interday precisions of less than 5%, with accuracy within ±10%. In summary, the assay has been proven to be adequate and acceptable.
Pharmacokinetic studies of two formulations
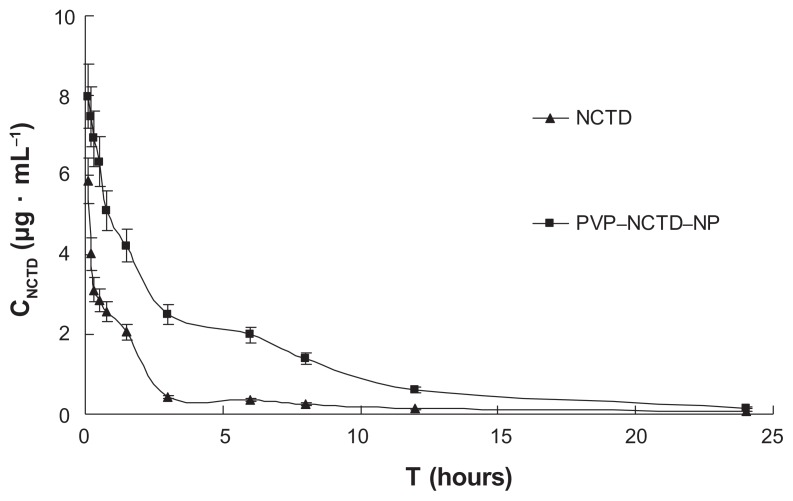
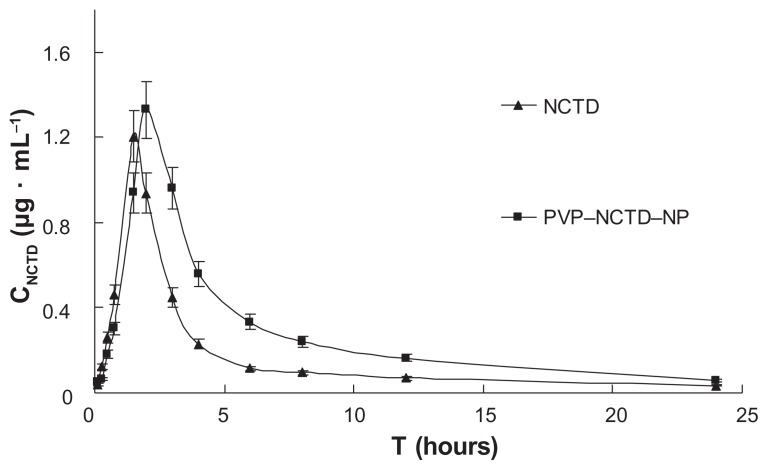
After intravenous or oral administration of the two formulations to rats from each treatment group (N = 6), plasma concentrations of NCTD were determined using LC-MS/MS. The data obtained from each group were averaged. Figures 4 and 5 show the mean plasma concentration time curves for NCTD after intravenous and oral doses, respectively. The corresponding pharmacokinetic parameters are presented in Table 1, which demonstrates that they all fit into a two-compartment open model. After oral dosing, plasma concentration of NCTD was very low. In contrast to intravenous administration, oral administration permitted the calculation of oral bioavailability, which was low, at only 39.3% and 68.1% for NCTD and PVP– NCTD–NPs, respectively. The difference might be caused by varying water-solubility and in vivo distribution of NCTD through the different administration routes. Analysis of the PVP–NCTD–NPs group showed that that relative bioavailabilities, after intravenous and oral administration, were 325.5% and 173.3% greater, respectively, than in the NCTD group. The absorption half-life (t1/2(a)) of the NCTD group was about 15 minutes, and corresponded with a previous report,26,27 which concluded that NCTD could only be used as a short-acting drug.
Figure 4.
Mean plasma concentration profiles of NCTD after intravenous administration of two formulations at 5 mg/kg to SD rats (N = 6).
Abbrevations: SD, Sprague-Dawley; CNCTD, concentration of NCTD; T, time.
Figure 5.
Mean plasma concentration profiles of NCTD and PVP–NCTD–NP after oral administration of 5 mg/kg to SD rats (N = 6).
Abbrevations: CNCTD, concentration of NCTD; T, time.
Table 1.
Pharmacokinetic parameters of two formulations after intravenous and oral administrations to rats
| Parameter | Intravenous administration (5 mg/kg) | Oral administration (5 mg/kg) | ||
|---|---|---|---|---|
|
|
|
|||
| NCTD | PVP–NCTD–NP | NCTD | PVP–NCTD–NP | |
| AUC0-t (μg · ml−1 · h) | 9.79 ± 1.26 | 31.86 ± 4.42 | 3.85 ± 0.66 | 6.67 ± 1.00 |
| AUC0-∞ (μg · ml−1 · h) | 10.77 ± 2.34 | 32.90 ± 4.63 | 3.87 ± 0.69 | 6.68 ± 1.08 |
| t1/2(a) (h) | NA | NA | 0.56 ± 0.43 | 0.80 ± 0.71 |
| t1/2(α) (h) | 0.26 ± 0.06 | 0.73 ± 0.14 | 0.72 ± 0.68 | 0.83 ± 0.54 |
| t1/2(β) (h) | 2.63 ± 0.82 | 5.99 ± 1.53 | 5.08 ± 4.79 | 6.03 ± 3.06 |
| Cmax (μg · ml−1) | NA | NA | 1.21 ± 0.23 | 1.33 ± 0.31 |
| Tmax (h) | NA | NA | 1.50 ± 0.44 | 2.00 ± 0.52 |
| MRT (h) | 0.34 ± 0.10 | 0.93 ± 0.21 | 5.49 ± 4.58 | 6.53 ± 3.42 |
| Vd (L · kg−1) | 0.82 ± 0.45 | 0.62 ± 0.26 | 9.48 ± 6.59 | 6.52 ± 3.87 |
| CL (L · h−1) | 0.12 ± 0.02 | 0.04 ± 0.01 | 0.32 ± 0.05 | 0.19 ± 0.02 |
| Fr | NA | 325.5% | NA | 173.3% |
Notes: (N = 6; mean ± SD). Fr = ((AUCPVP–NCTD–NP × DNCTD)/(AUCNCTD × DPVP–NCTD–NP)) × 100.
Abbreviations: SD, standard deviation; NA, not available; AUC, area under curve; t1/2(a), half-life (minutes); t1/2(β), half-life (hours); T, time; MRT, mean residence time; V, apparent volume of distribution; CL, clearance; Fr, relative bioavailability; D, dose.
After intravenous administration, a long distribution half-life (t1/2(α) = 0.73 hours) and low clearance (CL = 0.04 L/hour) were observed in the PVP–NCTD–NP group, compared with the NCTD group (t1/2(α) = 0.26 hour; CL = 0.12 L/hour). This suggests that the distribution and metabolism of NCTD in tissues and organs might have been slow. The highly effective absorption and sustained drug release of PVP–NCTD–NPs resulted in a 3–6 hour platform for the concentration of NCTD, in vivo, on both concentration time curves. These results demonstrate that the PVP–NCTD–NP formulation can significantly improve drug bioavailability and sustained release effect.
Tissue distribution and elimination
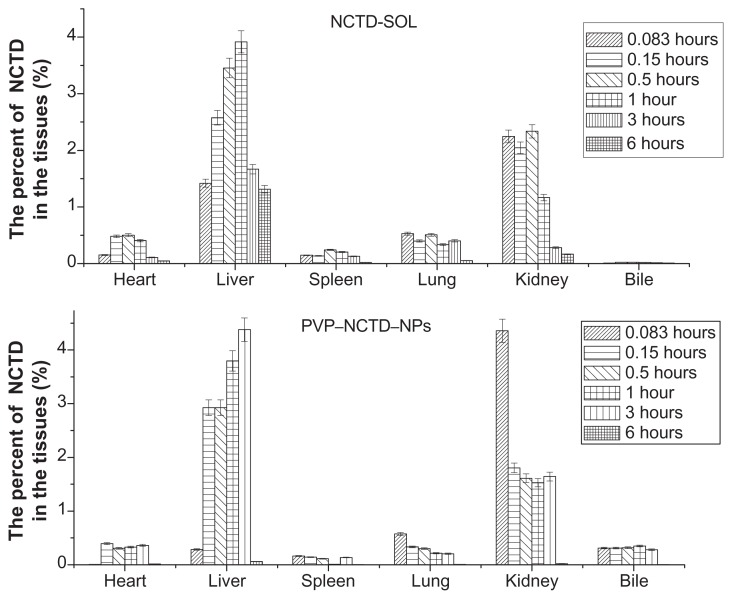
After oral dosing with the two formulations, the total residue concentrations in tissue were highest at 1–3 hours (Figure 6), with distribution mostly in the liver and, secondarily, in the kidney. The concentration of residues in the bile was close to that of plasma, which was over five times greater than in other tissues. Liver tissue from the PVP–NCTD–NP group had a much higher concentration of residues (4.07 μg/mL), than the NCTD group; the concentrations in kidney and bile also increased. The targeting evaluation (Table 2), of targeted index (TI), targeted efficiency (Te), and relative targeted efficiency (RTe), showed that the trend in NCTD distribution in the NCTD group was from lung to heart, to kidney, to other tissues. The trend for the PVP–NCTD–NP group was from bile to kidney, to liver, to other tissues. These results indicate a hepatic-targeting effect of PVP–NCTD–NPs, resulting in increased drug content in the liver, as well as increased quantity of NCTD discharged into the kidneys and bile.
Figure 6.
Tissue distribution of NCTD-SOL and PVP–NCTD–NPs after intravenous administration in mice (N = 6).
Table 2.
Te, RTe, and TI of NCTD and PVP–NCTD–NPs after intravenous administration
| Tissue | Te | RTe | TI | |
|---|---|---|---|---|
|
|
||||
| NCTD | PVP–NCTD–NPs | |||
| Blood | 30.74 | 41.87 | 0.36 | 2.80 |
| Heart | 14.99 | 2.19 | −0.85 | 0.301 |
| Liver | 10.07 | 5.72 | −0.43 | 1.168 |
| Spleen | 7.44 | 1.86 | −0.75 | 0.514 |
| Lung | 22.72 | 3.46 | −0.85 | 0.314 |
| Kidney | 11.72 | 7.52 | −0.36 | 1.321 |
| Bile | 2.33 | 37.39 | 15.05 | 33.03 |
Notes: RTe = (TePVP–NCTD–NPs − TeNCTD)/TeNCTD × 100%.
Abbreviations: Te, targeted efficiency; Rte, relative targeted efficiency; TI, targeted index.
In vivo metabolite identification and excretion
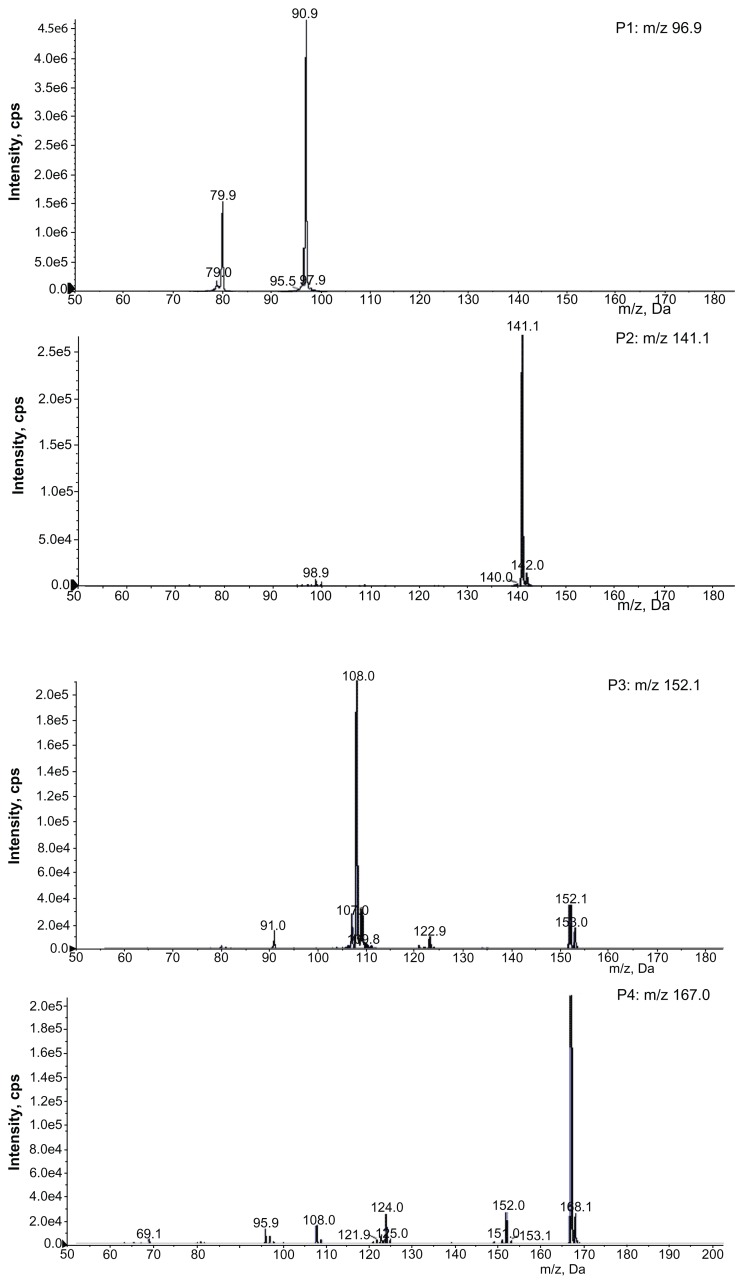
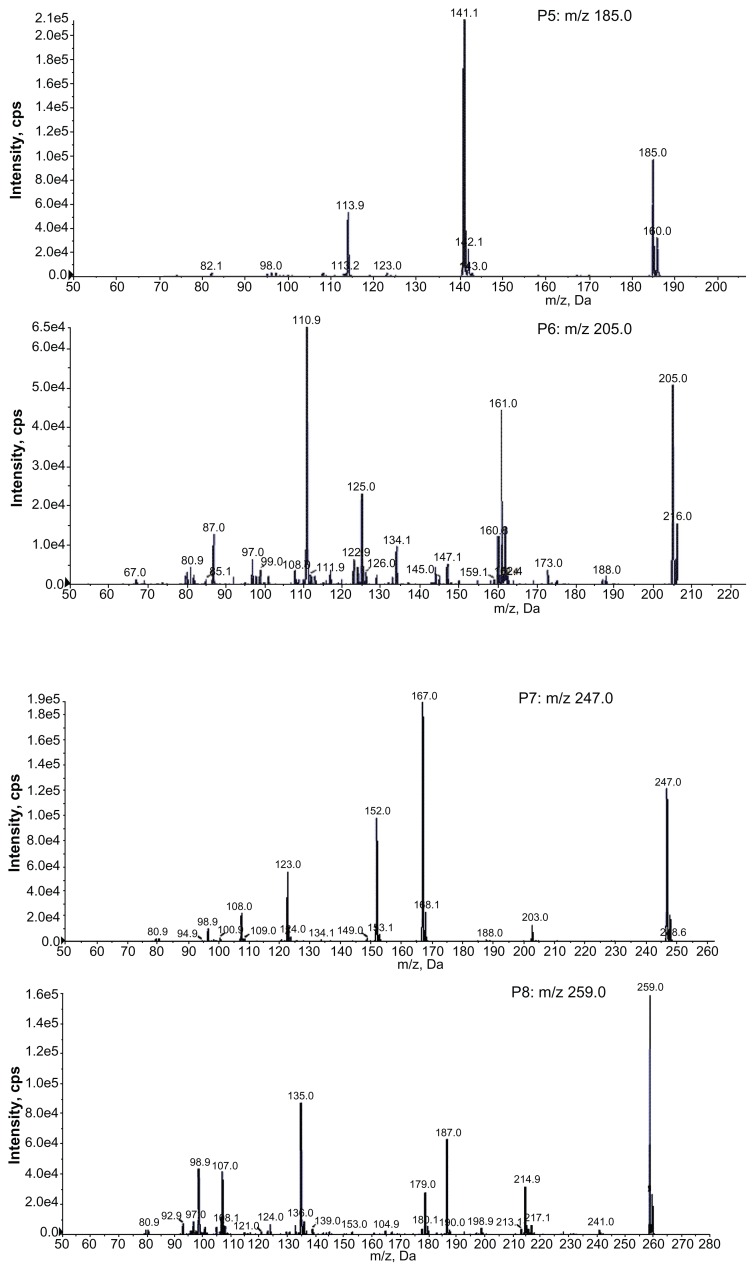
The full scan mass spectra of the samples collected from 0–6 hours after oral administration of PVP–NCTD–NP were compared with those of blank rat urine and feces samples, to identify possible metabolites. These compounds were then analyzed using LC-MS/MS to determine their structures, through comparison of their retention times, changes in observed mass, and mass spectral patterns of product ions, compared against those of NCTD.28 Using this method, a total of seven metabolites in rat urine were identified as hydrolytic NCTD: hydroxy NCTD, dihydroxy NCTD, hydrogenant NCTD, etc. Hydrolytic NCTD and decarboxylated NCTD were found in rat feces. Their molecular ions were found at m/z 96.9, 141, 152, 167, 205, 247, and 249. Short intervals of retention time were observed, with an end result at 3 minutes for short runtime experiments. MS/MS product ion spectra (Figure 7), obtained from the fragmentation of deprotonated molecular ions, were used to provide more precise structural identification of the metabolites (Figure 8).
Figure 7.
Product ion spectra of NCTD and its metabolites in rats.
Figure 8.
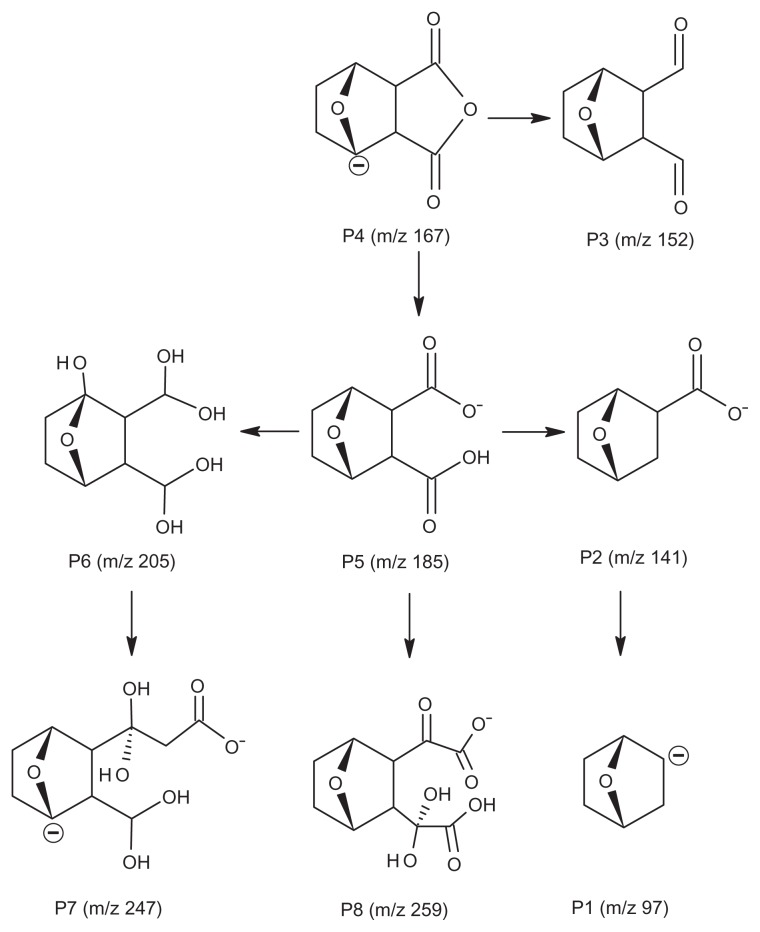
Structures of the main metabolites and their possible transformation in rats.
The mass spectra of P4 showed a deprotonated molecular ion at m/z 167, which was the prototype drug. The molecular ion at m/z 185 (P5) was the hydrolysis product of the unchanged parent drug. At m/z 141 (P2) and m/z 97 (P1), there were decreases of 44 Da and 88 Da, respectively, compared with P5. The fragmentation of molecular ions confirmed that P2 was a product of a decarboxylation reaction at P5, and that P1 was generated by the loss of two carboxyl fragments. In investigating the fragmentation of P4 molecular ions, an intermediate compound (P3) was found, with an oxygen atom lost. The product ion at m/z 205 (P6) was generated by the addition of a neutral H2O fragment and the deoxidization of two hydrogen atoms at P5. The MW of the metabolites (P7 and P8), where fragmentations of the basic annulation (P1) was found, were 62 and 74 mass units greater than for NCTD. The major fragment ions of P7, at m/z 203 and m/z 188, combined with ion spectra, were interpreted as the cleavage of carboxyl and the loss of methyl, respectively, followed by a neutral H2O loss to P4. The major fragment ions in the MS/MS spectrum of P8 showed that molecular ion peaks were 44, 17, 17, 44, and 28 mass units less than than those of P5, indicating that the fragment ions might correspond to dicarboxyl, dihydroxy, and carbonyl.
In contrast to a previous study,29 no glucuronide or sulfate conjugates of NCTD were found in the samples. This might be due to the different sample preparation and analytical methods used. This study proposes that decarboxylation and hydroxylation are the major metabolic pathways of NCTD in rats.
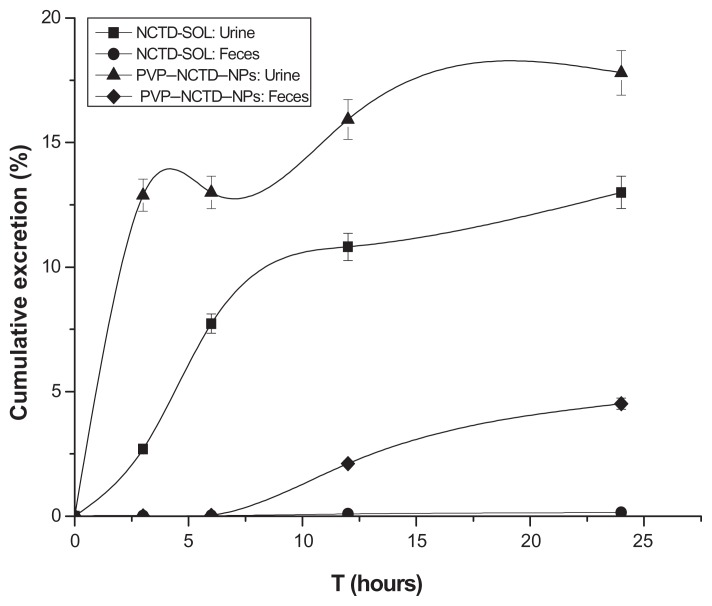
Residues of NCTD were highly concentrated in urine, relative to feces. The total residue concentrations rapidly increased from 0–6 hours, then slowly declined (Figure 9). The quantity of parent drug discharged in urine from the PVP–NCTD–NP group was 1.37 times greater than that of the NCTD group; in bile and feces it was 32.21 times greater. The kidney has been shown to be the main excretory pathway, and NPs dramatically improved the concentration of the parent drug, NCTD, in the urine.
Figure 9.
Cumulative amounts of excreted NCTD in urine and feces: time curves after oral administration of NCTD and PVP–NCTD–NP to rats (N = 6).
A grouping experiment was carried out to investigate this phenomenon. The feces and bile of several mice in the orally-administered PVP–NCTD–NP group were analyzed to identify metabolites. In bile, the parent drug and other metabolites were found. In feces, only the parent drug was found. This may reveal an explanation of the phenomenon: metabolites were discharged first into the duodenum from the bile, transformed into the parent drug by intestinal flora, then reabsorbed by the intestinal tract, and, finally, transported to the liver.30 Such a process could explain the platform of NCTD concentration observed in pharmacokinetic studies. Another cause was the improved hepatic targeting of the PVP–NCTD–NP formulation. The survival time of rats dosed with PVP–NCTD–NP (20 mg/kg) reached more than 30 days. In contrast, survival time in the NCTD group was about 24 hours. The urine output of the PVP–NCTD–NP group was approximately equal to that of normal rats, whereas that of the NCTD group was one-third of normal. This suggests that PVP–NCTD–NP could effectively lessen renal toxicity.
Conclusion
A novel NP, based on CS and PVP K30, was synthesized and characterized. PVP–NCTD–NP, with stable EE and high DL, was demonstrated to be capable of sustained release and high efficiency, compared to NCTD. NPs with mean particle sizes of 140.03 ± 6.23 nm reduced adverse reaction in normal hepatic cells, by reducing passive targeting in the liver.31,32
To address the difficulty of NCTD detection, an LC-MS/MS-based method was developed, and found to be specific, sensitive, and accurate for qualitative and quantitative assay. The pharmacokinetics of both formulations in rats were well fitted to a two-compartment open model. PVP–NCTD–NP improved the absorption of NCTD and maintained a very long treatment period. A tissue distribution experiment showed that PVP–NCTD–NP improved the hepatic targeting effect of NCTD. Hepatoenteral circulation was involved in the excretion of PVP–NCTD–NPs.
NCTD is hydrolyzed easily in body fluids to form hydroxyl or carboxyl metabolites. Our study suggests that decarboxylation and hydroxylation might be major metabolic pathways of NCTD in rats. Metabolite distribution was consistent with the results of a previous report,33 which also indicated that NCTD was metabolized mainly in the liver, passing into the kidneys before being excreted through urine. Our identification of seven metabolites might provide important information regarding the bioactive forms of NCTD and its pharmacological mechanisms.
Acknowledgments
This study was supported by the National Basic Research Program of China (Program 973, 2007CB935800), the National Key Program of New Drug innovation (2009zx09310-001), Technology Support Program of Jiangsu Province (BE2011670), and a project founded by the Priority Academic Program Development of Jiangsu Higher Education Institutions.
Footnotes
Disclosure
The authors report no conflicts of interest in this work.
References
- 1.Wang GS. Medical uses of mylabris in ancient China and recent studies. J Ethnopharmacol. 1989;26(2):147–162. doi: 10.1016/0378-8741(89)90062-7. [DOI] [PubMed] [Google Scholar]
- 2.Hong CY, Huang SC, Lin SK, et al. Norcantharidin-induced post-G2/M apoptosis is dependent on wild-type p53 gene. Biochem Biophys Res Commun. 2000;276(1):278–285. doi: 10.1006/bbrc.2000.3341. [DOI] [PubMed] [Google Scholar]
- 3.Liu XH, Blazsek I, Comisso M, et al. Effects of norcantharidin, a protein phosphatase type-2 A inhibitor, on the growth of normal and malignant haemopoietic cells. Eur J Cancer. 1995;31(6):953–963. doi: 10.1016/0959-8049(95)00050-x. [DOI] [PubMed] [Google Scholar]
- 4.Zeng QB, Sun M. Poly(lactide-co-glycolide) nanoparticles as carriers for norcantharidin. Mater Sci Eng C. 2009;29(3):708–713. [Google Scholar]
- 5.Hill TA, Stewart SG, Ackland SP, et al. Norcantharimides, synthesis and anticancer activity: synthesis of new norcantharidin analogues and their anticancer evaluation. Bioorg Med Chem. 2007;15(18):6126–6134. doi: 10.1016/j.bmc.2007.06.034. [DOI] [PubMed] [Google Scholar]
- 6.Wang LX, He HB, Tang X, Shao RY, Chen DW. A less irritant norcantharidin lipid microspheres: formulation and drug distribution. Int J Pharm. 2006;323:161–167. doi: 10.1016/j.ijpharm.2006.05.060. [DOI] [PubMed] [Google Scholar]
- 7.Li DC, Zhong XK, Zeng ZP, Jiang JG, et al. Application of targeted drug delivery system in Chinese medicine. J Control Release. 2009;138(2):103–112. doi: 10.1016/j.jconrel.2009.05.008. [DOI] [PubMed] [Google Scholar]
- 8.Zheng H, Zhang XQ, Yin YH, et al. In vitro characterization, and in vivo studies of crosslinked lactosaminated carboxymethyl chitosan nanoparticles. Carbohydr Polym. 2011;84(3):1048–1053. [Google Scholar]
- 9.Liu XH, Heng WS, Paul LQ, Chan LW. Novel polymeric microspheres containing norcantharidin for chemoembolization. J Control Release. 2006;116:35–41. doi: 10.1016/j.jconrel.2006.08.022. [DOI] [PubMed] [Google Scholar]
- 10.Mao HQ, Roy KN, Troung-Le VL, et al. Chitosan-DNA nanoparticles as gene carriers: synthesis, characterization and transfection efficiency. J Control Release. 2001;70(3):399–421. doi: 10.1016/s0168-3659(00)00361-8. [DOI] [PubMed] [Google Scholar]
- 11.Baldrick P. The safety of chitosan as a pharmaceutical excipient. Regul Toxicol Pharm. 2010;56(3):290–299. doi: 10.1016/j.yrtph.2009.09.015. [DOI] [PubMed] [Google Scholar]
- 12.Cheng YT, Uang RH, Chiou KC. Effect of PVP-coated silver nanoparticles using laser direct patterning process by photothermal effect. Microelectron Eng. 2011;88(6):929–934. [Google Scholar]
- 13.Liu HL, Ko SP, Wu JH, et al. One-pot polyol synthesis of monosize PVP-coated sub-5 nm Fe3O4 nanoparticles for biomedical applications. J Magn Magn Mater. 2007;310(2):e815–e817. [Google Scholar]
- 14.Krone N, Hughes BA, Lavery GG, Stewart PM, Arlt W, Shackleton CH. Gas chromatography/mass spectrometry (GC/MS) remains a preeminent discovery tool in clinical steroid investigations even in the era of fast liquid chromatography tandem mass spectrometry(LC/MS/MS) J Steroid Biochem Mol Biol. 2010;121:496–504. doi: 10.1016/j.jsbmb.2010.04.010. [DOI] [PMC free article] [PubMed] [Google Scholar]
- 15.Zhang JL, Cui M, He Y, Yu HL, Guo DA. Chemical fingerprint and metabolic fingerprint analysis of Danshen injection by HPLC-UV and HPLC-MS methods. J Pharm Biomed Anal. 2005;36(5):1029–1035. doi: 10.1016/j.jpba.2004.09.009. [DOI] [PubMed] [Google Scholar]
- 16.Adamczyk M, Gebler JC, Wu J, Yu ZG. Complete sequencing of anti-vancomycin fab fragment by liquid chromatography-electrospray ion trap mass spectrometry with a combination of database searching and manual interpretation of the MS/MS spectra. J Immunol Meth. 2002;260:235–249. doi: 10.1016/s0022-1759(01)00552-x. [DOI] [PubMed] [Google Scholar]
- 17.Cui L, Chan W, Wu JL, Jiang ZH, Chan K, Cai ZW. High performance liquid chromatography-mass spectrometry analysis for rat metabolism and pharmacokinetic studies of lithospermic acid B from danshen. Talanta. 2008;75:1002–1007. doi: 10.1016/j.talanta.2007.12.045. [DOI] [PubMed] [Google Scholar]
- 18.Wang L, Zhang Q, Li XC, et al. Pharmacokinetics and metabolism of lithospermic acid by LC-MS/MS in rats. Int J Pharm. 2008;350:240–246. doi: 10.1016/j.ijpharm.2007.09.001. [DOI] [PubMed] [Google Scholar]
- 19.Calvo P, Remunan-Lopez C, Vila-Jato JL, Alonso MJ. Chitosan and chitosan/ethylene oxide-propylene oxide block copolymer nanoparticles as novel carriers for proteins and vaccines. Pharm Res. 1997;14:1431–1436. doi: 10.1023/a:1012128907225. [DOI] [PubMed] [Google Scholar]
- 20.Wang Q, Zhang L, Hu W, et al. Norcantharidin-associated galactosylated chitosan nanoparticles for hepatocyte-targeted delivery. Nanomed Nanotechnol Biol Med. 2010;6:371–381. doi: 10.1016/j.nano.2009.07.006. [DOI] [PubMed] [Google Scholar]
- 21.Zhang W, Liu Y, Chen XY, et al. Two modelling data analytical methods applied to optimise the preparation of norcantharidin chitosan nanoparticles. J Exp Nanosci. 2010;5(3):271–284. [Google Scholar]
- 22.Gannon SA, Johnson T, Nabb DL, Serex TL, Buck RC, Loveless SE. Absorption, distribution, metabolism, and excretion of [1–14C]-perfluorohexanoate ([14C]-PFHx) in rats and mice. Toxicology. 2011;283:55–62. doi: 10.1016/j.tox.2011.02.004. [DOI] [PubMed] [Google Scholar]
- 23.Plakas SM, Said KR, Musser SM. Pharmacokinetics, tissue distribution, and metabolism of flumequine in channel catfish (Ictalurus punctatus) Aquaculture. 2000;187:1–14. [Google Scholar]
- 24.Abdelrazek EM, Elashmawi IS, Labeeb S. Chitosan filler effects on the experimental characterization, spectroscopic investigation and thermal studies of PVA/PVP blend films. Physica B. 2010;405(8):2021–2027. [Google Scholar]
- 25.Yang HM, Huang CH, Su XH. Synthesis of homogeneous PVP-capped SnS2 submicron particles via microwave irradiation. Mater Lett. 2006;60:3714–3717. [Google Scholar]
- 26.Zhang L, Xiang D, Zheng H, Zhang ZR. Studies on the liver targeting of norcantharindin microemulsion. Acta Pharmaceutica Sinica. 2004;39(8):650–655. [PubMed] [Google Scholar]
- 27.Wei CM, Wang BJ, Yuan GY. Pharmacokinetics of norcantharidin in human by urinary excretion method. Chin Pharm J. 2009;44:1019–1021. [Google Scholar]
- 28.Fang ZG, You BG, Chen YG, et al. Analysis of cyclosporine A and its metabolites in rat urine and feces by liquid chromatography-tandem mass spectrometry. J Chromatogr B. 2010;878:1153–1162. doi: 10.1016/j.jchromb.2010.03.032. [DOI] [PubMed] [Google Scholar]
- 29.Wei CM, Teng YN, Wang BJ, et al. Separation and identification of norcantharidin metabolites in vivo by GC-method. J Chromatogr B. 2011;879:1741–1747. doi: 10.1016/j.jchromb.2011.04.019. [DOI] [PubMed] [Google Scholar]
- 30.Liang WQ, Li G, Liu JP. Biopharmaceutics and Pharmacokinetics. Beijing, China: Beijing: People’s Medical Publishing House; 2007. pp. 135–137. [Google Scholar]
- 31.Liang HF, Yang TF, Huang CT, Chen MC, Sung HW. Preparation of nanoparticles composed of poly (γ-glutamic acid)-poly (lactide) block copolymers and evaluation of their uptake by HepG2 cells. J Control Release. 2005;105:213–225. doi: 10.1016/j.jconrel.2005.03.021. [DOI] [PubMed] [Google Scholar]
- 32.Wu J, Liu L, Yen RD, Le HT, et al. 177 Polycationic liposome-mediated extracellular superoxide dismutase gene delivery protects against acute liver injury in mice. Hepatology. 2004;40:195–204. doi: 10.1002/hep.20288. [DOI] [PubMed] [Google Scholar]
- 33.Wei CM, Wang BJ, Ma Y, Sun ZP, Li XL, Guo RC. Pharmacokinetics and biodistribution of 3H-norcantharidin in mice. Acta Pharmaceutica Sinica. 2007;42(5):516–519. [PubMed] [Google Scholar]


