Abstract
Recent published results in inverse scattering generally show the difficulty in dealing with moderate to high contrast inhomogeneities when employing linearized or iteratively linearized algorithms (e.g., distorted Born iterative method). This paper presents a fully nonlinear algorithm utilizing full wave field data, that results in ultrasound computed tomographic images from a laboratory breast scanner, and shows several such unique images from volunteer subjects. The forward problem, data collection process and inverse scattering algorithm used are discussed. A functional that represents the “best fit” between predicted and measured data is minimized, and therefore requires a very fast forward problem solver, Jacobian calculation, and gradient estimation, all of which are described. The data collection device is described. The algorithm and device yield quantitative estimates of human breast tissue in vivo. Several high resolution images, measuring ∼150 by 150 wavelengths, obtained from the 2D inverse scattering algorithms, using data collected from a first prototype, are shown and discussed. The quantitative values are compared with previous published work.
INTRODUCTION
Transmission ultrasound has been proposed as an adjunct diagnostic modality for over 30 years (Johnson et al., 1992, 1984; Greenleaf and Bahn, 1981; Andre et al., 1997; Glover, 1977; Carson et al., 1981). There are several continuing research efforts attempting to minimize the effect of the technician, and also attempting to yield quantitative estimates of the tissue properties (Duric et al., 2008; Huthwaite and Simonetti, 2011). The present mode of the hand-held ultrasound incorporates the use of tissue characteristics indirectly inferred from “speckle behavior” and other image hints (Stavros et al., 2004). In particular the reflection images standard in US presently do not yield quantitative point-wise estimates of tissue characteristics. The attenuation characteristics of the tissue within a suspected lesion, however, can be indirectly inferred from the shadowing/lack of shadow behind the lesion.
These methods have been successful (Stavros et al., 2004), however, it is clear that if accurate physics could be brought to bear on the problem, it should be possible to accurately model the propagation of ultrasound through a human breast, thereby resulting in quantitative and high resolution imaging.
Early work in quantitative transmission imaging used time of flight algorithms to estimate the speed and a similarly crude algorithm to estimate the attenuation (Greenleaf and Bahn, 1981). In the intervening years there has been a virtual explosion of papers in the “inverse-scattering” literature. Some of these papers have focused on mathematical aspects (e.g., Borup et al., 1992 ; Norton, 2005; Colton et al., 2000; Hohage, 2001), while others have attempted inversions with computer simulated data (Gan et al., 1995) and laboratory data. See especially Andre et al. (1997), for a thorough summary of the state of the art pre-1997, and an example of inversion with laboratory data.
Lehman and Devaney (2003) investigate a method based on the singular value decomposition for transmission mode imaging, which shows promise, but has not been applied to laboratory data. The algorithms that are applicable to laboratory (non-simulation) data, can be broadly categorized into four groups, depending on whether or not they utilize full wave information (Natterer and Wuebbeling, 1995) (not just time of arrival, as in Greenleaf and Bahn, 1981 ), and whether or not they include the full nonlinearity of the inversion process.
Specifically, most full wave algorithms use the so-called “Born or Rytov approximations,” or iterated forms thereof, which essentially linearize the non-linear inversion problem (Tabbara et al., 1988), or a “distorted wave” Born approximation which linearizes the problem about some known solution, which is itself updated, and can be interpreted as an inhomogeneous Green’s function (Norton, 2005; Andre et al., 1997; Haddadin and Ebbini, 1998). See also Wilcox (1993) and Hesford and Chew (2010). The algorithms that attempt to go beyond the Born/Rytov approximations use some kind of iteration technique, since they are attempting to solve a nonlinear problem (Johnson et al., 1992).
Others use Newton-Kantorovich algorithms, however Remis and van den Berg (2000) have shown that this approach is equivalent analytically to the distorted Born method as developed by Haddadin et al. (1995) and Haddadin and Ebbini (1998).
Another frequency based method discussed in Mast et al. (1997) and Lin et al. (2000), uses eigenfunctions of the scattering operator.
Duric et al. (2008) use a ray tracing based method to create images from volunteers to compare with MRI images of the same breast. Their method incorporates refractive but not diffractive effects, thus limiting resolution, whereas the present method incorporates both refractive and diffractive effects. Their method and the present algorithm do allow them to correct for refraction in their reflection images. Huthwaite and Simonetti (2011) utilize a two step approach that incorporates refraction based information, followed by a diffraction based step. The present method can be viewed as iteratively updating the image with both diffractive and refractive information simultaneously at each step. Furthermore, their method is applied to simulated data; the present method is applied to laboratory data from a preclinical prototype that addresses the important calibration and data collection issues.
It is known that the contrasts in speed and attenuation properties of the human breast are outside of the regime of applicability of the Born or Rytov linearization approximation (Haddadin and Ebbini, 1998). The nonlinear minimization approach utilized for the inversion of laboratory data is subject to two major sources of difficulty. First, the linearized inverse problem is ill-posed in the sense of Hadamard (Hohage, 2001). Secondly, being a nonlinear minimization, it is subject to falling into a local minimum (Norton, 2005). The first issue is partially addressed here via the fact that the nonlinear conjugate gradient approach utilized here yields an effective regularization. The second issue is addressed via a kind of frequency homotopy, as discussed below. This means that a large number of iterations are required.
Therefore, the first requirement for a practical algorithm inversion is the existence of a fast forward solver. The methods employed in Wiskin et al. (1997) and Johnson (1992) are based on the Lippmann-Schwinger equation, and conjugate gradient minimization, and are prohibitively expensive in 3D. The k-space method of Mast et al. (2001) is a time domain method and thus gives all frequencies simultaneously. Moreover, Mast et al. show that their method is substantially faster and more accurate than existing FDTD codes. However, for a region 33.5 mm wide and 17.2 mm long, the computational time is still 0.9 CPU h (Mast et al., 2001). The inversion problem for the breast requires regions that are ∼200 mm × 200 mm, and several tens of iterations of a non-linear convergence algorithm. Each iteration requires, with the adjoint method for computing the gradient, the equivalent of ∼5 forward problems. This must be done for each of 180 tomographic views, so a naïve calculation dictates that approximations must be made to the wave equation, that yield substantially faster times, without unduly compromising image quality.
The work of Fishman and McCoy (1984a,b) gives detailed theoretical analyses of marching methods, but does not require the adjoint action, or the Jacobian of the forward problem.
This paper shows the algorithm, hardware and initial results for a fast nonlinear wave based inversion of full wave breast data. A marching method in the frequency domain is used for the forward problem, as well as for the action of the concomitant Jacobian, and its Hermitian transpose. It is well known that marching methods are accurate for ∼+/−40° from the direction of propagation, thus incorporating at least partially, even multiple scattering effects (Lee et al., 2000).
The details of the approximations are shown below and in Wiskin (2011a) and Johnson et al. (2003). Here, the inversion algorithm, the relationship of the data to the wave-field, the gradient of the minimizing functional, and results from laboratory data are shown.
Others have attacked the full nonlinear problem (Gan et al., 1995) but have not inverted laboratory derived data, thereby avoiding the substantial problems associated with calibrating the laboratory data and the computer algorithm models. Their image space is roughly 7.2 cm by 7.2 cm, whereas the image space must be large enough to accommodate most breasts, i.e., ∼15 cm, thereby increasing the computational burden by a factor of at least 6.
The paper presents (1) a new method to update speed/attenuation images simultaneously (see above), (2) a unique variation of the parabolic approximation paradigm, and (3) a new interpretation of the action of the Jacobian adjoint recursion formula. Also, the experimental setup, the theoretical background and details of the algorithm are described, and results from the first prototype are discussed. This paper also utilizes a frequency homotopy for local minima avoidance and a simultaneous calculation of speed and attenuation updates.
DATA—EXPERIMENTAL SETUP
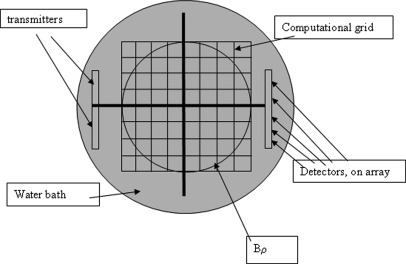
Figure 1 shows a schematic view from above of the experimental set up. All elements on the transmitter array were fired simultaneously to create a pseudo-plane wave incident field. The transmitted signal is a multiple frequency chirp with frequency content from 0.3 MHz to 2.5 MHz. The received time signal is sampled at 30 MHz for 51.2 μs, then Fourier transformed to yield discrete frequencies distributed from 0.3 to 2.5 MHz (see below). The receiver consists of two 256 element arrays (developed by Guided Therapy, Inc., in Arizona), side by side, and a 256 to 2 multiplexer. For a given view angle, the number of elements, NR = 512, each element being 0.325 mm wide, with a kerf of 0.05 mm. The receiver array, therefore, is 512 × 0.375 mm = 192 mm long. The transmitter consists of the same configuration, although all elements excited simultaneously to produce a pseudo-plane wave.
Figure 1.
(Color online) Top view of water bath geometry showing transmitter/receiver arrays, computational grid, Bρ, the inscribed circle, in which the breast is positioned. Every pixel outside this Bρ, the pixel values are constrained to be equal to those of water.
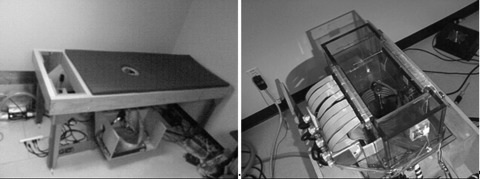
A Gage card and a Pentium 2, 400 MHz computer were used for digitization at a sampling rate of 30 MHz. One view is taken at θ = 0, (Fig. 1) then the arrays are rotated 2°, and another acoustic “plane wave” chirp is sent out. This is repeated for 181 views, so that full 360° coverage is obtained, the last view duplicated the first view for calibration purposes. The required data collection required approximately 1.5 h for 4 slices or “levels” of data. The data levels were 3 mm apart. The transmitter and receiver arrays were placed 6 in. apart [see Fig. 2 (right)] and were embedded into the side of a plexiglass rectangular tank. Copper tubing was placed on the bottom of the tank to keep the temperature at a constant 30 °C. The entire assembly was secured to a rotating circular platform via a wooden [Fig. 2 (left)].
Figure 2.
(Color online) The TechniScan™ scanner used in collecting the data used to reconstruct the images. (prototype A). (Left) The table on which the patient/volunteer rests with the breast extending through the hole in the middle of the table. (Right) The water bath and the four 256-element arrays that are used as the transmitter and the receiver arrays.
The entire platform was rotated via a CompuMotor, Inc., motor that was controlled electronically via a Pentium III desktop computer. The entire rotating assembly was placed under a specially constructed table with a pad, for comfort, and a hole, through which the volunteer’s breast would hang pendant into the water bath. An adhesive patch was attached to the nipple region of the breast, upon which was attached a magnet. The magnet was then secured to another magnet that was attached to a vertical rod that extended up through the plexi-glass tank, through a water tight seal. The pole did not rotate when the assemblage rotated, thereby securing the breast against motion and buoyancy, during the data taking process. Once one data level of the breast (i.e., 181 views) had been obtained, the entire table (upon which the volunteer was prone) was raised 3 mm, by manually adjusting furniture adjustment screws placed in the bottom of each of the four table legs, and the second level of data (181 views) was taken. This procedure was repeated to obtain a total of 4 levels. The total amount of data was therefore ∼3 kBytes * 512 receivers * 181 views * 4 levels = ∼1.12 Gbytes of data.
THEORY
Background
The forward problem is well-known: Given some distribution of speed of sound and attenuation, c(x), α(x), respectively, determine the pressure field f(x) produced by the impinging of a known incident pressure field [often a plane wave, ], , (2D case), the unit circle, gives the direction of the incoming plane wave, and is the wavenumber associated with frequency f, and background speed of sound c0 – background attenuation is assumed negligible for water (Bamber, 1998)). The incident field is modeled using the Rayleigh Integral, this need only be done once, and then stored, so accuracy is more important than efficiency here.
On the other hand, the inverse problem is: Given the pressure field fωθ(xr) as measured at detector positions, xr, r = 1,…,NR=512, for transmitter positions θ = 1,…,Φ, and frequencies, ω = 1,…,Ω, , determine the distribution of speed of sound and attenuation, c(x), α(x) in some region (that is, the breast). is measured in Npr/mm, or multiplied by 8.686 to yield dB/mm, and is frequency dependent.
The 2D theory is discussed and 2D algorithms are used to invert the data collected in this paper. The frequency domain scattering problem is modeled by the Helmholtz equation.
| (1) |
where , with , f is the frequency of insonification. The scattered fields are a function of the space dependent wave-number k(x): , where , j=1,…,NR, are the positions of the various detectors. The objective functional to minimize is
| (2) |
where dωθ is the data vector (see below) for view θ, and frequency ω, containing NR elements. The object function to be imaged is denoted by , where is the background complex valued wave-number. The present model assumes an approximate linear relationship of the attenuation coefficient with frequency, so the imaginary part of γ: , with assumed approximately independent of frequency.
The conjugate gradient methods (Press et al., 1991) of minimization require the calculation of the gradient of F and thus the Hermitian conjugate of the Jacobian, or Frechet derivative of the forward scattering operator. Specifically the gradient is given as
| (3) |
where , and , is the discretized 2D co-ordinate. The algorithms minimize (2), subject to negativity constraints on the α(x) at each pixel (α(x) ≤ 0).
The conjugate gradient based algorithm is used, specifically adapted for nonlinear least squares Ribiere-Polak minimization (Press et al., 1991), in which only the action of the Jacobian, and its Hermitian conjugate, are required. That is, the Gateaux derivatives only, are calculated, the actual Jacobian matrix is prohibitively large and is not held in memory explicitly.
Data definitions
In the following we denote by the spatial positions at the face of a receiver. The measured data is the Fourier Transform of the received signal evaluated at one frequency ω, and is related to the field in the water bath as follows: The predicted data are defined at receiver j, for frequency ω and view angle θ, as
| (4) |
where is the support of the jth receiver, is the total field at the receiver and Aj is some constant of proportionality, characteristic of the receiver element and fixed, which is determined once for a given array, by comparing the theoretical prediction of the received incident field, with the measured and transformed value for that receiver element.
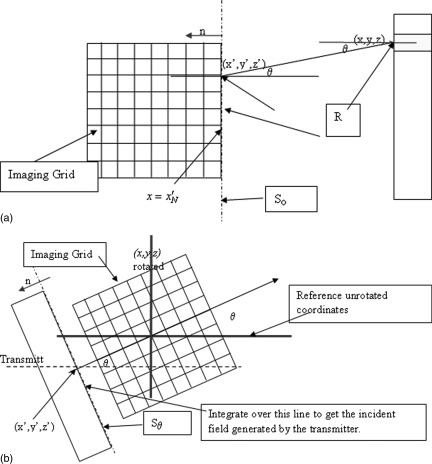
Now where So is the line at the edge of the image grid that is closest to the receiver array [see Fig. 3a], i.e., at , and is the free space Green’s function at frequency ω. It follows from the symmetry of the Green’s function in free space, and substitution of the above expression for into (4) that the characteristics of the transducer element can be incorporated directly via the functional, , where Rk is the kth receiver and the inner product where , and is the field generated by the kth receiver element acting as a source, evaluated at the trailing edge of the computational grid ().
Figure 3.
(Color online) (a) Geometry of field propagation from receivers (acting as transmitter) to the trailing edge of the computational (Imaging) grid, for the first stage of the adjoint action, and for use in the calculation of the received signal. (b) Model of the incident field: a Rayleigh integral is evaluated at the first position on the imaging grid, which is shown in rotated position to account for different rotational views of the system. The field at this line is then propagated via the parabolic approximation forward model to cover entire grid.
Calculating the inner product then gives the voltage on the kth transducer element. The forward operator is thus the concatenation of two operators. The first calculates the total ultrasonic field in the computational grid, for the given incident field (fj, j = −N,…,N). The second operator propagates this calculated total field to the receiver positions and integrates over the face of the receiver, for a given frequency ω, and view angle θ. ()
| (5) |
Figure 4 shows a representative time domain signal received by 160 receivers (vertical axis), against the time (horizontal axis). The array was offset in this case, so the difference between the received signals that pass through the breast and those that miss the breast is clearly visible.
Figure 4.
Waveforms for 160 time signals. The breast is seen offset in this case, to show the difference between the signal that misses the breast and those that propagate through the breast.
Forward problem
The numerical process by which the scattered field fsc is determined can be viewed as a two step process (Ghosh Roy and Couchman, 2002), since the solution of the Helmholtz scattering problem with Sommerfeld-Wilcox radiation condition is equivalent to the “Lippmann-Schwinger equation” (Wiskin et al., 2007).
In the present notation, the equation of Wiskin et al. (2007, p. 186) (the equation has been rewritten since our γ definition differs from the γ used in the 2007 paper) becomes
| (6) |
where is the scattered field at the receiver positions j. From this formulation, it is clearly seen that the functional to be minimized is non-linearly dependent upon γ,
| (7) |
Fast algorithm for forward problem
Using 6 [as a solution to Eq. 1] to determine the fields directly is computationally prohibitive, so a variation of the parabolic approximation (PE) is employed—define the operators: , , where operator is the convolution operator given explicitly by: , and B is the pseudo-differential operator whose square is . Using the Fourier transformed field in the y-direction (perpendicular to the propagation direction), i.e., , the wave equation can be written as
| (8) |
The commutator is not zero, however, the assumption fails precisely when , i.e., when the rate of change of in the x direction (or range), is large, i.e., there is rapid range variation in the tissue properties. While one cannot assume the commutator is small a priori, it is shown that the images that result from using this assumption yield quantitatively accurate results (Wiskin et al., 2011b; Andre et al., 2009).
Thus the full wave equation (under the above assumption) is replaced with the approximately factored equation (PE):
| (9) |
This equation can be formally integrated from some x to x+ε: , approximating the integral, gives: , where . Therefore, the range dimension, x, is broken up into the following: . The coordinate is closest to the transmitter, being within approximately 5 mm of it, and is within approximately 5 mm of the receiver. The field from the transmitter at the line is calculated via a standard Rayleigh integral. This need only be done once, so speed is secondary.
The field is propagated from to . The propagation action, then, is given by , where , and F is the Fourier transform. This is approximated by , where: , and the propagator . Define , as the field at the jth propagation slab, and the discretized version as the vector , . Define the diagonal matrix , where . Similarly define the diagonal matrix .
These definitions give the discrete formulation of the propagation step: , , where . Thus given the field at (assumed to be the incident field), one can “march” through the computational grid to end up with the total field for all .
Incident field representation
The incident field is modeled by calculating the field at the first line of the numerical grid, via the Rayleigh integral, then propagating through the numerical grid, using the forward model, with no scattering object function, to the receivers. This is independent of the breast and done only once and stored, so speed is not an issue.
Inverse scattering algorithm
Hohage (2001) shows that the Frechet derivative of the forward problem , , i.e., , at a particular gamma, γo, is a compact operator, indicating that the inversion problem will be severely ill-posed. In fact, he shows that the singular values of this operator actually decrease exponentially, in accord with the fact that the far-field pattern is guaranteed to be an analytic function on .
Thus, the inverse problem of determining the γ from the scattered data: , is exponentially ill-posed, and, when solved as a minimization problem, suffers the additional defect of having multiple local minima. The inverse problem cannot be carried out analytically or explicitly in the vast majority of cases, in fact one rarely determines the scattering operator explicitly. However, by carefully analyzing the recorded scattered waveform for several different frequencies and source/receiver positions the scatter parameters in γ can be estimated by the least squares minimization of Eq. 2.
Multiple view, multiple frequency imaging
The algorithm uses multiple frequencies to overcome the multiple minimum problem: The image at the lowest frequency is found first, and the image at a given frequency is the starting estimate for the speed and attenuation at the next highest frequency. The starting guess for the lowest frequency is found by a simple time of flight algorithm, which is under-converged since we found that any artifact introduced at this stage was very hard to get rid of. Specifically, the data at 0.5, 0.6, 0.72, 0.865, 1.0, 1.25, 1.5, 1.8 MHz were utilized: For each ω, the predicted data vector is , k = 1,…,NR and the “residual vectors”:
| (10) |
are formed, and thus the functional: , and: . Recall that , so that the real part of γ: , gives speed, and the imaginary part is , giving attenuation.
The Polak-Ribiere (PR) minimization method is described in detail, in this context, in Wiskin (2007). Now, in accordance with the Polak-Ribiere (PR) formula, the gradient must be calculated: , since each is holomorphic, and since: , the action of the Hermitian conjugate of the Jacobian on a residual vector is required, although the Jacobian matrix itself is too large to store. This is done using recursion as below. Note the real part is not taken so that the gradient for the speed and attenuation are found simultaneously.
Action of the Jacobian
The algorithm requires for the nth step-length calculation as in Wiskin (2007). To calculate the action of the Jacobian, i.e., , on a , with , and , a perturbation argument on the above fast forward method (Sec. 3D) is used: define the perturbation, for each range , and, and note that for j = −N+2,…,N:
| (11) |
so that , after the recursions have been carried out.
Gradient calculation: Action of the adjoint
The action of the Jacobian transpose on the residual vector is carried out by algebraic manipulation of the Jacobian recursion (11), i.e., recognizing the Jacobian as a linear operator , and carrying out the Hermitian conjugation. This is carried out in detail in Example 12, column 66 of Johnson et al. (1999) and has the following physical interpretation: First, form the “back-projected field” from the receivers , which is then recursively propagated from xN to x-N, i.e., from the last range to the first, resulting in a “backprojected field,” , . This field is point-wise multiplied by a pseudo-total field (defined below) to yield , and summed over all angles of view, to give the required gradient at one frequency ω: . The pseudo-field is defined at range j, for frequency ω and view θ, in terms of the true field , as . Note that as the step-size diminishes to zero, the pseudo-field approaches the true field (see also Norton, 2005). This gives , recursively (see also Wiskin, 2011).
The algorithm requires over-determination for robustness, i.e., that . Typical values are , and Ω = number of frequencies = ∼6. Thus for overdetermination, but must be much higher to satisfy sampling constraints in the azimuthal direction (generally 180). The actual values of the angles of incidence θ are chosen to diminish as much as possible the ill conditioning of the problem. Equally spaced values are ideal, but experimental constraints may prohibit such values, in which case the multiple frequencies are critical. The breast is surrounded with 180 equally spaced views with this device.
RESULTS
The images below were created in approximately 24 min on a 2.1 GHz Pentium Pentium IV processor. The codes have been parallelized to run on 6 nodes, and resulted in an almost linear speed-up: the images were obtained in ∼4 min with this parallelization.
Each image is 394 × 394 pixels, each pixel is 0.375 mm by 0.375 mm, which is unacceptably coarse for finite differences. However, numerical experiments comparing analytic solutions with our Fourier based method indicate λ/3 is adequate sampling for the inversion process, which is further validated by the results of this section. The gray scale (generally) goes from a low speed of 1.35 mm/μs (dark), to a high of 1.60 mm/μs (white). The skin lines have a high speed of sound. The attenuation (unless otherwise indicated) varies from 0 to 3 dB/cm/MHz. Both scales vary from dark (low speed/attenuation) to light (high speed/attenuation).
P02—Simple cyst
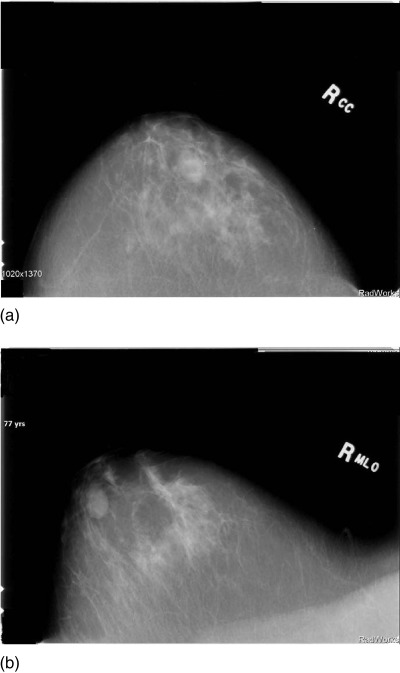
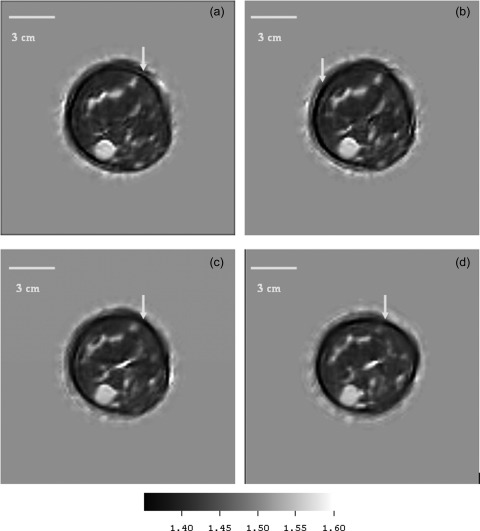
Figure 5a shows the Cranial caudal (CC) view of a simple cyst that in a 77 year old volunteer, Fig. 5b shows the Medial Lateral oblique (MLO) view of the same patient. The position of the cyst was inferred from these views then 4 data levels of this patient were taken 1.5 mm apart so as to intersect the cyst. Figures 6a, 6b, 6c, 6d show the speed of sound reconstructions from these levels.
Figure 5.
Mammograms showing (a) Cranial Caudal (CC) view and (b) MLO view for right breast of 77 year old patient p02.
Figure 6.
(Color online) Patient p02: Simple cyst speed images at successive levels, 1.5 mm apart. The cyst is clearly visible at the 7 o’clock position in all levels. These very early images show dark artifacts near skin (see arrows) caused by inappropriate starting guesses. The volunteer had no history of disease and the speeds of sound (and std. devs) of the cyst at each level were 1552 (10); 1550 (13); 1545 (9); 1547 (7) m/s. The fat had a speed of 1400–1411 m/s.
P05—Benign fibroadenoma
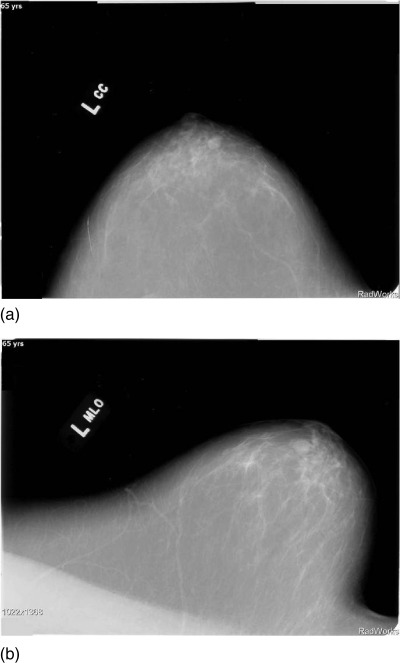
Figures 7a, 7b show the mammograms of a patient p05 with a diagnosed benign fibroadenoma (FA), the CC and MLO are shown respectively. Figure 8 shows the reconstruction of a 2D slice of the speed of sound at the appropriate level as indicated by the mammograms.
Figure 7.
(a) CC and (b) MLO mammograms of p05 showing the benign fibroadenoma.
Figure 8.
(Color online) Speed image from 65 year old patient p05, showing benign fibroadenoma (FA). The FA was segmented out with simple thresholding and the speed measured as 1599 m/s. Fibroglandular tissue and skin (light gray) are clearly visible also. Note the low speed fat – dark gray region (1443 m/s), the relatively high speed of the skin and ductal tissue (1556 m/s) and the high speed region corresponding to the FA (1599 m/s), which is higher than most of the other FA values that we observed. The boundary was smooth, there was no spiculation.
P21—Fibroadenoma
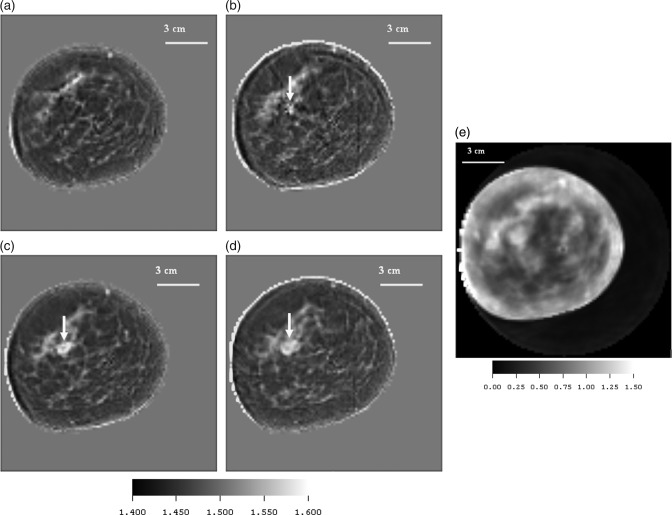
Figures 9a, 9b, 9c, 9d are the speed images of four central cross sections of a breast containing a fibroadenoma taken 3 mm apart. Note that the skin line is well defined in speed and ductal tissue is shown in light gray. Figure 9e shows an attenuation image of 3rd slice.
Figure 9.
(Color online) (a)–(d) Speed starting from upper left and moving clockwise, showing a high speed fibroadenoma (FA) (white - 1570 m/s), glandular tissue (light gray −1520 m/s), skin, and low speed fat regions (dark gray-1473 m/s), from patient p21. Arrow shows FA coming into view at higher levels. The range of speed of sound values ranged from 1400 to 1582 mm/μs. The lesion was determined to be a FA (arrow) via a diagnostic biopsy performed at St. Mark’s Hospital in Salt Lake City. Several features identified as ductal tissue had full-widths at half max (FWHM) of 1.875–2.25 mm. (e) Attenuation from patient p21. (e) shows the corresponding attenuation image of the 3rd level. The segmented attenuation value of the FA was 1.20 dB/cm/MHz at 1.8 MHz.
P35—Cancer
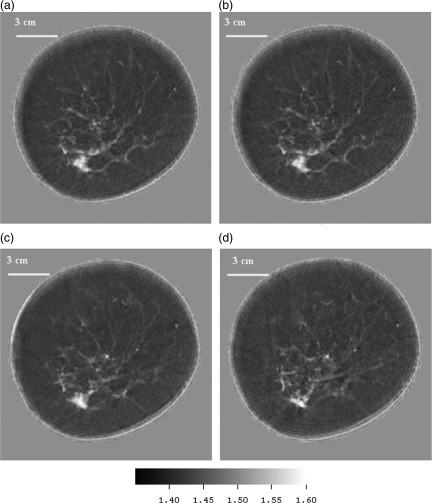
Figures 10a, 10b, 10c, 10d are the speed images of a patient with a high-grade ductal carcinoma in situ and moderately differentiated invasive adenocarcinoma. Note that the skin line is well defined in speed and ductal tissue is shown clearly in light gray scale. Ductal tissue was found to have a FWHM of 1.5 mm.
Figure 10.
(Color online) (a)–(d) Speed images from upper left clockwise: showing levels successively 3 mm higher in the breast. The position of the adenocarcinoma was confirmed from mammograms in the 7 o’clock position. The speed of the cancer was determined to average 1.597 mm/μms. The attenuation for this very small area was measured (using threshold based segmentation) at 2.76 dB/cm/MHz at 1.8 MHz.
CIRS phantom
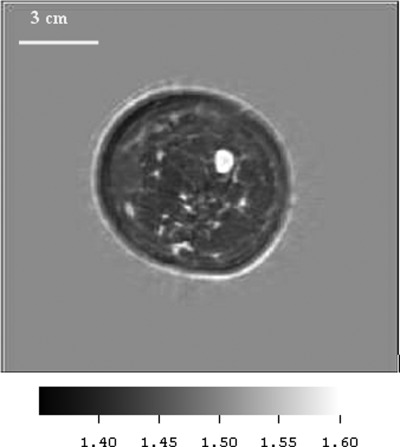
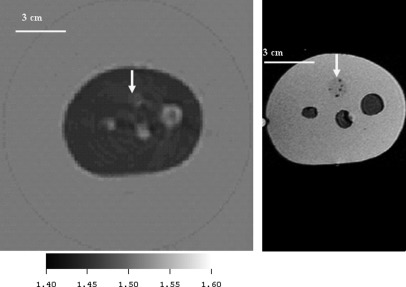
Figures 11(left) and 11(right) show the cross section of a CIRS, Inc. phantom with one solid inclusion, and 3 sacks of fluid to emulate “cysts.”
Figure 11.
(Color online) Comparison of the CIRS, Inc. phantom image using ultrasound inverse scattering vs. MRI. The ultrasound speed image is on the left and an MRI image of the same phantom is shown at right for comparison. This cross-section of the CIRS, Inc. phantom shows 3 “cysts” and one solid inclusion (12 o’clock – see arrow). The speed of sound of the solid inclusion as determined independently from a sample sent by CIRS, Inc was 1.457 mm/μs at , whereas the estimate from the inverse scattering image (left) was 1.453 mm/μs. The average speed of the 3 “cysts” was determined from an independent sample at 30° to be 1.509 mm/μs, and from the inverse scattering image to be 1.514 mm/μs. The background polyurethane medium had a speed of 1.404 mm/μs as determined from the independent sample from CIRS, and 1.418 from the inverse scattering image. These variations represented from 0.25% to 1% variation in sound speed.
DISCUSSION AND CONCLUSION
Note that there is reason to doubt the quantitative accuracy of the images when 2D models are used. Energy impinging on a near-spherical cyst or fibroadenoma with higher speed of sound internally than the surrounding fat tissue will tend to refract energy up and away from the receiver array on the opposite side of the water bath. Consequently, this energy, not being received, is interpreted by the 2-D algorithm as being lost due to attenuation, since the algorithm knows nothing of the third (vertical) dimension, consequently the attenuation coefficient will be artificially inflated. The full 3D algorithm will be able to account for energy lost to refractive effects in the third dimension. This is evidenced by the fact that for the 2-D algorithm extending the number of iterations in the Ribiere-Polak inversion, led to extremely high values (∼17 dB/cm/MHz). This will be explored in a future paper (see also Wiskin et al., 2011a,b). However, we observed that cancer had a higher attenuation than the fibroadenomas or cysts in our study.
The implicit regularization in the nonlinear CG method was employed, and a fortiori evidence indicates that this is a valuable pseudo-regularization, that future algorithms will improve upon.
Due to the long data collection time, it is only possible to collect 4 levels of data. Therefore the levels were chosen to coincide with objects of interest as viewed in accompanying mammograms. The patients’ breasts were kept stationary by tethering them painlessly in the manner described above, thus minimizing patient movement. The scan itself is very comfortable, in fact some of the patients fell asleep during the scans.
The attenuation of the water in the bath is very low, so zero was used as the background attenuation medium, with the perturbation based on that value. On the other hand the speed of sound of water at was the (non-zero) background speed used, from which the perturbation was measured. Cancers had larger attenuation than FAs in our results—more work is needed.
We conclude that the speeds are accurately reconstructed (see also Andre et al., 2009). For the reasons discussed above, we are less sure of the attenuation values, and believe that the full 3D algorithm will be required to get consistent quantitative accuracy for the attenuation.
Johnson et al. (2007) observed that cancerous lesions have consistently higher speed and attenuation values than fibro-adenomas, which in turn have higher attenuation and slightly higher speed values (∼1560–1580) than cysts (complex or simple) – (∼1530–1560) m/s. Water (∼1.509 mm/μs at ) had slightly lower speed values than these, and fat had consistently slower speed than water (∼1430–1480 m/s).
These results compared favorably with the present paper, and are compared with published data in Table TABLE I.: In particular (Scherzinger et al., 1989) is an older study that indicated that FA’s had speeds of the order 1565 m/s, i.e., higher than most breast ductal tissue (∼1519.5 m/s), but lower than our measured values for carcinomas. Our study shows that FAs give similar results (1550–1585 m/s), however, our carcinoma results are somewhat higher (1585–1630 m/s). The characteristic solid nature of FAs makes it easier to separate them from ambient tissue, whereas the spiculated character of carcinomas make them more difficult to separate from surrounding tissue completely. The results for carcinomas, therefore, may be contaminated with results from surrounding tissue in the low resolution images from Scherzinger et al. (1989).
TABLE I.
Comparison of published data for speed of sound in various breast tissue compared with present paper.
| Fat | Breast fibroglandular tissue | Fibroadenoma | Cancer - Carcinoma | cyst | Complex cyst | Temp (deg. C) | |
|---|---|---|---|---|---|---|---|
| Wiskin et al., 2011b | 1430–1460 | 1550–1575 | 1550 – 1585 | 1585 –1630 | 1520–1540 | 1530 – 1540 | 31 |
| Chang et al., 2007 | 1464.8 | NA | 1499.8 | 1530.8 | NA | NA | In vivo |
| Weiwad et al., 2000 | 1475 | 1526.8 | 1531.6 | 1527.4 | NA | NA | 23 |
| Mokhtari-Dizadji et al., 2003 | NA | 1519.5a | 1561.5a | 1564a | NA | NA | 35 |
| Scherzinger et al., 1989 | 1475 | 1522 | 1565 | 1530/1550b | 1548 | 1545 | In vivo |
Estimated from Fig. 1 of Mokhtari-Dizadji et al. (2003).
Larger value is maximum value.
Note that the Chang et al. (2007) and Weiwad et al. (2000) results for the fibroadenoma and carcinoma are consistently lower than other researchers, but both agreed that these values were significantly higher than the fat. Their methods, and those of other researchers in Table TABLE I., resulted in significantly less resolution than the present paper, consequently their speed estimates were contaminated by surrounding tissue.
The values vary with age (breast ductal tissue in one very young—19 year old—volunteer at TechniScan was very high (∼1575 m/s), but this was unusual).
It is important to note that there is no speckle in our images. Speckle is a result of the coherent nature of the insonifying acoustic energy, and not a direct representation of underlying tissue morphology. Shadowing and speckle can be used to indirectly infer tissue characteristics (such as stiffness, and attenuation), but our method produces images that give manifestly quantitative representations of stiffness (through speed of sound) and attenuation.
The density is essentially constant in our model. Further investigations could include trying to image breast density variation as well, however, our initial simulations and also Mast et al. (2001) indicate that for through transmission data, the presence or absence of density perturbations had little effect on the data (in contradistinction to reflected data, for example).
The number of views was determined empirically, although a rough estimate can be made based on the Born approximation. However, ultimately, the reconstructed images were the yardstick to determine adequate sampling in the azimuth direction.
The speed and attenuation images are real and imaginary parts of the same complex variable at each pixel, therefore, they are automatically perfectly spatially registered. Thus it is straightforward to “fuse” the speed and attenuation images. Since high attenuation and high speed images appear to have a positive correlation with cancerous lesions, this may be advantageous, and will be pursued in future publications.
The images are “MRI-like” in that they have resolution similar to an MRI and have quantitative information, even though they are made from ultrasound data. The quantitative nature of the images is unlike pulse echo ultrasound as well, where the pixel values are a function of boundaries between regions of tissue and their geometry.
These images are presently made using a small cluster (6) of Pentium computers, which were included in our prototype Breast Cancer Scanner.
A fishing line (0.3 mm), was imaged in a homogeneous phantom, and using FWHM (full width at half max), an estimated resolution of ∼1.3 mm was obtained. However, imaging strings in water only requires an algorithm that incorporates single scattering events (such as the Born approximation). In the human breast multiple scattering, refraction, and diffraction effects are ubiquitous, and make the imaging problem much harder. For a fatty breast, the phase shift across the breast can be ∼14π radians at 2 MHz, which is far beyond the Born approximation region of applicability (Slaney and Kak, 1987).
For comparison Simonetti et al. (2009, Fig. 8, p. 2962), shows the inferior resolution of ray based inversion methods as compared to a diffraction based method.
One can estimate resolution based upon the small blood vessels that can be seen continued from one level to another. One cannot be dogmatic about the resolving capability without further experiments. However, experienced radiologists and medical physicists have estimated resolution at ∼1.7 mm in the coronal view, in very inhomogeneous breasts. Clearly, the marching method (a parabolic approximation) introduces approximations that could adversely affect the image quality. Using theoretical arguments and noise free simulations the resolution at 1.5 MHz should be closer to 1.3 mm, not the ∼1.7 mm observed. See also Andre et al. (2009) for resolution estimates in the newer incarnations of this prototype.
The quantitative accuracy, apparent resolution, and relative speed of formation of the images, and the fact that the speed and attenuation images are perfectly co-registered make the initial results very promising.
ACKNOWLEDGMENTS
We thank Michael Slayton, Ph.D., President, Guided Therapy, Inc., (Mesa, AZ, a medical ultrasound prototyping company), and Paul Jaeger for the design and construction of the 256 element 1D arrays, and some of the data acquisition electronics used in the scanner prototype. We thank Computerized Imaging Reference Systems, Inc., Norfolk, Virginia for the polyurethane phantom, and Scott Olsen, Ph.D. for computational programming help and Dr. Bell of St. Mark’s Hospital.
References
- Andre, M., Barker, C., Sekhon, N., Wiskin, J., Borup, D., and Callahan, K. (2009). “Pre-clinical experience with full-wave inverse scattering for breast imaging: Sound speed sensitivity,” in Acoustical Imaging (Springer, Dordrecht, Netherlands: ), Vol. 29, pp. 73–80. [Google Scholar]
- André, M., Janée, H. S., Martin, P. J., Otto, G. P., Spivey, B. A., and Palmer, D. A. (1997). “High-speed data acquisition in a diffraction tomography system employing large-scale toroidal arrays,” Int. J. Imaging Syst. Technol. 8, 137–147. [DOI] [Google Scholar]
- Bamber, J. (1998). “Ultrasonic properties of tissues,” in Ultrasound in Medicine, edited by Duck F., Baker A. C., and Starritt H. C. (Institute of Physics Publishing, Bristol, UK: ), pp. 57–88. [Google Scholar]
- Borup, D. T., Johnson, S. A., Kim, W. W., and Berggren, M. J. (1992). “Nonperturbative diffraction tomography via Gauss-Newton iteration applied to the scattering integral equation,” Ultrason. Imaging 14, 69–85. 10.1016/0161-7346(92)90073-5 [DOI] [PubMed] [Google Scholar]
- Carson, P. L., Meyer, C. R., Scherzinger, A. L., and Oughton T.V. (1981). “Breast imaging in coronal planes with simultaneous pulse echo and transmission,” Ultrasound. Sci. 214, 1141–1143. [DOI] [PubMed] [Google Scholar]
- Chang, C. H., Huang, S. W., Yang, H.-C., Chou, Y-H, and Li, P-C. (2007). “Reconstruction of ultrasonic sound velocity and attenuation coefficient using linear arrays: Clinical assessment,” Ultrasound Med. Biol. 33(11), 1681–1687. 10.1016/j.ultrasmedbio.2007.05.012 [DOI] [PubMed] [Google Scholar]
- Colton, D., Coyle, J., and Monk, P. (2000). “Recent developments in inverse acoustic scattering theory,” SIAM Rev. 42(3), 369–414. 10.1137/S0036144500367337 [DOI] [Google Scholar]
- Duric, N., Li, C., Glide-Hurst, C., Littrup, P., Huang, L., Lupinacci, J., Schmidt, S., Rama, O., Bey-Knight, L., and Xu, Y. (2008). “Breast imaging with ultrasound tomography: Clinical results at the Karmanos Cancer Institute” (Proc. BioMedical Engineering and Informatics, IEEE Computer Soc., Washington, DC: ), Vol. 2, pp. 713–717.
- Fishman, L., and McCoy, J. (1984a). “Derivation and application of extended parabolic wave theories. I. The factorized Helmholtz equation,” J. Math. Phys. 25(2), 285. 10.1063/1.526149 [DOI] [Google Scholar]
- Fishman, L., and McCoy, J. (1984b). “Derivation and application of extended parabolic wave theories. II. Path integral representations,” J. Math. Phys. 25(2), 297. 10.1063/1.526150 [DOI] [Google Scholar]
- Gan, H., Ludwig, R., and Levin, P. L. (1995). “Nonlinear diffractive inverse scattering for multiple scattering in inhomogeneous acoustic background media,” J. Acoust. Soc. Am. 97(2), 764–772. 10.1121/1.412123 [DOI] [Google Scholar]
- Ghosh Roy, D. N., and Couchman, L. (2002). Inverse Problems and Inverse Scattering of Plane Waves (Academic Press, London: ), pp. 23–78. [Google Scholar]
- Glover, G. H. (1977). “Computerized time of flight ultrasonic tomography for breast examination,” Ultrasound Med. Biol. 3, 117–127. 10.1016/0301-5629(77)90064-3 [DOI] [PubMed] [Google Scholar]
- Greenleaf, J. F., and Bahn, R. C. (1981). “Clinical imaging with transmissive ultrasonic computerized tomography,” IEEE Trans. Biomed. Eng. BME-28(2), 177–185. 10.1109/TBME.1981.324789 [DOI] [PubMed] [Google Scholar]
- Haddadin, O., Lucas, S. D., and Ebbini, E. (1995). “Solution to the inverse scattering problem using a modified distorted born iterative algorithm,” 1995 IEEE Ultrasonics Symposium (IEEE Press, New York: ), Vol. 2, pp. 1411–1414. [Google Scholar]
- Haddadin, O., and Ebbini, E. S. (1998). “Imaging strongly scattering media using a multiple frequency distorted Born iterative method,” IEEE Trans. Ultrason. Ferroelectrics Freq. Control 45(6), 1485–1496. 10.1109/58.738288 [DOI] [PubMed] [Google Scholar]
- Hesford, A. J., and Chew, W. C. (2010). “Fast inverse scattering solutions using the distorted Born iterative method and the multilevel fast multipole algorithm,” J. Acoust. Soc. Am. 128(2), 679–690. 10.1121/1.3458856 [DOI] [PMC free article] [PubMed] [Google Scholar]
- Hohage, T. (2001). “On the numerical solution of a three-dimensional inverse medium scattering problem,” Inverse Probl. 17, 1743–1763. 10.1088/0266-5611/17/6/314 [DOI] [Google Scholar]
- Huthwaite, P., and Simonetti, F. (2011). “High-resolution imaging without iteration: A fast and robust method for breast ultrasound tomography,” J. Acoust. Soc. Am. 130, 1721–1734. 10.1121/1.3613936 [DOI] [PubMed] [Google Scholar]
- Johnson, S. A., Abbott, T., Bell, R., Berggren, M., Borup, D., Robinson, D., Wiskin, J., Olsen, S., and Hanover, B. (2007). “Non-invasive breast tissue characterization using ultrasound speed and attenuation,” in Acoustical Imaging, edited by Andre M. (Springer, Dordrecht, Netherlands: ), Vol. 28, pp. 147–154. [Google Scholar]
- Johnson, S. A., Borup, D. T., Berggren, M., Wiskin, J., and Eidens, R. (1992). “Modeling of inverse scattering and other tomographic algorithms in conjunction with wide bandwidth acoustic transducer arrays for towed or autonomous sub-bottom imaging systems,” IEEE Oceans ’92, Mastering the Oceans Through Technology (IEEE Press, New York: ), Vol. 1, pp. 294–299. [Google Scholar]
- Johnson, S. A., Borup, D. T., Wiskin, J. W., and Berggren, M. (2003). “Apparatus and method for imaging objects with wavefields,” U.S. patent 6,636,584.
- Johnson, S. A., Borup, D. T., Wiskin, J. W., Natterer, F., Wubeling, F., Zhang, Y., and Olsen, S. C. (1999). “Apparatus and method for imaging with wavefields using inverse scattering techniques,” U.S. patent 6,005, 916.
- Johnson, S. A., Zhou, Y., Tracy, M. L., Berggren, M. J., and Stenger, F. (1984). “Inverse scattering solutions by a sinc basis, multiple source moment method–Part III: Fast algorithms,” Ultrason. Imaging 6, 103–116. 10.1016/0161-7346(84)90010-5 [DOI] [PubMed] [Google Scholar]
- Lee, D., Pierce, A. D., and Shang, E. C. (2000). “Parabolic equation development in the twentieth century,” J. Comput. Acoust. 8(4), 527–637. [Google Scholar]
- Lehman, S. K., and Devaney, A. J. (2003). “Transmission mode time-reversal super-resolution imaging,” J. Acoust. Soc. Am. 113, 2742–2753. 10.1121/1.1566975 [DOI] [PubMed] [Google Scholar]
- Lin, F., Nachman, A. I., and Waag, R. C. (2000). “Quantitative imaging using a time-domain eigenfunction method,” J. Acoust. Soc. Am. 108(3), 899–912. 10.1121/1.1285919 [DOI] [PubMed] [Google Scholar]
- Mast, T. D., Nachman, A. I., and Waag, R. C. (1997). “Focusing and imaging using eigenfunctions of the scattering operator,” J. Acoust. Soc. Am. 102(2), 715–725. 10.1121/1.419898 [DOI] [PubMed] [Google Scholar]
- Mast, T. D., Souriau, L. P., Liu, D-L. D., Tabei, M., Nachman, A. I., and Waag, R. C. (2001). “A k-space method for large-scale models of wave propagation in tissue,” IEEE Trans. Ultras. Ferro. Freq. Contr. 48(2), 341–354. 10.1109/58.911717 [DOI] [PubMed] [Google Scholar]
- Mokhtari-Dizaji, M., Vahed, M., and Gity, M. (2003). “The application of discriminant analysis in differentiation of fibroadenoma and ductal carcinoma of breast tissue using ultrasound velocity measurement,” Iran. J. Radiat. Res. 1(3), p. 163. [Google Scholar]
- Natterer, F., and Wuebbeling, F. (1995). “A propagation-backpropagation method for ultrasound tomography,” Inverse Probl. 11, 1225–1232. 10.1088/0266-5611/11/6/007 [DOI] [Google Scholar]
- Norton, S. J. (2005). “The inverse-scattering problem and global convergence” J. Acoust. Soc. Am. 118(3), 1534–1539. 10.1121/1.1979407 [DOI] [Google Scholar]
- Press, W. H., Teukolsky, S., Vetterling, W., and Flannery, B. (1991). Numerical Recipes, 2nd ed. (Cambridge University Press, Cambridge, UK: ), pp. 420–424. [Google Scholar]
- Remis, R. F., and van den Berg, P. M. (2000). “On the equivalence of the Newton-Kantorovich and distorted Born methods,” Inverse Probl. 16, L1. 10.1088/0266-5611/16/1/101 [DOI] [Google Scholar]
- Scherzinger, A. L., Belgam, R. A., Carson, P. L., Meyer, C. R., Sutherland, J. V., Bookstein, F. L., and Silver, T. M. (1989). “Assessment of ultrasonic computed tomography in symptomatic breast patients by discriminant analysis,” Ultrasound Med. Biol. 15(1), 21–28. 10.1016/0301-5629(89)90128-2 [DOI] [PubMed] [Google Scholar]
- Simonetti, F., Huang, L., Duric, N., and Littrup, P. (2009), “Diffraction and coherence in breast ultrasound tomography: A study with a toroidal array,” Med. Phys. 36(7), 2955–2965. 10.1118/1.3148533 [DOI] [PubMed] [Google Scholar]
- Slaney, M., and Kak, A. (1987). Principles of Computerized Tomographic Imaging (IEEE Press, New York: ), pp. 248–259. [Google Scholar]
- Stavros, A. T., Rapp, C. L., and Parker, S. H. (2004). Breast Ultrasound, (Lippincott Williams and Wilkins, Philadelphia, PA: ), pp. 276–711. [Google Scholar]
- Tabbara, W., Duchene, B., Pichot, C., Lesselier, D., Chommeloux, L., and Joachimowicz, N. (1988). “Diffraction tomography: Contributions to the analysis of some applications in microwaves and ultrasonics,” Inverse Probl. 4, 305–331. 10.1088/0266-5611/4/2/001 [DOI] [Google Scholar]
- Weiwad, W., Heinig, A., Goetz, L., Hartmann, H., Lampe, D., Buchmann, J., Millner, R., Spielmann, R., and Heywang-Koebrunner, S. H. (2000). “Direct measurement of sound velocity in various specimens of breast tissue,” Invest. Radiol. 35(12), 21. 10.1097/00004424-200012000-00005 [DOI] [PubMed] [Google Scholar]
- Wilcox, C. H. (1993). “Ultrasonics imaging at the AIM Laboratory, University of Utah,” Proceedings of the IMACS International Symposium on Computational Acoustics, Harvard University, June 25–28, edited by Lau R. L. (North-Holland, Amsterdam: ), pp. 63–81.
- Wiskin, J., Borup, D. T., and Johnson, S. (1997). “Inverse scattering from arbitrary two-dimensional objects in stratified environments via a Green’s operator,” J. Acoust. Soc. Am. 102(2), 853–864. 10.1121/1.419908 [DOI] [Google Scholar]
- Wiskin, J., Borup, D. T., Johnson, S. A., Berggren, M., Abbott, T., and Hanover, R. (2007). “Full wave non-linear inverse scattering,” in Acoustical Imaging, edited by Andre M. (Springer, Dordrecht, Netherlands: ), Vol. 28 [Google Scholar]
- Wiskin, J., Borup, D., and Johnson, S. (2011a). “Inverse scattering: Theory,” in Acoustical Imaging, edited by Andre M. (Springer, Dordrecht, Netherlands: ), Vol. 30, pp. 57–66. [Google Scholar]
- Wiskin, J., Borup, D., Callahan, K., Parisky, Y., Smith, J., André, M., and Johnson, S. (2011b). “Inverse scattering results,” in Acoustical Imaging (Springer, Dordrecht, Netherlands: ), Vol. 30, pp. 67–74. [Google Scholar]


