

Abstract
Fibrodysplasia Ossificans Progressiva (FOP) causes extensive heterotopic bone formation due to heterozygous mutations in the glycine-serine activation domain of ACVR1 (ALK2), a bone morphogenetic protein type I receptor. Anecdotal observations of facial similarity have been made by clinicians and parents, but no objective quantitative analysis of the faces of FOP patients has ever been undertaken. We delineated the common facial characteristics of 55 individuals with molecularly confirmed FOP by analysing their face signature (face shape difference normalized against age and sex matched controls) and associated face signature graphs (with face signatures as vertices and adjacency corresponding to greatest similarity). Our analysis identified 10 affected individuals whose face signature is more homogeneous than others with FOP. This distinct subgroup showed the previously identified reduced mandible as well as newly identified features: underdevelopment of the upper orbit/supra-orbital ridge; infra-orbital prominence; and, low-set ears. These findings strongly suggest that the canonical FOP mutation variably affects the postnatal morphogenesis of the normotopic cranial skeleton in the upper midface and mandible and may have important diagnostic and functional implications.
Keywords: Fibrodysplasia Ossificans Progressiva (FOP), dense surface modelling, face signature graphs, ACVR1, ALK2
INTRODUCTION
Fibrodysplasia ossificans progressiva (FOP) is a rare genetic disorder of progressive heterotopic endochondral ossification [Kaplan et al, 2005]. Except for congenital malformation of the great toes, children with FOP generally appear normal at birth. During the first decade, sporadic episodes of painful soft tissue swellings (flare-ups) erupt in characteristic anatomic patterns, and are often mistaken for tumors. Flare-ups transform skeletal muscles, tendons, ligaments, and aponeuroses into ribbons and plates of heterotopic bone that span the joints, lock them in place, and render movement impossible. Attempts to remove heterotopic bone usually lead to episodes of new accelerated bone formation. By late teens, patients become increasingly immobile and wheelchair-bound. Median life expectancy is 40 years, and patients commonly die of respiratory complications from chronic thoracic insufficiency. The prevalence of FOP is approximately one in two million and shows no racial, gender, ethnic, or geographic bias. FOP is caused by a heterozygous missense mutation in the glycine-serine activation domain of activin receptor 1A/activin-like kinase-2 (ACVR1/ALK2), a bone morphogenetic protein type I receptor [Shore et al, 2006]. Most cases are de novo, but when inheritance occurs, it follows an autosomal-dominant pattern with variable expression and complete penetrance.
Clinicians, parents and affected individuals themselves have often remarked that by adulthood there is a noticeable facial phenotype in FOP, a small mandible being the easiest recognizable feature [Kaplan et al, 2005]. In order to test these subjective observations objectively, we undertook formal dense surface and signature graph analyses of 3D photographs of a group of individuals with FOP [Hutton et al, 2003; Hammond et al, 2005; Hammond and Suttie, 2012]. Previously, studies using 3D dense surface models (DSMs) of face shape have delineated common facial features in a range of neurodevelopmental conditions, often, in addition, establishing accurate discriminating characteristics or assisting the determination of phenotype-genotype correlations [Bhuiyan et al, 2006; Cox-Brinkman et al, 2007; Hammond et al, 2004, 2005, 2007, 2008, 2010; Tassabehji et al, 2006; Tobin et al, 2008]. The face signature graph techniques are novel with FOP being the first condition to which they have been applied.
SUBJECTS AND MATERIALS
In 2007, at an international support group meeting for individuals with FOP held in Orlando, USA, facial images of 55 affected individuals (mean age: 21.9 yrs; range: 4.2 yrs to 57.2 yrs) were captured using a commercial 3D photogrammetric camera. This device captures 25,000 3D points on the face surface. All affected individuals were white European in origin, except for a small group whose racial origin was African (1), South American (2) or from the Indian subcontinent (1). For younger children, it was possible to capture images with the subject in a seated position. Because of mobility limitations in older children and adults, the images were sometimes obtained in a standing position or in situ using the individual’s mobility device (See Supplementary eFig. S1 in Supporting Information online). Occasionally, photographs were taken in a suboptimal position, e.g. with the subject bent forwards, and as a result, parts of the face were occluded or the drape of the soft facial tissues adopted a misleading shape. Poor quality images were excluded from the analysis. In addition, 387 images of unrelated, unaffected Caucasian individuals of a wide age range (3 months to 70 years) were drawn from an existing database with a view to making comparisons between the FOP group and age/sex matched controls. The study was approved by the IRB of The University of Pennsylvania.
METHODS
Image preparation
Each captured face surface was annotated manually by one individual (PH) at 24 anatomical locations: left and right endocanthion, exocanthion, palpebrale superius, palpebrale inferius, preaurale, otobasion inferius, crista philtrum, cheilion, and alare; nasion, pronasale, subnasale, labiale superius, labiale inferius and gnathion (Fig. 1A). These landmarks have previously been validated for reproducibility and accuracy [Gwilliam et al, 2006]. The landmarking and subsequent dense surface model (DSM) building were undertaken using software developed in-house [Hutton et al, 2003; Hammond et al, 2007]. The term “dense surface model” refers to the resulting set of principal components (PCs) or PCA modes accounting for the shape variation in the surfaces analyzed.
Figure 1.

A: Landmarks used in dense surface model construction; B and C: construction of reference normal (black arrow) to plane containing line exocanthion-exocanthion and reference line (red) joining mid-points of exocanthion-exocanthion and preaurale-preaurale; D: estimate of vertical displacement (white arrow) of preaurale-preaurale for an individual compared to the overall same-sex mean control (projection of broken red line on to black arrowed line); E and F: construction of diagonal face depth (double arrowed white line) to estimate mandibular underdevelopment.
DSM building
To build a DSM of a set of surfaces, the Procrustes algorithm is used to compute mean landmarks. Thin-plate splines are used to warp the surfaces to the mean landmarks so that the face surfaces can be closely aligned. The points on a selected face can then be mapped to the closest points on each face to produce a dense correspondence of tens of thousands of points across all images. An average face surface of the set is then readily computed. The differences between the positions of the densely corresponded points on each face surface and those on the overall average face are subjected to a principal component analysis (PCA). Each face surface can be resynthesized as a weighted linear sum of the PCs. The averages of the corresponding DSM weightings of any subset of the face surfaces used to build the DSM synthesize the average face of that subset. Similarity between two individual face surfaces, or between a face surface and the average face of a subset, is computed as the square root of the sum of squares of differences of the DSM weightings. Thus, we can calculate shape similarity or proximity of an individual’s face, or the mean face of one subset, to another individual, or to the mean of another subset.
Separate DSMs were computed for the full face for the male and female controls, and also for a reduced face without ears. The mean male and female control face surfaces and their associated landmarks were then exported from these models. Separate DSMs were computed for all subjects, or for male and female subsets for specific comparisons. The Procrustes aligned face surfaces and aligned landmark positions were exported from the gender restricted models and were used to assess vertical ear displacement.
Face signature graphs
Running means of 50 consecutively aged control faces were computed to provide (commonly aligned) same-sex and approximately same-aged reference faces for comparison of subgroups and the faces of individuals with FOP. The displacement along the surface normal at each point of an affected subject’s face was normalized with respect to analogous displacements at corresponding points on the 50 control faces used to compute the age-sex matched reference. For an individual face, we refer to the set of such normalized displacements of the corresponded vertices as its face signature (relative to the surface normal).
The face signature was visualised as a color heat map using red/green/blue to depict surface contraction/coincidence/expansion in the normalized comparison. For a pair of faces, we defined a metric face signature difference as the Euclidean distance between the vectors indexed by the densely corresponded vertices of the DSM and representing their face signatures. Thus face signature difference (FSD) is based on tens of thousands of 3D surface points whereas the previous face shape difference was computed from tens of PCA modes in the associated DSM. FSD is a measure of difference in morphology between two individuals after each has been normalized with respect to suitable sets of age and sex matched controls.
We calculated the face signature difference between every pair of FOP patients’ faces and constructed a graph whose vertices were the face signatures (faces, for brevity) of the FOP patients. A directed edge is then drawn from one vertex to another, possibly not unique, vertex with the smallest FSD from the first, or equivalently the most similar normalized face shape difference to the first. The existence of a link from vertex A to vertex B does not guarantee significant similarity between the faces A and B, only that B’s signature is closer to that of A than any other face in the dataset. The length of an edge between two vertices is the FSD between them. This linkage generates a set of disjoint subtrees or clusters of face signatures that partitions the FOP dataset. Note that faces of different ages and/or sex but with similar signature are potentially part of the same connected subtree or cluster.
It is natural to define the distance between two disjoint signature clusters as the shortest face signature difference between pairs of faces from the two subtrees. One cluster is then linked to another cluster by an edge (shown as a broken line) if the second is the closest, in much the same manner as face signatures are linked, joining the clusters by their closest face signatures. This process can be applied recursively to organise the original clusters into superclusters eventually producing a fully connected face signature graph. Full details of the mathematical basis and properties of face signature graphs are given elsewhere (Hammond and Suttie, 2012).
The face signature graphs were drawn using the open source GraphViz software [Ellson et al, 2002].
Coloring/Collapsing signature graphs and calculating dispersion quotients
In a signature graph containing multiple subgroups (such as FOP and controls), it is sometimes difficult to identify subgroup connectivity. A simplified version of the signature graph uses circles to represent signatures and color fills to denote membership of a particular subgroup. For the combined FOP-control signature graph, a binary coloring suffices.
To simplify further the presentation of a signature graph with multiple subgroups, we apply a graph theoretic construction called edge contraction to its colored form. This involves collapsing any edge connecting vertices of the same color and replacing the vertices by a single new vertex labelled by the number of vertices that have been collapsed into it. All edges previously connected to the two vertices involved in the edge contraction are now linked to the newly added, amalgamated vertex. This procedure is continued until all remaining edges link vertices with different colors. The circles representing the vertices of the final collapsed form are labelled by, and drawn with a radius proportional to, the number of original vertices collapsed into them. The collapsed signature graph is a much simplified version of the original and at a glance demonstrates the size of locally connected signatures in the original signature graph which were from the same group. A large number of same colored collapsed vertices of size 1 suggests the corresponding subgroup has high heterogeneity in terms of face signature variability. In contrast, a small number of “large” collapsed vertices of the same color suggests the corresponding subgroup has relatively high homogeneity.
The set of size labels of same-colored vertices in a collapsed graph indicate how a particular group has been partitioned into subsets of similar signatures. A partition {P1,..,Pk} of a set S of size n has dispersion (more generally, entropy) that is quantified as:
This dispersion measure is between 0 and 1 with extreme cases as follows:
all signatures for a particular group G (e.g., control or FOP) collapse into a single node so that k= 1, P1= G and therefore dispersion({G}) = 0;
each signature of G is connected to a signature in a different group and so k= n, pi=1 (i=1,..,n) and therefore dispersion({P1,..,Pn}) = 1.
We use the dispersion quotients of the FOP and control groups as estimates of intra-group homogeneity and inter-group difference.
Facial constructions
For the male and female mean control faces, a reference mid-line was constructed from the mid-point of the line exocanthion-exocanthion to the mid-point of the line preaurale-preaurale as well as a reference normal to the plane containing the reference mid-line and the line exocanthion-exocanthion (Figs. 1B and 1C). For each Procrustes aligned face, an analogous reference mid-line was constructed and the size and direction of its projection parallel to the reference normal was used to estimate the vertical displacement of the mean of the preaurale landmarks (Fig. 1D).
Without palpation it is difficult to place landmarks in the gonial region of the mandible or the zygomatic arch on the surface of a 3D photograph. Hence, reliable measures of overall mandible shape or size of the ramus are not possible. We constructed a line between gnathion (chin point) and the mean of the left and right lower ear attachment points and used its horizontal projection to estimate mandibular reduction (Figs. 1E and 1F).
RESULTS
Close inspection of the signature clusters identifies common traits and their penetrance
The FOP face signatures form 12 subtrees or clusters (Fig. 2). Each cluster has at its “root” a pair of signatures joined by two edges with opposing direction because each is closest to the other. Such a terminal double edge is mathematically predictable [Hammond and Suttie, 2012].
Figure 2.

Face signature clusters of FOP patients
Five clusters (1–2, 1–6, 1–8, 1–9, 1–10) contain only two signatures because each of the pair is more similar to the other than to the rest of the FOP group. The pairs of faces in clusters 1–10 and 1–2 are not strikingly similar. In 1–9, M21 and F14 show similar mandibular reduction (red on chin) and a relatively square, broad face (blue on cheeks). In 1–6, M17 and F17 display significant reduction of the perioral region (probably due to gingival hypoplasia resulting from tooth extraction occasionally performed to facilitate feeding if the jaw opening is limited). M20 and F22 (1–8) both have extremely long, gaunt faces with significant loss of facial muscle volume and adipose tissue, underdevelopment of the upper orbit and supra-orbital ridge, and significantly obtuse angle between ramus and body of the mandible. A reduced mandible is echoed in the signatures of cluster 1–12.
Of the other subtrees, 1–5 contains the largest number of faces with similar dysmorphic features. Of particular note are female individuals, F3, F10, F15 and F16, whose facial similarity was remarked on, admittedly subjectively, by several observers. In addition, M6 and M16 of 1–5 show to a lesser or greater degree the same individual features of underdevelopment of the upper orbit, prominence of the infra-orbital ridge or anterior zygomatic arch, and mandibular reduction. The faces in subtrees 1–11, 1-1 and 1–3 show intra-cluster similarity, but largely at the adjacent node level. The same is true of subtree 1–7 where the strong upper right asymmetry of F23 and F24 could be misleading due to both individuals having a fixed body posture favouring the right side that distorts the drape of the soft facial tissues.
While the face signature of the FOP group is quite heterogeneous, there is a small subgroup with considerable homogeneity
Figure 3 shows the 12 FOP clusters formed into one hypercluster by secondary edges linking “similar” clusters as described earlier. The link between clusters 1 and 7 is pivotal in that the clusters above are where the colors green and red (showing reductions) are most prevalent in the heat maps and by comparison those clusters below have a more blue-green hue emphasising larger, squarer faces. The upper cluster heat maps show frequent deficiency (red) in the upper eyelid/supraorbital region. Cluster 5 contains the most similar heat maps, emphasising deficiencies in the perioral and supraorbital regions and prominence of the anterior zygomatic arch/infraorbit. Outliers with the greatest dysmorphism tend to be leaf nodes at the extremities of the hypercluster e.g., cluster 8 and F21 of cluster 4. Those faces with the least dysmorphism tend to be more at the centre of the signature graph e.g., M2 and M12 of cluster 1.
Figure 3.

Face signature graph for FOP patients
Inevitably, a different set of clusters results when a face signature graph is constructed for the combined FOP and control groups. Figure 4 shows the resulting set of 54 clusters amalgamated into 6 hyperclusters and finally into a fully connected signature graph. We also generated a binary coloring of the full signature graph so that local connectivity of the subgroups can be more easily seen (Fig. 5). Almost all of the original 12 clusters of Fig. 2 have been dispersed because there the intra-cluster signature similarity is weaker than similarity to controls. As might be expected, the most dysmorphic individuals (e.g., new cluster 4/old cluster 8) continue to be outliers at the tips of branches. The proximity of six individuals in cluster 5 of the FOP signature graph persists and they form cluster 3 in the control-FOP signature graph because the similarity of their face signatures to one another is much stronger than their similarity to that of the controls. Notice also that FOP signatures largely appear at the periphery of the combined graph confirming in general that their signatures are more extreme than the controls i.e. there is greater facial dysmorphism in the FOP group compared to the controls.
Figure 4.

Face signature graph for controls and FOP patients
Figure 5.

Colored coded version of face signature graph for controls and FOP patients
The signature graph for the combined FOP and control groups was collapsed as described above (Fig. 6). The controls are largely collapsed into a single vertex suggesting that their face signatures are less like the FOP group than each other. Similarly, the FOP group collapses into a large number of singletons and pairs except for the subset of individuals already noted for their homogeneity who are not dispersed in this fashion. The collapsed graph induces partitions of the FOP and control signatures with respective dispersion quotients of 0.882 with 95% CI (0.874,0.890) and 0.057 with 95% CI (0.051,0.063).
Figure 6.
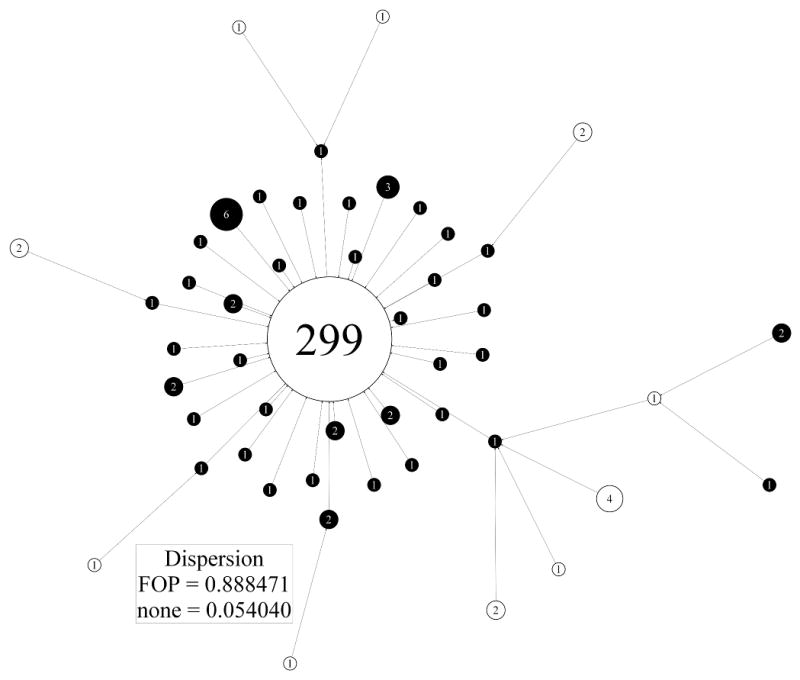
Collapsed version of face signature graph for controls and FOP patients. Control and FOP signatures are shown respectively as empty and black filled circles
Overall facial growth/size in FOP and control groups is comparable
For a DSM computed for a set of faces with wide age variation, the first mode of variation (PC1) always reflects facial growth and a plot against age follows the shape of a typical growth curve (Table 1:column 1 and Figs. 7A and Fig. 8A). The running mean of PC1 gives a reasonable indication of average facial growth over time. Most male FOP patients fall well within the control scatter with facial growth comparable to their chronological age (Fig. 7A). One non-Caucasian male individual with FOP, M19, had a significantly smaller face compared to adult Caucasian control males of a similar age. A small number of other male FOP patients show some diminished (Fig. 7A: M6, M13, M20, M23, M24) or augmented (Fig. 8A: M3, M8, M10) facial growth/size for their age. Facial growth for females with FOP is consistent with that of female controls of comparable age, with a few individuals with diminished facial growth (Fig. 8A: F7, F20 and F25).
Table 1.
Individual PCA scores and measurements for male and female FOP patients: PC1 (column 1); PC2 (column 2); horizontal mandible depth (column 3); vertical ear position (column 4).
| FEMALE
|
MALE
|
||||||||
|---|---|---|---|---|---|---|---|---|---|
| face growth (PC1) | short-long face (PC2) | horizontal mandible depth | vertical ear position | face growth (PC1) | short-long face (PC2) | horizontal mandible depth | vertical ear position | ||
| F1 | −0.2 | 0.51 | −0.82 | −0.75 | M1 | 0.26 | 0.75 | 0.91 | −1.14 |
| F2 | −0.41 | −0.16 | −1.57 | −0.3 | M2 | −0.2 | −1.24 | −0.34 | 0.71 |
| F3*** | −0.17 | 2.67** | −3.14*** | −3.83*** | M3* | 2.44* | 0.23 | −0.54 | 0.62 |
| F4* | 0.41 | −2.11* | 0.71 | 1.54 | M4 | 1.03 | −1.71 | 0.64 | 0.02 |
| F5 | −0.56 | −0.84 | −0.54 | 1.74 | M5 | −0.06 | −1.56 | −0.31 | −1.85 |
| F6 | 0.01 | 0.00 | 0.41 | −1.69 | M6*** | 0.01 | −5.12*** | −3.03*** | −4.90*** |
| F7*** | −1.03 | 3.33*** | −2.57** | −3.19*** | M7 | −1.32 | −1.48 | −0.03 | −1.59 |
| F8 | 0.62 | −1.34 | −1.54 | −0.06 | M8* | 2.09* | −1.22 | −0.01 | −1.79 |
| F9 | 0.98 | −0.22 | −0.59 | −0.94 | M9 | 0.04 | −1.24 | −0.7 | −0.24 |
| F10** | 0.73 | 1.88 | −2.55** | −2.03* | M10* | 1.51 | −2.34* | −0.79 | −0.92 |
| F11 | 0.19 | 0.53 | −0.14 | 0.48 | M11 | −0.46 | −0.29 | −0.09 | −1.41 |
| F12* | 0.00 | 1.07 | −2.27* | −1.67 | M12 | 0.04 | −1.45 | −0.89 | −1.43 |
| F13* | 0.57 | −0.98 | −0.03 | 2.45* | M13** | −0.18 | −1.71 | −1.48 | −2.76** |
| F14** | 0.8 | −2.79** | −1.74 | 1.17 | M14 | 0.62 | 1.55 | −0.15 | 1.51 |
| F15 | 0.47 | 1.17 | −1.89 | −1.09 | M15 | 0.49 | 0.15 | −0.5 | 0.13 |
| F16 | −0.31 | 0.49 | −1.87 | −0.31 | M16* | −0.04 | −1.12 | −2.19* | −1.4 |
| F17 | 0.57 | −0.88 | −1.27 | −0.39 | M17* | 0.44 | −0.26 | −1.07 | −2.00* |
| F18*** | −0.7 | −3.22*** | 0.34 | 0.6 | M18 | 0.92 | −0.06 | −1.68 | −1.27 |
| F19* | −1.08 | 2.18* | −2.41* | −0.11 | M19*** | −2.82*** | −2.45* | −1.93 | −2.67** |
| F20*** | −2.87*** | 2.22* | −4.16*** | −1.95 | M20*** | −1.43 | −6.61*** | −2.99*** | −4.44*** |
| F21*** | −0.41 | 2.89*** | −1.6 | −2.75** | M21 | −0.27 | 1.31 | −0.71 | −1.1 |
| F22*** | −0.66 | 6.19*** | −3.94*** | −4.69*** | M22** | −0.81 | 2.61** | −0.62 | 0.53 |
| F23* | 2.37* | −1.13 | 0.52 | 0.82 | M23* | −0.51 | −2.30* | −1.81 | −1.95 |
| F24 | 1.13 | −0.85 | −0.11 | −0.42 | M24* | −2.16* | −1.76 | −2.23* | −2.49* |
| F25*** | −1.71 | −0.02 | −2.96*** | −1.54 | |||||
| F26*** | 0.28 | −2.63** | −3.74*** | −1.33 | |||||
| F27 | −0.81 | 2.13* | −1.15 | 1.53 | |||||
Z-SCORES:
(p ≤ 0.05);
(p ≤ 0.01);
(p ≤ 0.005).
Figure 7.

A: For DSMmale, PC1 (in standard deviations) is plotted against age (in years). The PC1 axis is annotated with the model’s mean face morphed to its shape at −3, 0 and +3 st devs. A running mean value of PC1 for 50 consecutively aged controls approximates mean facial growth (continuous grey line). Outliers are labelled.
B: For DSMmale, PC2 (in standard deviations) is plotted against age (in years). The PC1 axis is annotated with the model’s mean face morphed to its shape at −5, −3, 0 and +3 st devs. A running mean value of PC2 for 50 consecutively aged controls approximates mean facial growth (continuous grey line).
C: For DSMmale, horizontal mandible reduction is plotted against age (in years). Outliers are labelled.
D: Normalized male vertical ear displacement (std. dev.) is plotted against age (years). Outliers are labelled.
Figure 8.

A: For DSMfemale, PC1 (in standard deviations) is plotted against age (in years). The PC1 axis is annotated with the model’s mean face morphed to its shape at −3, 0 and +3 st devs. A running mean value of PC1 for 50 consecutively aged controls approximates mean facial growth (continuous grey line). Outliers are labelled.
B: For DSMfemale, PC2 (in standard deviations) is plotted against age (in years). The PC1 axis is annotated with the model’s mean face morphed to its shape at −5, −3, 0 and +3 st devs. A running mean value of PC2 for 50 consecutively aged controls approximates mean facial growth (continuous grey line).
C: For DSMfemale, horizontal mandible reduction is plotted against age (in years). Outliers are labelled.
D: Normalized female vertical ear displacement (std. dev.) is plotted against age (years). Outliers are labelled.
FOP patients often have longer, narrower faces than age-sex matched control - males more so than females
PC2, the second mode of DSMmale and DSMfemale, captures short/wide to long/narrow face shape variation (Table 1: column 2 and Figs. 7B and 8B). At least two of the male FOP subjects have a shorter/wider face shape that can probably be attributed to their ad-mix ethnic background. Two of the male FOP patients are extreme outliers for this mode (Fig. 7B: M6 and M20). Less extreme outliers are M10, M13, M19, M23 and M24. Two thirds of the male FOP patients have a PC2 score below the running mean suggesting a longer and narrower face shape than age matched male controls.
For PC2 of DSMfemale, the most extreme female FOP outlier is not quite as severe (Fig. 8B: F22) as the two male FOP outliers of PC2 for DSMmale. As with the male FOP subgroup, there are a number of less extreme outliers (F3, F7, F10, F19, F20, F21, F27). Otherwise, the female FOP patients’ faces are spread in a more control-like way throughout the range of PC2.
Many FOP patients have a reduced mandible
Visual evaluation of the patients attending the FOP conference, and subsequently of the 3D face images captured, confirmed the previously reported small mandible. But its occurrence was not universal and in some cases the mandible was not small in width or height but retrognathic with an oblique angle between the body and ramus of the mandible. In order to validate this in an objective fashion, we computed the previously defined facial depth measure, the horizontal length of the line between gnathion and the mean of the two lower ear attachment points. When plotted against age, it follows a growth pattern similar to PC1 (Figs. 7C and 8C).
For the male FOP group, most individuals who were outliers for PC2 (with longer, narrower faces) were also outliers for reduced mandible depth (Table I: column 3 and Fig. 7C: M6, M16, M19, M20, M23, M24). More than half of the male FOP group, though, are well within the control scatter. A similar group of female outliers also displays both the longer, narrower face shape and reduced diagonal face depth (Table I: column 3 and Fig. 8C: F3, F7, F19, F20, F22, F25, F27). However, in the female FOP subgroup the vast majority of individuals show moderate or more extreme mandible reduction than age-matched controls.
Approximately 20% of the FOP patient group have significantly low set ears
During the international support group meeting, it was noticed that the ears of some FOP patients were lower set than in the general population. As this was an observation not previously made about the FOP facial phenotype, we decided to test it objectively. Low set positioning of the ears occurs in many genetic conditions but deciding on its degree can be extremely difficult, especially if other features of the craniofacial complex used for reference may have unusual location or shape. The most reliable estimates of ear position are derived from lateral head radiographs or CT images and are based on skeletal anatomy. With only soft tissue features available, we decided to use the Procrustes alignment inherent in the dense surface models to orient the faces in a uniform, objective manner and calculate the previously defined estimate of vertical displacement of ear position relative to an overall sex-specific mean. The resulting scatter plots of vertical ear displacement against age (Table I: column 4) and Figs. 7D and 8D) once again highlight the previously identified outlying individuals. Of the six male FOP patients with a downward displacement of the ears two or more standard deviations below the mean (M6, M13, M19, M20, M23 and M24), two (M6 and M20) also had extreme vertical elongation of their faces (Table I: column 4 and Fig. 7D). The adult female FOP patient with the most significantly low-set ears also shows similar vertical elongation of the face as with individuals M6 and M20.
DISCUSSION
Previous informal observation identified a small mandible and maxillary overbite as common features of the faces of individuals with FOP, especially adults. Our objective analysis of the FOP facial phenotype has applied dense surface modelling (DSM) techniques to 3D facial photographs. Typically, previous DSM based studies have concentrated on establishing discriminating differences between control and syndromic groups where the facial gestalt has already been refined. In FOP, there is no obvious homogeneous facial gestalt. Our new approach is more bottom up and involves grouping those individuals with similar face shape difference when compared to age-sex matched faces sampled from a large control population. This required us to introduce the notion of face signature of an individual face as the set of normalized differences, normal to the face surface, of the position of tens of thousands of corresponding points. A simple Euclidean metric was used to determine the distance between two face signatures. Finally, we defined the face signature graph with the set of face signatures as vertices and with adjacency defined as “closest” face signature, or in extremis, most similar facial dysmorphism.
The FOP face signature graph partitioned the patient dataset into subtrees/clusters of individuals with similar normalized face shape difference. We identified about 25% of the FOP group (Fig. 2: clusters 1–5 and 1–8; M19, F25 of cluster 1–12; and F7, F21 of cluster 1–4) to have facial morphology that involves micrognathia; vertical lengthening of the face; underdevelopment of the upper orbit/supra-orbital ridge; infra-orbital prominence; and, ears that are lower set than usual. It is important to observe that most of this subgroup are extreme outliers for the measures depicted in Figs. 7 and 8 (see also Table I). Moreover, four or five also have an almost emaciated facial appearance that itself may erroneously suggest similar facial morphology and may be related in part to poor nutrition due to ankylosis of the temporomandibular joints.
Although objective, our method for determining ear position is somewhat different from some clinical approaches or that advocated in the recent paper on standardizing morphological terminology of the ear and associated physical examinations (Hunter et al, 2009). We use the Procrustes alignment of a set of faces inherited from our shape analysis rather than a plane through inner canthi with the head in a “horizontal” position. Unfortunately, without access to skeletal morphology, every approach to external evaluation of ear position has shortcomings because of the variability of facial reference points, especially in the dysmorphic face. With a dense surface model, a morph from an individual’s face surface to an age-sex matched control mean may provide additional information to clarify difficult cases.
Mutations in ACVR1/ALK2, a bone morphogenetic protein (BMP) type I receptor, cause FOP [Shore et al., 2006] that result in dysregulated BMP signalling during development and postnatal life [Shen et al., 2009; Kaplan et al., 2009; Shore and Kaplan, 2010]. BMP signalling plays an important role in craniofacial development [Nie et al., 2006; Shuman and Gong, 2008], and in neural crest migration [Dudas et al., 2004; Minoux and Rijli, 2010]. Importantly, signalling via ACVR1/ALK2 receptors regulates normal development of a restricted set of structures from the cranial neural crest, including the midface and mandible [Dudas et al., 2004; Hu et al, 2008]. BMP4 activity has previously been shown to be elevated in FOP [Shafritz et al., 1996] and signals in part through ACVR1/ALK2 receptors [Shen et al., 2009]. BMP4 downregulates FGF-8 expression which in turn diminishes neural crest derived cell survival in the mandibular bud during embryogenesis and during subsequent mandibular outgrowth [Stottman et al., 2001]. Such cross-talk between the BMP and FGF signalling pathways could explain, in part, the frequently observed small mandible in FOP.
Bmp4 and the homeobox genes Dlx5 and Dlx6 play important roles in ear development [Chatterjee et al, 2010] and, recently, expression of Dlx5 and Dlx6 by cranial neural crest cells was shown to be necessary for correct masseter muscle development [Heude, 2010]. This complex relationship between facial muscle, ear and mandible development might be further studied in knock-in mouse models of classic FOP [Chakkalakal et al., 2010] using a combination of micro-CT and MR tomographic data from which surface renderings can be segmented.
Muscle movement has recently been suggested as being important in craniofacial development [Hall, 2010]. A recent study has reversed previous dogma to show that reduced size (and masticatory power) of jaw muscles in individuals with a long-face craniofacial morphology is the effect, rather than the cause of excessive vertical facial growth [van Spronsen, 2010]. Interestingly, retrognathia and vertical facial excess occur in some individuals with FOP. So the masticatory problems reported in some FOP patients, even before the occurrence of flare-ups in the craniofacial region, may be secondary to mandibular malformations [Renton et al., 1982; Carvalho et al., 2011].
Much of the disabling postnatal pathology of FOP affects the craniofacial region and involves disease flare-ups and resultant heterotopic ossification in the submandibular triangle [Janoff et al., 1996] and temporomandibular joints [Luchetti et al., 1996] – lesions that can affect eating, swallowing, and breathing. The specific effect of these flare-ups on the face signature is unknown, and is a fertile subject for longitudinal study in FOP patients. In conclusion, our study strongly suggests that individuals with FOP have a variably dysmorphic face signature especially in the midface and jaw, findings that are likely related to the canonical ACVR1/ALK2 mutation and that have important clinical implications for activities of daily living.
Supplementary Material
Image capture with 3D camera and subject using personal mobility device.
Acknowledgments
This work was supported in part by the International Fibrodysplasia Ossificans Progressiva Association, the Center for Research in FOP and Related Disorders, the Ian Cali Endowment for FOP Research, the Whitney Weldon Endowment for FOP Research, the Isaac & Rose Nassau Professorship of Orthopaedic Molecular Medicine, and by grants from the Rita Allen Foundation, and the US National Institutes of Health (NIH R01-AR41916). PH would like to thank Andrew Wilkie of the Wetherall Institute of Molecular Medicine in Oxford for hosting a sabbatical period during which shape signature graph techniques were developed. The CIFASD consortium and US NIH/NIAAA partly supported MS. Colleagues at UCL’s Institutes of Child Health (Phil Beales, Louisa Petchey, Pete Scambler) and Neurology (Sanjay Sisodiya) provided valuable comments and timely stimuli for the technical development.
Footnotes
The supplemental material comprises one figure.
References
- Bhuiyan Z, Klein M, Hammond P, Mannens MMAM, van Berckelaer-Onnes I, Hennekam RCM. Phenotype-genotype correlations in Cornelia de Lange Syndrome: the Dutch experience. J Med Genet. 2006;43:568–575. doi: 10.1136/jmg.2005.038240. [DOI] [PMC free article] [PubMed] [Google Scholar]
- Butts SC. The facial phenotype of the velo-cardio-facial syndrome. Int J Ped Otorhinolaryn. 2009;73:343–350. doi: 10.1016/j.ijporl.2008.10.011. [DOI] [PubMed] [Google Scholar]
- Carvalho DR, Farage L, Martins BJAF, Speck-Martins CE. Craniofacial findings in fibrodysplasia ossificans progressiva: computerized tomography evaluation. Oral Surg Oral Med Oral Pathol Oral Radiol Endod. 2011:499–502. doi: 10.1016/j.tripleo.2010.12.002. [DOI] [PubMed] [Google Scholar]
- Chakkalakal SA, Zhang D, Culbert A, Wright AC, Maidment ADA, Kaplan FS, Shore EM. The ACVR1 (R206H) mutation recapitulatesthe clinical phenotype of FOP in a knock-in mouse model. J Bone Miner Res. 2010;25(Suppl 1):S4. [Google Scholar]
- Chatterjee S, Kraus P, Lufkin T. A symphony of inner ear developmental control genes. BMC Genetics. 2010;11:68. doi: 10.1186/1471-2156-11-68. [DOI] [PMC free article] [PubMed] [Google Scholar]
- Cox-Brinkman J, Vedder A, Hollak C, Richfield L, Mehta A, Orteu K, Wijburg F, Hammond P. Three-dimensional face shape in Fabry disease. Eur J Hum Genet. 2007;15:535–542. doi: 10.1038/sj.ejhg.5201798. [DOI] [PubMed] [Google Scholar]
- Dudas M, Sridurongrit S, Nagy A, Okazaki K, Kaartinen V. Craniofacial defects in mice lacking BMP type I receptor ALK2 in neural crest cells. Mech Develop. 2004;121:173–182. doi: 10.1016/j.mod.2003.12.003. [DOI] [PubMed] [Google Scholar]
- Ellson J, Gansber E, Koutsofios L, North S, Woodhull G. Graphviz-Open Source Graph Drawing Tools. Lecture Notes in Computer Science. 2002;2265/2002:594–597. [Google Scholar]
- Gwilliam JR, Cunningham SJ, Hutton TJ. Reproducibility of soft tissue landmarks on three-dimensional facial scans. Eur J Ortho. 2006;28:408–415. doi: 10.1093/ejo/cjl024. [DOI] [PubMed] [Google Scholar]
- Hall J. Importance of muscle movement for normal craniofacial development. J Cran Surg. 2010;21:1336–1338. doi: 10.1097/SCS.0b013e3181ebcd4f. [DOI] [PubMed] [Google Scholar]
- Hammond P, Hutton TJ, Allanson JE, Campbell LE, Hennekam RCM, Holden S, Murphy KC, Patton MA, Shaw A, Temple IK, Trotter M, Winter RM. 3D analysis of facial morphology. Am J Med Genet. 2004;126:339–348. doi: 10.1002/ajmg.a.20665. [DOI] [PubMed] [Google Scholar]
- Hammond P, Hutton TJ, Allanson J, Buxton B, Campbell L, Clayton-Smith J, Donnai D, Karmiloff-Smith A, Metcalfe K, Murphy KC, Patton M, Pober B, Prescott K, Shaw A, Scambler, Smith ACM, Temple K, Hennekam R, Tassabehji M. Discriminating power of localised 3D facial morphology. Am J Hum Genet. 2005;77:999–1010. doi: 10.1086/498396. [DOI] [PMC free article] [PubMed] [Google Scholar]
- Hammond P. The use of 3D face shape modelling in dysmorphology. Arch Dis Child. 2007;92:1120–1126. doi: 10.1136/adc.2006.103507. [DOI] [PMC free article] [PubMed] [Google Scholar]
- Hammond P, Forster-Gibson C, Chudley AE, Allanson JE, Hutton TJ, Holden JJA, Lewis MES. Face-brain asymmetry in autism spectrum disorders. Mol Psych. 2008;13:614–623. doi: 10.1038/mp.2008.18. [DOI] [PubMed] [Google Scholar]
- Hammond P, Hannes F, Suttie M, Devriendt K, Vermeesch JR, Faravelli F, Forzano F, Parekh S, Williams S, McMullan D, South ST, Carey J, Quarrell O. Fine grained facial phenotype-genotype analysis in Wolf-Hirschhorn syndrome. EJHG. 2011 doi: 10.1038/ejhg.2011.135. in press. [DOI] [PMC free article] [PubMed] [Google Scholar]
- Hammond P, Suttie M. Large scale objective phenotyping of facial morphology in 3D. Hum Mut. 2012 doi: 10.1002/humu.22054. in press. [DOI] [PMC free article] [PubMed] [Google Scholar]
- Heude E, Bouhali K, Kurihara Y, Kurihara H, Couly G, Janvier P, Levi G. Jaw muscularization requires Dlx expression by cranial neural crest cells. PNAS. 2010;107:11441–11446. doi: 10.1073/pnas.1001582107. [DOI] [PMC free article] [PubMed] [Google Scholar]
- Hu D, Colnot C, Marcucio RS. Effect of bone morphogenetic protein signaling on development of the jaw. Dev Dynamics. 2008;237:3727–3737. doi: 10.1002/dvdy.21781. [DOI] [PMC free article] [PubMed] [Google Scholar]
- Hunter A, Frias JL, Gillessen-Kaesbach G, Hughes H, Jones KL, Wilson L. Elements of morphology: standard terminology for the ear. Am J Med Genet. 2009;Part A:40–60. doi: 10.1002/ajmg.a.32599. [DOI] [PubMed] [Google Scholar]
- Hutton TJ, Buxton BF, Hammond P. Estimating average growth trajectories in shape-space using kernel smoothing. IEEE Trans Med Imag. 2003;22:747–753. doi: 10.1109/TMI.2003.814784. [DOI] [PubMed] [Google Scholar]
- Janoff HB, Zasloff MA, Kaplan FS. Submandibular swelling in patients with fibrodysplasia ossificans progressiva. Otolaryngol Head Neck Surg. 1996:599–604. doi: 10.1016/S0194-59989670253-X. [DOI] [PubMed] [Google Scholar]
- Kaplan FS, Hume D, Westermark A, Shore EM. The Craniofacial Phenotype of Fibrodysplasia Ossificans Progressiva. Clin Rev Bone Min Met. 2005;3(3–4):209–212. [Google Scholar]
- Kaplan FS, Pignolo RJ, Shore EM. The FOP metamorphogene encodes a novel type I receptor that dysregulates BMP signaling. Cytokine Growth Factor Rev. 2009;20:399–407. doi: 10.1016/j.cytogfr.2009.10.006. [DOI] [PMC free article] [PubMed] [Google Scholar]
- Luchetti W, Cohen RB, Hahn GV, Rocke DM, Helpin M, Zasloff M, Kaplan FS. Severe restriction in jaw movement after routine injection of local anesthetic in patients who have fibrodysplasia ossificans progressiva. Oral Surg Oral Med Oral Pathol Oral Radiol Endod. 1996:21–25. doi: 10.1016/s1079-2104(96)80141-7. [DOI] [PubMed] [Google Scholar]
- Minoux M, Rijli FM. Molecular mechanisms of cranial neural crest cell migration and patterning in craniofacial development. Development. 2010;137:2605–2621. doi: 10.1242/dev.040048. [DOI] [PubMed] [Google Scholar]
- Nie X, Luukko K, Kettunen P. BMP signaling in craniofacial development. Int J Dev Biol. 2006;50:511–521. doi: 10.1387/ijdb.052101xn. [DOI] [PubMed] [Google Scholar]
- Renton P, Parkin SR, Stamp TCB. Abnormal temporomandibular joints in fibrodysplasia ossificans progressiva. Br J Oral Surg. 1982;20:31–38. doi: 10.1016/0007-117x(82)90004-x. [DOI] [PubMed] [Google Scholar]
- Shafritz AB, Shore EM, Gannon FH, Zasloff MA, Taub R, Muenke M, Kaplan FS. Overexpression of an osteogenic morphogen in fibrodysplasia ossificans progressiva. N Engl J Med. 1996;335:555–561. doi: 10.1056/NEJM199608223350804. [DOI] [PubMed] [Google Scholar]
- Shen Q, Little SC, Xu M, Haupt J, Ast C, Katagiri T, Mundlos S, Seemann P, Kaplan FS, Mullins MC, Shore EM. The fibrodysplasia ossificans progressiva R206H ACVR1 mutation activates BMP-independent chondrogenesis and zebrafish embryo ventralization. J Clin Invest. 2009;119:3462–3472. doi: 10.1172/JCI37412. [DOI] [PMC free article] [PubMed] [Google Scholar]
- Shore EM, Kaplan FS. Inherited human diseases of heterotopic bone formation. NatureRev Rheumatol. 2010;6:518–527. doi: 10.1038/nrrheum.2010.122. [DOI] [PMC free article] [PubMed] [Google Scholar]
- Shore EM, Xu M, Feldman GJ, Fenstermacher DA, Cho TJ, Choi IH, Connor JM, Delai P, Glaser DL, LeMerrer M, Morhart R, Rogers JG, Smith R, Triffitt JT, Urtizberea JA, Zasloff M, Brown MA, Kaplan FS. A recurrent mutation in the BMP type I receptor ACVR1 causes inherited and sporadic fibrodysplasia ossificans progressiva. Nat Genet. 2006;38:525–527. doi: 10.1038/ng1783. [DOI] [PubMed] [Google Scholar]
- Shuman JB, Gong S-G. RNA interference of BMP-4 and midface development in postimplantation mouse embryos. Am J Orthod Dentofacial Orthop. 2007;131:447.e1–447.e11. doi: 10.1016/j.ajodo.2006.11.016. [DOI] [PubMed] [Google Scholar]
- Stottmann RW, Anderson RM, Klingensmith J. The BMP antagonists chordin and noggin have essential but redundant roles in mouse mandibular outgrowth. Dev Biol. 2001;240:457–473. doi: 10.1006/dbio.2001.0479. [DOI] [PubMed] [Google Scholar]
- Tassabehji M, Hammond P, Karmiloff-Smith A, Thompson P, Durkin ME, Thorgeirsson S, Metcalfe K, Rucka A, Hutton T, Hogan T, Stewart H, Read A, Maconochie A, Donnai D. GTF2IRD1 in craniofacial development of humans and mice. Science. 2006;310:1184–1187. doi: 10.1126/science.1116142. [DOI] [PubMed] [Google Scholar]
- Tobin JL, DiFranco M, Eichers E, May-Simera H, Garcia M, Yan J, Justice M, Briscoe J, Mayor R, Lupski JR, Hammond P, Beales PL. Defects of Shh transduction and neural crest cell migration underlie craniofacial dysmorphology in Bardet-Biedl syndrome. PNAS. 2008;105:6714–6719. doi: 10.1073/pnas.0707057105. [DOI] [PMC free article] [PubMed] [Google Scholar]
- Van Spronsen PH. Long-face craniofacial morphology: cause or effect of weak masticatory musculature. Sem Orthod. 2010;16(2):99–117. [Google Scholar]
Associated Data
This section collects any data citations, data availability statements, or supplementary materials included in this article.
Supplementary Materials
Image capture with 3D camera and subject using personal mobility device.