

Abstract
The increasing number of experimental studies on second language (L2) processing, frequently with English as the L2, calls for a practical and valid measure of English vocabulary knowledge and proficiency. In a large-scale study with Dutch and Korean speakers of L2 English, we tested whether LexTALE, a 5-min vocabulary test, is a valid predictor of English vocabulary knowledge and, possibly, even of general English proficiency. Furthermore, the validity of LexTALE was compared with that of self-ratings of proficiency, a measure frequently used by L2 researchers. The results showed the following in both speaker groups: (1) LexTALE was a good predictor of English vocabulary knowledge; 2) it also correlated substantially with a measure of general English proficiency; and 3) LexTALE was generally superior to self-ratings in its predictions. LexTALE, but not self-ratings, also correlated highly with previous experimental data on two word recognition paradigms. The test can be carried out on or downloaded from www.lextale.com.
Keywords: English vocabulary test, Self-ratings of proficiency, Second language
Introduction
In recent years, cognitive scientists have become increasingly interested in how bilingual speakers process words, phrases, and sentences in their second language (L2). In psycholinguistic studies involving L2 speakers, however, a problem arises that is virtually absent in monolingual research—namely, the enormous variability of the participants’ proficiency levels and, in particular, of levels of vocabulary size, even within learner groups exposed to relatively homogeneous learning conditions. Such differences are important because many, if not all, processes within the L2 system have been found to change fundamentally—quantitatively, but also qualitatively—with variable levels of proficiency. For instance, on the neurocognitive level, neuroimaging and ERP studies have demonstrated that the patterns of brain activation of highly proficient L2 speakers very much resemble those of native speakers, while those of less proficient speakers do not (for reviews, see Abutalebi, 2008; Kotz, 2009). Within the field of word processing in L2, the focus of the present study, different patterns of effects have been observed for high- versus low-proficient speakers in translation production and recognition (Prior, MacWhinney, & Kroll, 2007; Talamas, Kroll, & Dufour, 1999), spoken word processing (Blumenfeld & Marian, 2007), and phonological processes in word reading (Haigh & Jared, 2007; Jared & Kroll, 2001).
Given the central role of proficiency— or vocabulary knowledge, in the case of single word processing—in L2 research, it is alarming how little consensus there is on how to measure it. Most bilingual studies within experimental psychology rely on participants’ self-ratings of proficiency and language background questionnaires as the only source of proficiency information. In contrast, those researchers that do attempt to measure L2 aptitude more objectively are confronted with an enormous number of (commercial or noncommercial) tests, subtests, and measures, most of which have never been adapted or validated for the experimental situation. To illustrate this scattered picture, Table 1 gives an overview of the measures used in all studies concerned with adult L2 word processing in a broader sense, with English as L2, published in top experimental psychology journals with an impact factor of above 2.0 (according to Web of Science) between 2009 and the present.1
Table 1.
Proficiency measures in studies on L2 (English) word processing in top experimental psychology journals since 2009, with objective measures printed in bold
| Article | Topic | Task | “Proficiency” Measure |
|---|---|---|---|
| Canseco-Gonzalez et al., (2010) | cross-language competition in auditory lexical access, role of age of L2 acquisition | visual world paradigm | “phone screening,” language background questionnaire |
| Chambers and Cooke, (2009) | lexical competition in L2 speech comprehension, role of proficiency | visual world paradigm | language background questionnaire and self-ratings of proficiency |
| Dijkstra, Miwa, Brummelhuis, Sappeli, and Baayen, (2010) | visual word recognition of cognates | lexical decision, language decision, progressive demasking | language background questionnaire |
| Elston-Güttler and Gunter, (2009) | processing of interlingual homographs, role of proficiency | sentence reading (incl. ERPs) | language background questionnaire and self-ratings of proficiency |
| FitzPatrick and Indefrey, (2010) | lexical competition in L2 speech comprehension | sentence listening (incl. ERPs) | 50 items of Oxford Placement Test and LexTALE |
| Fontes and Schwartz, (2010) | cross-language influence on representation of homonyms | sentence generation | language background questionnaire and self-ratings |
| Leonard et al., (2010) | spatiotemporal dynamics of bilingual word processing | size judgment task on words and pictures | self-ratings of proficiency |
| Libben and Titone, (2009) | processing of interlingual homographs and cognates in sentences | sentence reading (incl. eye movement recordings) | language background questionnaire and self-ratings of proficiency |
| Liu, Guo, and Peng, (2009) | neural organization of L1 and L2 production | L1 and L2 picture naming | self-ratings of proficiency |
| Macizo, Bajo, and Cruz Martin, (2010) | processing of interlingual homographs | word relation judgments | language background questionnaire and self-ratings of proficiency |
| Midgley, Holcomb, and Grainger, (2009) | time-course of form and meaning activation during L2 word recognition | visual word identification (animal name detection) | language background questionnaire and self-ratings, L2-L1 translation of experimental items |
| Ota, Hartsuiker, and Haywood, (2009) | L2 recognition of near-homophones | semantic relationship judgment | language background questionnaire |
| Palmer, van Hooff, and Haavelka, (2010) (Exp. 1) | word–concept mapping in bilingual memory | translation recognition and ERPs | language background questionnaire and self-ratings of proficiency |
| van der Meij, Cuetos, Carreiras, and Barber, (2011) | language switching, role of proficiency | sentence reading (incl. ERPs) | in-house English aptitude test (60 multiple-choice questions on grammar and vocabulary) |
| Verhoef, Roelofs, and Chwilla, (2010) | language switching | picture naming with language switching (incl. ERPs) | language background questionnaire and self-ratings of proficiency |
| White, Melhorn, and Mattys, (2010) | segmentation in speech processing | lexical decision with cross-modal form priming | DIALANG test |
| Winskel, Radach, and Luksaneeyanawin, (2009) | effect of interword spaces in L1 and L2 | sentence reading (incl. eye movement recordings) | Word Comprehension Antonyms and Synonyms subtests of the Woodcock Reading Mastery Tests–Revised |
| Zhou, Chen, Yang, and Dunlap, (2010) | homophone priming, role of proficiency | naming, lexical decision | Mix of TOEFL / Graduate Record Examination (GRE) / Test for English Majors (TEM) / College English Test 4 (CET4) |
Table 1 shows that among the 18 listed studies, only 5 used an objective aptitude test that was independent of the experiment itself (marked in bold), but all of these five measures were different from each other. The other 13 studies, including 2 that explicitly aimed to study the potentially modulating role of proficiency, relied on varying versions of self-ratings and language background questionnaires, the validity of which has only rarely been tested (for an exception, see Marian, Blumenfeld, & Kaushanskaya, 2007). Apparently, the currently available tests are too costly, impractical, unknown, or inaccessible for researchers to use, or it may be widely believed that biographical reports and self-rated proficiency scores are sufficient to capture differences in language aptitude. However, whether the latter is the case remains questionable (Delgado, Guerrero, Goggin, & Ellis, 1999; Lemmon & Goggin, 1989); furthermore, the validity of self-ratings seems to be affected by additional factors, such as whether they are acquired before or after further language tests or the main experiment (Delgado et al., 1999), a procedural detail that is not standardized across psycholinguistic L2 experiments.
From this, it becomes clear that a practical and valid approach is needed to measure the relevant aspects of proficiency in a quick and easy manner and, if possible, to reach some standardization across different research groups. This article focuses on the measurement of L2 vocabulary knowledge, which is especially relevant to the field of single-word processing in bilinguals but is probably also relevant to most other domains of L2 processing. As such a measure, for medium to highly proficient speakers of L2 English, we are proposing a simple and short yes/no vocabulary test called LexTALE (Lexical Test for Advanced Learners of English). Since English is developing to be the world’s primary lingua franca, it is probably also the world’s most important L2, and a substantial part of L2 studies are carried out with English as the target language (see also Table 1). Thus, while the need for comparable test methods for a broader range of languages is undisputed, a starting point will be to investigate whether such a short yes/no vocabulary test is a valid measure of vocabulary knowledge in English.
LexTALE takes only 5 min to complete, is free and easily implemented (on the Internet at www.lextale.com, as a lexical decision task in experimental software, or even on paper), making it a practically feasible addition to any psycholinguistic experiment. The target population of the test is adult learners who started learning English at school at an age of about 10–12 years, which is standard in many countries, and who continue to use English in daily life—for example, at a university or through the media. Such high-proficient, but “unbalanced” bilinguals are the population of interest in many experimental bilingual studies (e.g., Broersma, 2010; de Groot, Borgwaldt, Bos, & van den Eijnden, 2002; Lemhöfer et al., 2008; Ota, Hartsuiker, & Haywood, 2009). Given the large number of L2 studies that use self-ratings as the only measure (see Table 1), a further important question will be how the validity of the LexTALE test compares with that of self-ratings.
Within the language testing literature, yes/no vocabulary tests have been proposed as easy alternatives for multiple-choice tests (Meara & Buxton, 1987) or for student placement (Meara & Jones, 1988). Several studies have compared the yes/no tests with the more widely used Vocabulary Levels Test (Nation, 1990), in which words have to be matched with their definitions. The results were mixed: For instance, Cameron (2002) did not find significant correlations between the two test types, while Mochida and Harrington (2006) reported high correlations of above .80. These conflicting results might be due to differences regarding the level of proficiency of participants or the specific item selection of the two tests.
Given the lack of a widely recognized, standard test for English vocabulary knowledge that we could use as an external criterion to validate LexTALE and self-ratings, we will assess word translation performance, both from L1 to L2 (English) and vice versa, as an external, highly face-valid (i.e., valid by common sense) criterion against which LexTALE and self-ratings will be validated. Word translation has occasionally been used as a proficiency criterion in L2 studies, either as a proficiency/vocabulary knowledge measure (Rossi, Gugler, Friederici, & Hahne, 2006) or, administered after the experiment and using the same stimuli, as an indicator of whether the stimuli in the experiment were known to the participants (e.g., Brysbaert, van Dyck, & van de Poel, 1999; Midgley, Holcomb, & Grainger, 2009). While the latter certainly provides valuable additional information on the data obtained in the previous experiment, word translation is not very practical as a standard measure of vocabulary: It requires a close and time-consuming inspection of the responses to distinguish mere spelling and typing mistakes from real translation errors, and which responses are counted as correct depends to some extent on subjective judgment. Furthermore, a word that is easily translated into one language might be hard to translate in another (e.g., because of several possible translations; Prior et al., 2007). In spite of these shortcomings that make translation inappropriate for standard vocabulary tests, we will use it in the present experiment as criterion, first because of the lack of a widely recognized standardized test for vocabulary size, and second because the ability to translate a word probably represents most closely what is generally understood by knowing a word in a foreign language.
Besides the translation task as the main criterion for vocabulary knowledge, we also included a more general proficiency test of English to examine its relationship with LexTALE. While it seems unlikely that a brief vocabulary test like LexTALE can measure general English proficiency accurately, it is possible that it captures a part of it. Proficiency certainly entails many higher-order skills, but vocabulary knowledge should surely be a part of it too (see, e.g., Qian, 2002, and Stæhr, 2009, for the relationship between vocabulary knowledge and reading or listening comprehension). In case of a significant relationship between LexTALE and general proficiency level, LexTALE could be used as a rough indication of proficiency when no other, more accurate measure is available, as is the case in most psycholinguistic L2 experiments. Given the restrictions of a one-session online study, we chose the Quick Placement Test (2001; QPT) as a test for general proficiency level. As a commercial test, it has been validated on several thousand students (Quick Placement Test, 2001) and is used by universities and adult education institutions to assign students to English course levels or as an admission requirement for academic programs taught in English. It is also occasionally used for proficiency assessment in L2 studies (e.g., Hawkins et al., 2006); however, with a test duration of up to 45 min (15 min on average), and not being free, it is both too long and too costly to serve as a standard tool in psycholinguistic studies. Note that with the QPT being a mere placement test, it cannot be claimed that the QPT measures English proficiency with great accuracy, but it should certainly provide an approximate estimate for proficiency.
We will investigate two issues: first, the relationship between LexTALE and translation performance and, second, the relationship between LexTALE and scores on the QPT, in comparison with self-ratings of proficiency. These self-ratings were assessed separately for writing, reading, listening, and speaking proficiency, as many questionnaires do. This part of this study, including LexTALE, word translation, the QPT, and self-ratings, was carried out as an online study with two populations with very different native language backgrounds—namely, participants in the Netherlands and in Korea. Using a group of participants with very mixed first language (L1) backgrounds was not possible because it would have made the use of a translation task impossible. However, we felt that the validity of LexTALE should be assessed for more than only one specific speaker group and, thereby, rule out that it “works” for one particular L1 only. If there are differences in the usefulness of LexTALE for speakers of different L1s, these should emerge in the comparison of these two very distant speaker groups (for a similar reasoning, applied to the age-of-arrival–proficiency relation, see Hakuta, Bialystok, & Wiley, 2003).
In a second part of this study, we investigated how well LexTALE predicts participants’ performance in two experimental word recognition paradigms, again in comparison with self-ratings. Since LexTALE is especially tailored to the needs of psycholinguistics experimenters, it should be closely related to performance in word recognition tasks that are typically used in experimental studies. To this end, we reanalyzed the data of two earlier studies, those of Lemhöfer and Dijkstra (2004) and Lemhöfer et al. (2008), in which both LexTALE and rating scores were collected. The first of these studies made use of the lexical decision task, while the latter employed a version of a visual word identification task, the progressive demasking (PDM) paradigm. The lexical decision task is both one of the most widely used tasks in psycholinguistics and the task that is most similar to the procedure in LexTALE itself. The PDM, on the other hand, employs a very different method and might tap into different processing levels than the LexTALE test. The results will show whether LexTALE scores are correlated to participant performance in these two very different experimental paradigms.
Method
Participants
Seventy-two native speakers of Dutch (58 female) and 87 native speakers of Korean (31 female) participated in this study for a small fee. The Dutch participants were recruited from the participant pool of the Max Planck Institute for Psycholinguistics—for the greatest part, consisting of students at Radboud University Nijmegen (the Netherlands). The Korean participants were students at Hanyang University, Seoul (Korea).
We assumed that, due to the frequent exposure that Dutch students have to English (at school, at a university, in the media, and in daily life) and the common Germanic roots of the two languages, proficiency in English would be higher in the Dutch than in the Korean sample. To obtain groups as comparable as possible, we therefore selected Korean participants on the basis of their TOEIC® (Test of English for International Communication™) scores, an English comprehension test including reading and listening comprehension that is widely used in Korea. Korean students with a self-reported TOEIC score of at least 750 were recruited, which corresponds to the graduation requirement for students of English at several leading universities in Seoul. Furthermore, a score of 750 or above corresponds to the upper 23% of all TOEIC scores obtained by Korean participants in 2007 (TOEIC newsletter, 2008). After participation, Korean participants were asked to provide proof (i.e., certificates) of their self-reported scores. Seventy of the 87 participants did so, which is why we have reliable TOEIC scores only for that subset of the Korean participant sample. The mean (self-reported as well as verified) TOEIC score of our participants was 887 (see Table 2 for more details).
Table 2.
Results of the individual test parts in the two participant groups
| Dutch Participants | Korean Participants | ||||
|---|---|---|---|---|---|
| Test Part | Variable | Mean (SD) | Range | Mean (SD) | Range |
| LexTALE | Hit rate in % | 68.1 (17.5) | 25–100 | 72.9 (13.4) | 27–100 |
| False alarm rate in %* | 17.1 (17.0) | 0–25 | 42.2 (24.6) | 0–95 | |
| % correct av * | 75.5 (12.5) | 53–98 | 65.3 (10.3) | 46–89 | |
| ΔM* | .34 (.41) | -.74–.95 | -.07 (.47) | -1.34–.76 | |
| I SDT* | .54 (.23) | .07–.95 | .33 (.20) | -.08–.79 | |
| Translation | % correct in L1–L2 translation | 60.9 (21.0) | 13–97 | 61.8 (14.8) | 23–97 |
| % correct in L2–L1 translation | 48.1 (23.3) | 10–100 | 49.8 (17.1) | 20–87 | |
| Combined % correct | 54.5 (21.3) | 15–95 | 55.8 (18.1) | 22–92 | |
| QPT | % correct in QPT* | 76.8 (11.8) | 45–97 | 64.1 (8.9) | 33–85 |
| LBQ | age in years* | 21.9 (3.5) | 18–37 | 23.2 (2.7) | 18–38 |
| no. of years experience with English* | 7.5 (1.6) | 5–16 | 11.3 (3.9) | 3–25 | |
| age of English onset | 10.8 (1.1) | 8–13 | 11.2 (2.8) | 5–17 | |
| hours/week reading English* | 7.1 (7.8) | 0–40 | 9.4 (4.5) | 2–22 | |
| hours/week speaking English | 1.3 (3.9) | 0–20 | 1.3 (1.8) | 0–10 | |
| hours/week of English radio/TV* | 5.5 (6.5) | 0–40 | 3.2 (6.0) | 0–35 | |
| hours/week of English lectures | 1.9 (6.0) | 0–44 | 2.7 (3.2) | 0–15 | |
| total hours of English /week (sum of previous four values)* | 15.8 (19.5) | 0.5–144 | 10.7 (11.9) | 0–72 | |
| self-reported TOEIC score | – | – | 887 (44) | 780–990 | |
| proven TOEIC scorea | – | – | 887 (40) | 725–990 | |
| Self-ratings of proficiency (1–7) | Reading experience* | 5.5 (1.1) | 3–7 | 4.9 (0.9) | 2–7 |
| Writing experience | 4.2 (1.2) | 2–7 | 3.8 (1.2) | 1–6 | |
| Speaking experience | 4.3 (1.2) | 2–7 | 4.1 (1.4) | 1–7 | |
| Listening experience | 5.2 (1.4) | 2–7 | 4.9 (1.1) | 2–7 | |
| Median of all four ratings | 4.5 (1.2) | 2–7 | 4.3 (1.2) | 1–7 | |
| Mean of all four ratings* | 4.8 (1.0) | 2.8–7.0 | 4.4 (0.9) | 2.3–6.5 | |
Note. Variables with significant differences between Dutch and Korean participants, as revealed by two-tailed t-tests (p < .05), are marked with an asterisk.
QPT = Quick Placement Test, LBQ = language background questionnaire.
aAvailable for a subset of 70 Korean participants only.
Participants were, on average, 21.9 (Dutch) and 23.2 (Korean) years old and reported having grown up monolingually. Most had started learning English in elementary or high school. Seven of the Dutch and 24 of the Korean participants stated that they had started learning English before the start of English education at school. Further characteristics of the two participant groups with respect to background in English, as reported in a language background questionnaire, will be given in the Results section.
General procedure
The experiment was an online study that participants carried out at home or on a public computer. We opted for this form of study because it enabled us to test a much larger number of participants than when using a “conventional” experimental setting. The study consisted of five parts assessing different aspects of English skills (the LexTALE test, translation from L1 to L2, translation from L2 to L1, the QPT, and self-ratings of English proficiency), which will be described separately in the following sections. In a general instruction appearing on the screen before the test parts, participants were told that the aim of the study was to evaluate different sorts of tests and test items in order to develop a new English test and that they should answer the questions conscientiously, even though the level of difficulty might be quite high. All instructions throughout the experiment were given in the participants’ native language (Dutch or Korean). Participants were given the choice as to whether they would like to receive their personal scores and ranks relative to the other participants after data analysis. The five test parts and the items within each test part were presented in the same order to all participants.
Part 1: LexTALE
Materials
LexTALE consists of 60 items (40 words, 20 nonwords) selected from the 240 items of an unpublished vocabulary size test (called “10 K”) by P. Meara and colleagues (Meara, 1996). Both the 10 K and our subset of it contain twice as many words as nonwords. The reason for this “unbalanced” proportion is that the words are so low in frequency that it is unlikely that any of the participants will know them all (turning a considerable number of the word items into subjective nonwords). To make the subjective proportions of words and nonwords more equal, a higher number of words than nonwords is included.
The 60 out of 240 items were selected on the basis of a pilot study with 18 Dutch participants from the same population as that in the final experiment. These 18 participants made a word/nonword decision on all 240 items. Separately for words and nonwords, four categories of difficulty were formed, based on percentage of correct scores. For each item, the item–whole correlation (item discrimination) was calculated, as an indicator of how well an item discriminates good from poor total performance. Of each of the four difficulty categories, the 25% with the highest item–whole correlations were selected for the LexTALE. This way, LexTALE is comparable in difficulty with the original 10 K but optimized with respect to the discriminative power of the items.
The items of the LexTALE are between 4 and 12 letters long (mean: 7.3). The 40 words have a mean frequency of between 1 and 26 (mean: 6.4) occurrences per million according to the CELEX database (Baayen, Piepenbrock, & Gulikers, 1995). Fifteen of the words are nouns, 12 are adjectives, 1 is a verb, 2 are verb participles, 2 are adverbs, and 8 can belong to two different syntactic classes (e.g., both a verb and a noun, such as dispatch). The nonwords are orthographically legal and pronounceable nonsense strings created either by changing a number of letters in an existing word (e.g., proom) or by recombining existing morphemes (e.g., rebondicate). None of the nonwords are existing words in Dutch or Korean. All items are listed in Appendix A.
Procedure
Participants received written instructions that they were going to be shown a series of letter strings, some of which were existing English words and some of which were not. They were asked to indicate for each item whether it was an existing English word or not, by pressing either the “y” key (for yes) or the “n” key (for no). In case of doubt, participants were instructed to respond no. The instructions also explained that the task was not speeded and that the spelling of the items would be British.2 Finally, they asked participants explicitly not to look the items up in a dictionary, because the data would otherwise not be informative.
Items were presented one by one on the screen. The order of items was fixed, such that no more than five words or nonwords appeared in a row. On average, the LexTALE in our study took 3.5 min to complete (SD = 1.15 min).
Scoring
There are several possible methods to score yes/no tests. We employed three different ones. The first one is a simple percentage correct measure, but corrected for the unequal proportion of words and nonwords by averaging the percentages correct for these two item types. This way, a yes bias (creating high error rates in the nonwords) would be “penalized” in the same way as a no bias would (causing high error rates for words), independently of the different numbers of words versus nonwords. We will call this measure % correctav (averaged % correct). The second measure was ΔM, proposed by P. Meara as a scoring method for yes/no vocabulary tests (Meara, 1992). ΔM lies between 0 and 1 and is supposed to represent the proportion of words (within the given range of word frequency) that is known by the participant. Guessing is corrected for by an additional “penalty” for false alarms (i.e., nonwords responded to with yes) in the calculation of the score. The formula for calculating ΔM is presented in Appendix B. The third scoring method called ISDT is supposed to overcome some shortcomings of ΔM and has been developed by Huibregtse, Admiraal, and Meara (2002). It is based on signal detection theory (SDT) and corrects for both guessing and personal response style (e.g., bias toward yes or no responses). The formula for calculating ISDT can also be found in Appendix B.
Part 2: L2 (English)–L1 (Dutch/Korean) translation
Materials
Thirty English nouns3 were selected from the number-of-translations norms for English–Dutch by Tokowicz, Kroll, de Groot, and van Hell (2002). Given that the present study aimed at assessing English skills in advanced speakers, the usage of the norms enabled us to select words with an already established high level of translation difficulty (for native speakers of Dutch, but probably also for speakers of other L1s). Only words with no more than three different translations according to the norms were selected. To achieve a high level of difficulty, all items had translation error rates (including omissions) of at least 50% in the Tokowicz et al. study. The mean error rate for our item set in Tokowicz et al. was 60.5% (SD = 17.2), the mean number of different translations in the norms was 1.13 (SD = 0.6), and the average frequency according to the CELEX database (Baayen et al., 1995) was 18.5 occurrences per million (SD = 14.7). All items are listed in Appendix A.
Procedure
Participants saw a new instruction on the screen, telling them that in each trial they would see an English word and that they were to type its translation (or one of them, if they knew several) in the designated field. When they did not know the translation of an item, they were instructed to type a question mark. The next word appeared after the participant had pressed the Enter button.
Scoring
For scoring, the English–Dutch translations and all translations given in the Tokowicz et al. (2002) norms, as well as those listed by the Van Dale English–Dutch dictionary (Martin et al., 1984), were counted as correct responses. Furthermore, obvious spelling mistakes in the Dutch responses, as judged by the first author, were counted as correct as well (e.g., pijk instead of pijl ‘arrow’, with pijk not being a Dutch word and “k” and “l” being adjacent letters on the keyboard).
For the Korean responses, all possible translations from the Sharp electronic dictionary, model PW-K300 (containing the YBM-Sisa e4u English–Korean dictionary, the YBM-Sisa e4u Korean–English dictionary, and the Oxford Advanced Learner's Dictionary) were counted as correct. Again, obvious spelling mistakes (i.e., when the response did not form a legal Korean word, and when it deviated from one of the expected translations in only one letter feature) were counted as correct. The final score of this test part was the percentage of correct responses.
Part 3: L1 (Dutch/Korean)–L2 (English) translation
Materials
Another 30 English nouns were selected from the Tokowicz et al. (2002) norms for this test part. Their dominant Dutch translations according to the norms were used as stimuli in the Dutch–English translation task. All these Dutch nouns had three or fewer different translations, as well as error rates of above 50% according to the Tokowicz et al. norms. For the Korean–English translation task, Korean translations of the 30 English nouns were retrieved and translated back into English, using the above-mentioned dictionary. For each English noun, the Korean word that was most likely to be translated into the intended English word and that shared most aspects of its meaning according to the dictionary was selected. The mean translation error rate of the 30 Dutch nouns in the Tokowicz et al. data was 61.7% (SD = 13.9). Their mean frequency according to the Dutch part of the CELEX database was 23.3 occurrences per million (SD = 23.7); for the Korean stimuli, there are no frequency counts or translation norms available. All items are listed in Appendix A.
Procedure
Participants received a written instruction that they would now be asked to translate Dutch or Korean words into English. They were also told not to worry about spelling mistakes. The procedure was identical to that in Part 2. The mean duration of the complete translation section (L1–L2 and L2–L1 translation) was 8.0 min (SD = 2.9 min).
Scoring
In analogy to Part 2, for scoring the Dutch–English translations, all translations given in the Tokowicz et al. (2002) norms, as well as by the Van Dale Dutch–English dictionary (Martin et al., 1984), were counted as correct responses. Similarly, all alternative English translations for the Korean items, as listed in the dictionary, were regarded as correct. Again, obvious spelling mistakes and spellings that preserved the phonology of one of the target translations (e.g., speach instead of speech) were considered correct.
Part 4: Quick Placement Test (QPT)
Materials
As a general, relatively quick English proficiency test suitable for online testing, we used the QPT (2001). This test, intended for student placement, can be used to group learners in seven levels linked to the Common European Framework (CEF) for language levels, ranging from beginner to upper advanced. It assesses reading skills, vocabulary, and grammar. The full test (parts 1 and 2) takes approximately 15 min and consists of 60 multiple-choice questions with increasing levels of difficulty, including discrete multiple-choice questions and multiple-choice cloze questions (i.e., text passages with gaps that have to be filled with one of three or four alternatives). We administered both part 1, intended for all learners, and part 2, intended for advanced learners only. In part 2, the differences between the alternative responses are often very subtle (e.g., mostly, chiefly, greatly, widely), making the test difficult also for highly proficient speakers of English. Scores were obtained by calculating the percentage of correct responses.
Procedure
Participants received an instruction that informed them they would now receive multiple-choice questions, which would be the last “test” part of the study. On average, it took participants 15.0 min to complete this test part (SD = 5.6 min).
Part 5: Self-ratings and language background questionnaire
Materials
In the final part of the study, participants received questions on their history and experience with the English language. The questions assessed since when, under which circumstances, and how intensively the participants used English and how experienced they were in different language domains (reading, speaking, etc.) in their own view. The ratings of experience (“How much reading/writing/speaking/listening experience do you have with the English language?”) were to be given on a scale from 1 (very little experience) to 7 (very much experience). They were the measures we were interested in regarding their predictive power of proficiency; the other ratings were meant to obtain a detailed picture of the circumstances of the participants’ language acquisition.
Procedure
The questions appeared on the screen one by one in their native language. Some were open questions that required a response to be typed in (e.g., How many years of experience do you have with the English language?); others were yes/no or rating questions for which responses were given in a pull-down menu. No general score was calculated for this part of the study.
Results
Table 2 shows the results of the different test parts for the two participant groups. In Appendix C, a more detailed description of the score distribution of LexTALE in this and previous studies is given.
Table 2 shows that, on average, the Dutch participants scored significantly higher on the LexTALE (all three measures) and on the QPT than did the Korean participants. Furthermore, the Dutch group was younger and had fewer years of experience with English than did the Koreans. Dutch participants reported spending more time listening to English radio or watching English TV but less time reading English than did the Korean group. Finally, Dutch participants rated their reading experience significantly higher than Korean participants did, which also resulted in higher mean values of all four experience ratings.
To get an indication of test consistency across the two groups, we calculated the item intercorrelations for each test part (i.e., between the mean item performances for the Dutch and Korean groups). Because of the different response strategies in the two groups with respect to LexTALE that became apparent in the large difference in false alarm rates (to be discussed later on), we calculated these item correlations for words and nonwords separately. The results for the LexTALE showed substantial correlations that were, furthermore, of almost equal size for words and nonwords (words, r = .77; nonwords, r = .76; both ps < .001). For the translation from English into the participants’ L1, where identical stimuli were presented to both groups, the correlation was .79 (p < .001) and, thus, comparable to that of the LexTALE part. For the translation into English (L1–L2), the test involved different stimuli in Dutch and Korean, with different sets of translation alternatives into English (e.g., the Korean word for grape can also mean sidewalk or pavement, which is not the case for the Dutch translation of grape). Consequently, the correlation between the groups was lower but still significant (r = .37, p < .05). In the QPT, the correlation of item error rates for Dutch and Korean participants was .72 (p < .001), again comparable to all other test parts where identical stimuli were presented.
Relations between the test parts
Before looking at the intercorrelations between the test parts, we report the split-half reliabilities of each test part, which represents an upper limit to the between-tests correlations. Split-half reliabilities were calculated by dividing each test part into two halves, with alternately assigning consecutive items to the two test halves.4 The resulting scores for the two test parts were then correlated and corrected for their reduced length, using the Spearman–Brown formula (see Appendix B). Of course, this calculation was not possible for self-ratings, where there was only one value per participant. The reliability values are shown in Table 3.
Table 3.
Split-half reliabilities of the individual test parts in the two participant groups
| Test Part | Dutch Participants | Korean Participants |
|---|---|---|
| LexTALE | ||
| % correct av | .814 | .684 |
| ΔM | .788 | .415 |
| I SDT | .824 | .571 |
| Translation | ||
| L1–L2 translation | .905 | .765 |
| L2–L1 translation | .917 | .878 |
| Combined translation score | .951 | .908 |
| QPT | .862 | .670 |
Table 3 shows that the split-half reliabilities are generally larger for Dutch than for Korean participants. Consequently, lower intercorrelations between the different test parts are to be expected for the Korean group.
The correlations between LexTALE and self-ratings as predictors, on the one hand, and the translation, QPT, and TOEIC scores as criteria, on the other hand, are shown in Table 4. The correlation coefficients between LexTALE and the criteria are Pearson correlation coefficients; the ones involving ratings (which are ordinal data) are Spearman’s rho coefficients. Besides the median of all four ratings, which is the proper measure of central tendency for ordinal data, we also calculated their arithmetic mean, to see whether it would “work” better than the “rough” median, which can take only whole values (for a similar averaging procedure, see Chambers & Cooke, 2009). We treated this arithmetic mean rating as an interval-level variable.
Table 4.
Correlations of LexTALE and self-rating scores with translation scores for both participant groups
| Dutch Participants | Korean Participants | ||||||||
|---|---|---|---|---|---|---|---|---|---|
| L1–L2 Translation | L2–L1 Translation | Combined Translation Score | QPT | L1–L2 Translation | L2–L1 Translation | Combined Translation Score | QPT | TOEIC (Controlled)c | |
| LexTALEa: | |||||||||
| % correct av | .66** | .78** | .75** | .63** | .50** | .46** | .51** | .29** | .33** |
| Δ M | .59** | .68** | .66** | .58** | .46** | .41** | .46** | .30** | .35** |
| ISDT | .63** | .74** | .72** | .60** | .50** | .45** | .50** | .30** | .34** |
| Self-ratingsb (1–7): | |||||||||
| Reading experience | .67** | .67** | .70** | .70** | .33** | .26* | .30** | .27* | .19 |
| Writing experience | .60** | .57** | .60** | .62** | .24* | .06 | .15 | .35** | .23 |
| Speaking experience | .47** | .54** | .53** | .58** | .24* | .16 | .20 | .25* | .23 |
| Listening experience | .62** | .64** | .65** | .62** | .13 | .11 | .13 | .23** | .18 |
| Median self-rating | .62** | .63** | .65** | .64** | .22* | .11 | .17 | .34** | .25* |
| Mean self-ratinga | .68** | .70** | .72** | .74** | .31** | .18 | .26* | .40** | .23 |
Note. The highest correlation in each column is printed in bold.
aPearson correlations
bSpearman’s rho
cAvailable for 70 out of 87 Korean participants
As can be seen from Table 4, for translation, there was a fairly consistent picture for all three translation scores and both participant groups: First, among the three scoring measures for the LexTALE test, the mean percentage correct (% correct av) had the highest correlations with translation. Second, among the four individual self-ratings, reading experience had the highest correlation with translation performance. Surprisingly, however, the “illegal” measure of the arithmetic mean of all four individual rating scores almost always outperformed the other rating scores (including the median) in terms of correlations. Therefore, we will include this measure in all further calculations. Furthermore, in all cases but Dutch L1–L2 translation, the correlations between LexTALE and translation scores were higher than those between the self-ratings and translation scores.
With respect to the measures of more general English aptitude, QPT and TOEIC, the correlations of self-ratings with the QPT were comparable to those of LexTALE, with some rating scores (especially mean rating) outperforming LexTALE. However, this was not the case for TOEIC, which did not significantly correlate with self-ratings, while its correlations with LexTALE were higher and significant. This different pattern of correlations gives rise to the assumption that TOEIC might capture quite different aspects of proficiency than does QPT. Indeed, the two measures were only moderately correlated, with r = .43 (p < .001).
Table 4 also shows that all correlations were lower for the Korean than for the Dutch group, a pattern that might (partly) be due to the lower split-half reliabilities reported in Table 3.
To get a more complete picture of the data distributions, rather than mere correlations, we plotted the data with respect to LexTALE versus self-ratings as predictors and translation scores versus QPT scores as dependent variables in four scatterplots. For these plots, we selected only the best (i.e., most highly correlating) measures of each test—namely, % correct av of LexTALE, the mean rating, the combined translation score, and the (only) QPT score (Figs. 1, 2, 3 and 4).
Fig. 1.
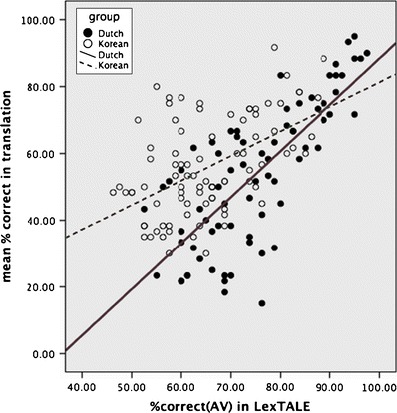
Scatterplot and regression lines of LexTALE and combined translation scores for the two participant groups
Fig. 2.
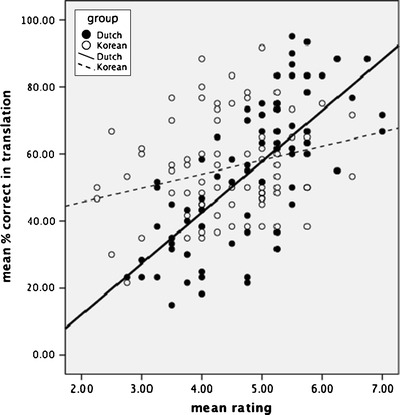
Scatterplot and regression lines of mean ratings and combined translation scores for the two participant groups
Fig. 3.
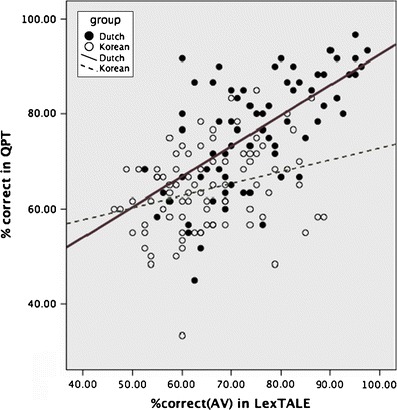
Scatterplot and regression lines of LexTALE and QPT scores for the two participant groups
Fig. 4.
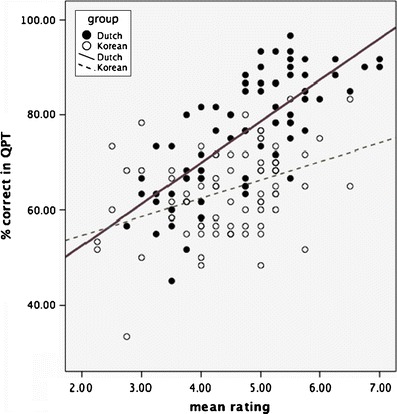
Scatterplot and regression lines of mean ratings and QPT scores for the two participant groups
Examples for practical applications
To get a better picture on the practical value of both LexTALE and self-ratings, we chose two example applications for which a proficiency measurement would typically be used in psycholinguistic experiments: First, the division of participants into two groups—namely, those with a smaller versus a larger vocabulary size—and second, the exclusion of participants below a certain proficiency threshold. We computed the “success rate” of LexTALE versus self-ratings for these two purposes.
We first analyzed how well LexTALE or self-ratings are able to divide the participants into two vocabulary size groups (relatively small vs. large vocabulary size). We did this by performing a median split both on the predictor data (% correct av of LexTALE, or mean self-ratings) and on the combined translation score as the criterion. Table 5 shows the resulting percentages of agreement between group assignments of predictor and criterion.
Table 5.
Percentages of agreement (corrected and uncorrected; see text for details) for assignment to small versus large vocabulary size groups based on LexTALE or mean rating and translation performance
| Dutch Participants | Korean Participants | |||
|---|---|---|---|---|
| Uncorrected | Corrected | Uncorrected | Corrected | |
| Agreement | Agreement | Agreement | Agreement | |
| % correct av (LexTALE) | 77.8% | 80.6% | 62.1% | 73.6% |
| Mean rating | 83.3% | 86.1% | 54.0% | 55.2% |
Inspection of these data showed that many “disagreements” arose in the area around the split criterion, where group assignment is based on differences as small as, for instance, only one item in the translation task. However, it can probably be assumed that these “average” participants can serve about equally well in any of both groups. We therefore calculated a corrected agreement measure for which we defined a range of translation scores around each group median where divergent group assignments were not counted. We set this range at 3.33% (corresponding to two items in the translation tasks) left and right of the translation median (which was 55.83% for the Dutch and 53.33% for the Korean group). Group assignments in this range were always counted as correct. The corrected agreement values are also shown in Table 5.
As can be seen from Table 5, when predicting the assignment to large versus small vocabulary size groups, mean ratings worked better for Dutch participants, whereas LexTALE was the better predictor for the Korean group. The correction, in which agreement errors close to the median (i.e., the split criterion) were not counted, mainly affected the LexTALE prediction of the Korean group. Generally, both LexTALE and mean rating median splits overlapped satisfactorily with translation groups for the Dutch participants, with agreement rates above 80%. However, only LexTALE, but not mean ratings provided a better-than-chance group split of Korean participants.
A second frequent motivation for using proficiency estimates is the intention to include only participants above a certain proficiency criterion—for example, because of the noisy or heterogeneous nature of language processes at lower levels of L2 aptitude. For instance, researchers might opt for a target group of advanced proficiency (CEF levels C1 and C2—proficient users), which is also the core target group of LexTALE. In the QPT, this corresponds to a minimum of 48 correctly answered items out of 60 (80%), a requirement which was met by 34 out of 72 Dutch and by only 4 out of 87 Korean participants. Therefore, we restricted our analysis to the Dutch group.5 We analyzed whether LexTALE or self-ratings can be used to exclude a group of participants with QPT scores below this limit.
A regression analysis showed that, on average, a QPT score of 80% corresponded to a LexTALE score of 80.5% and a mean rating of 5.16 in the Dutch group (see Appendix C for more details on the interpretation of LexTALE scores and their relation with proficiency levels). We then identified the participants above and below these criteria and again calculated the agreement rates. Furthermore, we calculated the false alarm rate—that is, the percentage of participants who would have been selected for participation on the grounds of the prediction, but who did not actually obtain the required minimum score in the QPT. Such a false alarm rate should be as low as possible in order to be useful under experimental circumstances. Table 6 shows the results of this analysis.
Table 6.
Percentages of agreement and false alarm rates (see text) in the selection of high proficient participants in the Dutch group with a QPT score above 80%, based on LexTALE versus mean ratings
| Agreement Selected/Unselected | False Alarm Rate | |
|---|---|---|
| %correct av (LexTALE) | 75.0% | 16.7% |
| Mean rating | 70.8% | 29.0% |
The selection based on LexTALE resulted in 24 selected participants, 4 of which (16.7%) were not actually high proficient on the QPT. According to the selection based on the mean ratings, 31 participants were selected, but the number of false alarms was 9 (29%). Overall, the agreement rate was larger and the false alarm rate was lower for the LexTALE prediction.
LexTALE and experimental word recognition data
To obtain evidence for the predictive value of LexTALE relative to self-ratings with respect to word recognition in experimental contexts, we reanalyzed the data of Lemhöfer and Dijkstra (2004) and Lemhöfer et al. (2008), in which the lexical decision task and the PDM paradigm were used, respectively. In both studies, the LexTALE test (although not yet called LexTALE) and almost identical self-ratings as those reported above had been completed by the participants, who were nonnative speakers of English.
In Lemhöfer and Dijkstra (2004), the visual lexical decision task contained Dutch–English homographs (false friends) and homophones (Experiment 1) or cognates (Experiment 2), together with English-only control words. Participants were Dutch students on the usual advanced level of English proficiency. Because nothing is known about a potential interaction of vocabulary knowledge (i.e., LexTALE score) and homograph and cognate effects, we examined the participants’ performance on the English-only control words and correlated it with both the LexTALE and the self-rating scores.
In the “megastudy” by Lemhöfer et al. (2008), more than 1,000 English monosyllabic words that alternated with a visual mask had to be visually recognized by participants in three sessions. Participants had German, Dutch, or French as a native language. The study also included a native English-speaking group, which we did not analyze here. Only reaction times (RTs) were included in the analyses, because error rates were generally too low to show any effects. We analyzed the sessions separately, because it was possible that a training effect accumulating across sessions obscured the potential correlation with vocabulary knowledge. The strongest correlation should be expected for the first session, since it would be least affected by training. This session would also be the most representative one with respect to most other experiments, which usually comprise one session only.
First, we calculated the intercorrelations between the mean RTs of the three sessions to learn more about their reliability. These correlations lay between .81 (session 1 vs. session 3) and .94 (session 2 vs. session 3). Thus, the RTs across sessions were quite stable.
Table 7 shows the results. Note that one rating question, that of listening experience, was not contained in the questionnaire in those studies. Therefore, the mean rating here is an average of only three individual rating responses, rather than of four, as above. However, since listening experience was never the best predictor for the criteria above, we can assume that this should not significantly deteriorate the predictive power of the ratings.
Table 7.
Correlations of experimental performance in Lemhöfer and Dijkstra (2004) (English lexical decision) and Lemhöfer et al. (2008) (English progressive demasking) with LexTALE and self-rating scores
| Lemhöfer and Dijkstra (2004) | Lemhöfer et al. (2008) | ||||||
|---|---|---|---|---|---|---|---|
| Exp. 1 | Exp. 1 | Exp. 2 | Exp. 2 | Session 1 | Session 2 | Session 3 | |
| RT | ER | RT | ER | ||||
| LexTALEa: | |||||||
| % correct av | -.47* | -.41(*) | -.52* | -.74** | -.23(*) | -.13 | -.09 |
| ΔM | -.41(*) | -.28 | -.46* | -.66** | -.22(*) | -.10 | -.06 |
| ISDT | -.45* | -.30 | -.49* | -.68** | -.21 | -.09 | -.05 |
| Self-ratingsb: | |||||||
| Reading experience | -.42(*) | -.004 | -.28 | -.42(*) | -.20 | -.12 | -.10 |
| Writing experience | -.32 | -.18 | -.20 | -.20 | -.05 | -.01 | .002 |
| Speaking experience | -.02 | -.17 | -.32 | -.48* | -.01 | -.08 | -.08 |
| Mean self-ratingc | -.31 | -.22 | -.41(*) | -.51* | -.10 | -.03 | .003 |
aPearson correlations, bSpearman’s rho, cconsisting of the above three rating values only.
Note. The highest significant correlation in each column is printed in bold. Significant correlations are marked with asterisks (** p < .01, * p < .05, (*) p < .10; two-tailed).
RT = reaction times, ER = error rates.
Table 7 shows first that for lexical decision RTs and error rates in Lemhöfer and Dijkstra (2004), LexTALE was correlated to higher degrees with the experimental measures than self-ratings were, with significant correlations between LexTALE scores and all RTs and error rates in both experiments, except for error rates in Experiment 1, where there was only a trend toward a significance in the %correct av measure (or a significance where one-tailed tests are assumed). As in the results reported above, the %correct av measure provided the highest correlations among all scoring methods for LexTALE. In contrast, only a minority of the correlations with self-ratings were significant, and which of the self-rating variables was the “best” one varied across experiments and measures. The correlations with the PDM task (Lemhöfer et al., 2008) were much lower. In two-tailed tests, none of the correlation values reached significance; however, because a negative correlation was clearly expected, one could also look at one-tailed significances. For these, the correlation of LexTALE and RTs in session 1 would reach significance (p = .036), while this was not the case for any other of the reported correlations in the PDM study. As was expected, the correlation of LexTALE and PDM RTs decreased with each proceeding session, indicating that the more practiced participants became with the task, the less vocabulary knowledge influenced their RTs. As stated above, session 1 can be regarded as most representative with respect to other experiments, because few experiments consist of as much as three (or even just two) sessions of the same task.
Discussion
The present study was carried out with the primary aim of evaluating the short yes/no English vocabulary test LexTALE as a possible means to measure English vocabulary knowledge of advanced L2 speakers of English quickly and easily. There is a great need for such a measure among researchers carrying out experiments on L2 processing. In particular, we were interested in whether LexTALE is a better predictor of vocabulary knowledge than the widely used self-ratings of proficiency (see Table 1).
It should be noted that the conditions under which the self-ratings were collected in the present study were probably extremely favorable in terms of their validity: Forming the last test part, they were administered after an extensive test battery of English on a very high level of difficulty. Such an extensive language test (even though no direct feedback was provided) probably created a fairly realistic picture of every participant’s own language skills, possibly leading to more accurate self-ratings than those obtained in most (shorter and generally easier) psycholinguistic experiments. In line with this suspicion, Delgado et al. (1999) observed lower self-ratings and differences in validity when these ratings were given after, as compared with before, an additional language test. Still, though, it is possible that there are differences between the two groups with respect to how realistic their self-assessment is—for example, due to cultural differences or to the degree of exposure to (native) English in everyday life, which might help to shape a more realistic self-perception.
Performance in the individual test parts
Despite our efforts to select only Korean participants with a high TOEIC score, the performance data (Table 2) show that our Dutch participant group was, overall, more proficient, except for translation, where the two groups did not significantly differ. The data also show a large difference in false alarm rates in the LexTALE (i.e., yes responses where the stimulus was a nonword), while the hit rates were similar. Thus, despite identical instructions to press “yes” only when the participants was certain to know the word, Korean participants tended to have much higher false alarm rates. This difference in response tendencies or strategies might be due to cultural differences: Admitting to “not know” something might have a different connotation in Korea, as compared with the Netherlands.
Apart from this difference, the two groups resembled each other with respect to which items in the individual test parts were difficult or easy for them, as is made apparent by the between-groups item correlations above .70. The only exception was L2–L1 translation, where different stimuli were presented.
Reliability and differences between the two participant groups
The examination of split-half reliabilities (Table 3) as upper limits to the correlations between test parts revealed generally high reliabilities (above .81 for at least one measure per test part) for the Dutch participants, but much lower levels for the Korean group (above .67). An exception to this is L2–L1 translation and the combined translation score, with reliabilities above .87 in both groups (but still larger ones for the Dutch group). As a consequence, the correlations between test parts (Table 4) are also consistently lower for the Korean group than for Dutch participants.
The reasons for the difference in reliabilities and intercorrelations between the two groups are currently unclear. In a research report concerned with the TOEIC test, Wilson (2001) also observed lower correlations between TOEIC and a spoken proficiency rating (Language Proficiency Interview, LPI) for Korean learners of English, as compared with English learners with other native languages. Wilson suggests that for Korean speakers, various L2 skills (such as speaking proficiency and reading comprehension) might develop less simultaneously than in other populations; however, why this should be the case remains puzzling. In our case, it seems unlikely that only certain skills diverge from others for Korean speakers, because the lower intercorrelations were observed between all test parts. Furthermore, we also observed lower reliabilities within the test parts, which would not be explained by this account.
One difference between the groups that might have caused the observed discrepancy is the average level of proficiency. As was stated earlier, the Dutch group was, overall, more proficient than the Korean group, which might have led to differences in suitability of the individual tests for the participants. However, when we selected two subgroups of participants that were precisely matched pairwise in terms of QPT scores (n = 39 per group) in an additional analysis, the pattern of much lower (often halved) intercorrelations between test parts for the Korean subgroup persisted. While this additional analysis does not support the proficiency-based account, it is still possible that the effect of differences in proficiency is more complicated than that and, therefore, influenced consistencies.
Thus, in general, these explanations remain speculative, and more research is needed to make sense of learner differences like those found in the present data.
Comparing the validity of LexTALE and self-ratings
The general pattern in our data (Table 4) was that LexTALE scores correlated higher with vocabulary size (i.e., translation performance) than the rating values did. Thus, LexTALE can be regarded as the generally better predictor for vocabulary knowledge. However, for the Dutch group, we have to admit that the difference was smaller than we had expected. In fact, the data show that when obtained under similar circumstances as in our study, the mean rating and, to a lesser degree, the rating for reading experience can also be useful predictors of vocabulary knowledge. However, this did not hold for the Korean group, where correlations of translation performance with % correct av of LexTALE were still substantial (about .50), while those with self-ratings were much lower (about .30 and lower). Furthermore, in the Korean data set, the mean rating was no longer the superior measure of the ratings, but the correlations with translation scores were best for reading experience.
As to the question of whether the correlation levels we observed for both LexTALE and self-ratings are sufficient to claim test validity, the old problem arises that there are no “hard” criteria to identify a given validity value as sufficient. However, in practice, correlations above .50 are often considered large, and those between .30 and .50 as moderate, in reference to Cohen (1988). A comparison to validation studies of other language tests shows that the highest criterion validities, even for official tests like TOEFL or TOEIC, are usually about .75 (e.g., Fitzpatrick & Clenton, 2010; Sawaki & Nissan, 2009; Wilson, 2001; Xi, 2008). As compared with these studies, the correlations we observed between LexTALE and translation performance in the Dutch group can be considered excellent, and those with QPT still substantial. For the Korean group, the correlations with translation performance were moderate to large and in the mean range of what is observed in other test validation studies, and they were considerably superior to those with self-ratings. Consequently, researchers of L2 word processing in Koreans are better advised to collect LexTALE scores than self-ratings.
Still, to get a better impression of what the practical value of LexTALE versus self-ratings might be, we “simulated” two practical applications to the experimental situations for which we developed LexTALE. The results show a similar general picture as the previously reported data: For the Dutch group, the usefulness of LexTALE was comparable to that of mean self-ratings. This was shown both for splitting the participant group in two halves on the basis of vocabulary size (i.e., with translation performance as criterion) and for excluding participants below a certain proficiency criterion. In the first case, mean self-rating was a slightly better predictor, while the reverse was true for the latter. Generally, a percentage of about 80% of correctly classified participants for the translation median split is a good result and likely to be extremely useful to researchers. Similarly, LexTALE predicted well whether participants would fall above a critical QPT score—namely, with 75% accuracy and a low false alarm rate (17%, or 4 out of 24 participants). This is especially remarkable because we did not really expect LexTALE to be a very accurate predictor of the QPT.
Again, the situation was different for the Korean group, for which we analyzed only the first application—that is, the split of participants into two halves. Here, only classifications based on LexTALE produced an acceptable agreement rate, while those based on mean ratings were close to chance level.
The considerable differences between the Dutch and the Korean groups with respect to the predictive quality of LexTALE versus self-ratings complicates the derivation of practical implications from the data. On the one hand, the Dutch data seem to suggest that self-ratings, which are probably easier to obtain than LexTALE scores, are roughly comparable in their validity to LexTALE. This would mean that all those researchers that use or have used them as the only proficiency indicator (see Table 1) might not be too wrong after all. On the other hand, in a second group with a different L1 background, a different proficiency distribution, and generally more noisy data, this was not the case. For a participant population such as the Korean group here, LexTALE generally was the superior and, often, the only useful measure. Thus, for new groups to be tested in future studies—which might be hard to classify as more “Dutch-like” or more “Korean-like” —we conclude that LexTALE is the “safer” measure of the two, certainly when it comes to predicting vocabulary size, but, possibly in combination with self-ratings, also in terms of predicting general aptitude levels.
Experimental data
Our final set of data, those from two previous experimental studies, confirms this conclusion. The participant groups in these studies were presumably highly similar to the Dutch group here: Lemhöfer and Dijkstra (2004) drew from exactly the same Dutch–English bilingual student population, and Lemhöfer et al. (2008) also used Dutch students, plus two groups of French and German participants with similar education backgrounds and proficiency levels. However, the results (see Table 7) showed significant correlations of the experimental data only for LexTALE, but not for self ratings.
To researchers, experimentally obtained variables such as RTs and errors rates are probably much more important criteria than translation accuracies or scores on a placement test; for instance, when screening participants beforehand, their primary aim will be to exclude those who are likely to add too much noise to the data—that is, who will produce extremely high RTs and/or error rates. In this sense, our reanalysis of two experimental sets of data showed that LexTALE is a useful measurement instrument to achieve this aim, while self-ratings are not.
As was expected, the correlation between LexTALE and experimental RTs in PDM, a perceptual word identification paradigm, was much reduced, as compared with lexical decision data, but still was significant when assuming one-tailed tests and looking at the first of three sessions only. The first session corresponds to a “standard,” one-session experiment. The moderate size of the correlation (-.23) has to be placed in the context of the different nature of the word materials (only short, three- to five-letter words in the PDM, with much longer words in the LexTALE) and, particularly, in that of the different nature of the tasks. PDM is a low-level task with a strong perceptual component; in principle, it can be performed without knowledge of the tested language and, thus, without lexical involvement. In contrast, the lexical decisions required in LexTALE are relatively high-level processes directly based on the lexicon (and probably on some guessing mechanisms). The difference between these two tasks can probably be compared with that between lexical decision and word naming, where a word has to be read aloud. For these two tasks, Balota, Cortese, Sergent-Marshall, Spieler, and Yap (2004) reported item correlations of .28, which is near the participant correlation observed here.6 Thus, a correlation as low as .23 does not seem exceptional, given the differences between the tasks. In the PDM sessions 2 and 3, the correlation with LexTALE vanished, probably because of a training effect further masking it. Importantly, the significant correlation in session 1 suggests that LexTALE scores would be a useful control variable in experimental tasks other than lexical decision, even in strongly perceptual tasks such as PDM, which is not the case for self-ratings.
The reason for the discrepancy between the data from the experimental studies and those of the present study in terms of the validity of self-ratings are most likely to be a consequence of the circumstances of obtaining the ratings, as already discussed above. In those studies, even though the self-ratings were always obtained after the main experiment, the main task might not have induced as realistic a self-assessment of English language skills as the extensive testing battery in our online study did. This might point to a general problem in rating data—namely, their susceptibility to external circumstances and subjective factors (mood, personality, etc.) that are not well-known and not under the control of the experimenter. In contrast, a more objective measure like LexTALE is expected to be less influenced by such factors.
LexTALE or simple lexical decision with different items?
One issue that is also highly relevant to the usefulness of LexTALE is in how far it is superior to any other lexical decision task with different sets of L2 words and nonwords. Our data do not provide direct evidence for such a superiority, since we did not compare the validity of LexTALE with that of a different lexical decision task. Of course, the materials used in LexTALE are not magic, and thus, a good selection of (low-frequent) words and (highly wordlike) nonwords should, in principle, work just as well as LexTALE does. In fact, a recent reanalysis of data from large L1 and L2 lexical decision databases suggests that participants’ performance for words on the lowest frequency level is a similarly effective predictor of vocabulary size as LexTALE is (Diependaele, Lemhöfer, & Brysbaert, 2011). However, the problem is that there is no objective way to tell whether a set of materials is a good selection; characteristics of both words and nonwords influence lexical decision performance in a complex and not fully understood way. The data in Table 7, showing correlations between LexTALE and ordinary lexical decision of between .41 and .74, demonstrate the point that the two measures are clearly not the same thing. Furthermore, most lexical decision tasks are speeded, resulting in two different performance measures—RTs and error rates—which are hard to integrate into one score. Finally, the problem of a lack of comparability of L2 populations is, in our view, one of the most urgent problems in L2 research at the moment. If LexTALE becomes widely used by a large number of laboratories, as is our hope, it would provide a certain level of standardization across studies.
Summary and conclusions
In summary, the present study has shown that despite its brevity and the simple yes/no format, LexTALE provides a useful and valid measure of English vocabulary knowledge of medium- to high-proficient learners of English as a second language. The correlations in the online study were substantial for two speaker groups with very distant L1s, even with one rather “noisy” group (the Korean participants). This suggests that this finding will probably generalize to most if not all other groups of advanced learners of English with varying language backgrounds. This was not true for self-ratings, which showed good levels of validity for Dutch, but not for Korean participants in the present study, and were poor predictors of experimental lexical decision and word identification data from previous studies. LexTALE is thus especially preferable to self-ratings in populations that are rather heterogeneous in terms of L2 proficiency and possibly L1 background.
LexTALE can be downloaded, or carried out online, at www.lextale.com. Besides the English version of LexTALE, there are also German and Dutch versions of LexTALE that can be found on the Web site. Although they are not yet validated or tested for their equivalence with the English version, they were developed as parallel to the English version as possible and might represent a valuable resource for investigators of Dutch or German as L2s. With respect to the English version of LexTALE, the present study has shown that it offers researchers a useful tool for the quick and valid assessment of vocabulary knowledge in English as an L2.
Author Note
Parts of this research were supported by two individual ‘Veni’ grants from the Netherlands Organisation for Scientific Research (NWO), awarded separately to each of the authors. We would like to thank Taehong Cho, director of the Hanyang Phonetics and Psycholinguistics Laboratory at Hanyang University, Seoul, for facilitating the Korean data collection. Many thanks also to Jiyoun Choi for help constructing the Korean translation tasks, to Zhou Fang for setting up the Web-based experiments, to Sammie Tarenskeen for data processing, and to Jelmer Wolterink for building www.lextale.com. We are also grateful to Marc Brysbaert and Ana Schwartz for helpful comments on earlier versions of the manuscript.
Open Access
This article is distributed under the terms of the Creative Commons Attribution Noncommercial License which permits any noncommercial use, distribution, and reproduction in any medium, provided the original author(s) and source are credited.
Appendix A Stimulus materials
Items in LexTALE and correct response (y/n)
platery (practice item; n), denial (practice item; y), generic (practice item; y), mensible (n), scornful (y), stoutly (y), ablaze (y), kermshaw (n), moonlit (y), lofty (y), hurricane (y), flaw (y), alberation (n), unkempt (y), breeding (y), festivity (y), screech (y), savoury (y), plaudate (n), shin (y), fluid (y), spaunch (n), allied (y), slain (y), recipient (y), exprate (n), eloquence (y), cleanliness (y), dispatch (y), rebondicate (n), ingenious (y), bewitch (y), skave (n), plaintively (y), kilp (n), interfate (n), hasty (y), lengthy (y), fray (y), crumper (n), upkeep (y), majestic (y), magrity (n), nourishment (y), abergy (n), proom (n), turmoil (y), carbohydrate (y), scholar (y), turtle (y), fellick (n), destription (n), cylinder (y), censorship (y), celestial (y), rascal (y), purrage (n), pulsh (n), muddy (y), quirty (n), pudour (n), listless (y), wrought (y).
Items (in bold) for translation from English to Dutch/Korean, with main expected translations (Dutch/Korean)
treaty: verdrag / 조약, jaw: kaak / 턱, pile: stapel / 더미, scarf: sjaal / 스카프 , thigh: dij / 허벅지, oat: haver / 귀리, conscience: geweten / 양심, rumour: gerucht / 소문, pear: peer / 배, hedge: heg / 울타리, mule: muildier / 당나귀, pencil: potlood / 연필, failure: mislukking / 실패, sleeve: mouw / 소매, jar: pot / 단지, spine: ruggegraat / 척추, saucer: schotel / 접시, stench: stank / 악취, tale: verhaal / 이야기, soil: grond / 토양, bosom: boezem / 가슴, quarrel: ruzie / 싸움, defeat: nederlaag/ 패배, arrow: pijl / 화살, gown: toga / 가운, twilight: schemering / 황혼, pine: den / 소나무, heathen: heiden / 이방인, compulsion: dwang / 강제, oath: eed / 맹세.
Items (in bold) for translation from Dutch/Korean to English, with main expected translations
kritiek/
 criticism, stro/
 straw, gemak/
 ease, tante/
 aunt, groenteboer/
 greengrocer, voorhoofd/
 forehead, kalf/
 calf, meerderheid/
 majority, spraak/
 speech, onschuld/
 innocence, daad/
 deed, speld/
 pin, daling/
 descent, handschoen/
 glove, rente/
 interest, romp/
 torso, zonde/
 sin, lening/
 loan, bont/
 fur, vloed/
 flood, huurder/
 renter, afkeer/
 dislike, noodzaak/
 necessity, erfenis/
 inheritance, citroen/
 lemon, druif/
 grape, schatting/
 estimation, geduld/
 patience, kraan/
 faucet, deugd/
 virtue.
Appendix B Formulas
Formula for computing Meara’s ∆M (Meara, 1996)
 |
Formula for computing ISDT (Huibregtse et al., 2002)
 |
where h = proportion of correctly recognized words (hit rate), and f = proportion of incorrectly accepted nonwords (false alarm rate).
Spearman–Brown formula for calculating the split-half reliability
 |
where r xy = correlation between the two test halves.
Appendix C Interpreting LexTALE scores
For the purpose of comparison or reference, we provide a more detailed description of the frequency distribution of the LexTALE scores obtained in this and three previous studies (see Table 8). In particular, we consider our data on Dutch–English bilinguals (n = 162) to be highly representative of one of the standard populations in L2 research (Dutch college students with a high level of formal education and everyday exposure to English). Future studies can refer to these score distributions when comparing their participants with those of our studies in terms of vocabulary knowledge.
Table 8.
10th percentiles of frequency distributions of LexTALE %correct AV scores in this study and three previous studiesa
| Percentile | All Participants (n = 289) | Dutch Participants (n = 162) | Korean Participants From This Study (n = 87) |
|---|---|---|---|
| 10 | 58.75 | 64.13 | 52.50 |
| 20 | 63.75 | 68.75 | 56.25 |
| 30 | 68.75 | 73.75 | 58.75 |
| 40 | 73.75 | 76.25 | 61.25 |
| 50 | 76.25 | 78.75 | 63.75 |
| 60 | 80.00 | 81.25 | 66.25 |
| 70 | 82.50 | 83.88 | 70.75 |
| 80 | 87.50 | 88.00 | 75.00 |
| 90 | 91.25 | 92.50 | 81.25 |
On the basis of the linear regression depicted in Fig. 3, we also calculated which ranges of LexTALE scores are associated with which QPT score ranges and associated CEF proficiency levels, as indicated in the QPT test description (Quick Placement Test, 2001). Because the prediction of QPT scores on the basis of LexTALE in the Korean group was not very accurate, we used only the Dutch data for this calculation. It should be noted, however, that the ranges given below are rough estimates based on limited data.
With this restriction, LexTALE can be used to discriminate between lower intermediate (or lower), upper intermediate, and advanced users (see Table 9).
Table 9.
Relation between general English proficiency levels, as indicated by QPT scores, and LexTALE scores, based on the Dutch group in the present study
| CEF Level | CEF Description | QPT Score | LexTALE Scorea |
|---|---|---|---|
| C1 & C2 | Upper & lower advanced/proficient user | 80%–100% | 80%–100% |
| B2 | Upper intermediate | 67%–79% | 60%–80% |
| B1 and lower | Lower intermediate and lower | below 66% | below 59% |
aPrediction based on Dutch group
Footnotes
Note. According to a search in ISI Web of Knowledge: Topic = word* AND Topic = (L2 OR “second language” OR nonnative OR bilingual*) AND Topic = English, field = psychology AND Publication year > = 2009
There was only one item for which American and British spellings differed (savoury).
As is very common in English, some of the items were both nouns and verbs (e.g., soil) or nouns and adjectives (e.g., heathen), but all selected words were translated as nouns only in the Tokowicz et al. (2002) norms.
For LexTALE, this alternating procedure was applied to words and nonwords, separately (i.e, every other word or nonword was assigned to the same group).
Because of the different proficiency distributions in the two groups, it was not possible to select a proficiency criterion for which comparable proportions of the two groups would qualify.
We did not find any study reporting on participant correlations between two tasks, as in our present analysis.
References
- Abutalebi J. Neural aspects of second language representation and language control. Acta Psychologica. 2008;128:466–478. doi: 10.1016/j.actpsy.2008.03.014. [DOI] [PubMed] [Google Scholar]
- Baayen RH, Piepenbrock R, Gulikers L. The CELEX Lexical Database (Release 2) [CD-ROM] Philadelphia, PA: University of Pennsylvania, Linguistic Data Consortium; 1995. [Google Scholar]
- Balota DA, Cortese MJ, Sergent-Marshall SD, Spieler DH, Yap MJ. Visual word recognition of single-syllable words. Journal of Experimental Psychology. General. 2004;133:283–316. doi: 10.1037/0096-3445.133.2.283. [DOI] [PubMed] [Google Scholar]
- Blumenfeld H, Marian V. Constraints on parallel activation in bilingual spoken language processing: Examining proficiency and lexical status using eye-tracking. Language and Cognitive Processes. 2007;22:633–660. doi: 10.1080/01690960601000746. [DOI] [Google Scholar]
- Broersma M. Perception of final fricative voicing: Native and nonnative listeners’ use of vowel duration. Journal of the Acoustical Society of America. 2010;127:1636–1644. doi: 10.1121/1.3292996. [DOI] [PubMed] [Google Scholar]
- Brysbaert M, van Dyck G, van de Poel M. Visual word recognition in bilinguals: Evidence from masked phonological priming. Journal of Experimental Psychology. Human Perception and Performance. 1999;25:137–148. doi: 10.1037/0096-1523.25.1.137. [DOI] [PubMed] [Google Scholar]
- Cameron L. Measuring vocabulary size in English as an additional language. Language Teaching Research. 2002;6:145–173. doi: 10.1191/1362168802lr103oa. [DOI] [Google Scholar]
- Canseco-Gonzalez E, Brehm L, Brick CA, Brown-Schmidt S, Fischer K, Wagner K. Carpet or carcel: The effect of age of acquisition and language mode on bilingual lexical access. Language and Cognitive Processes. 2010;25:669–705. doi: 10.1080/01690960903474912. [DOI] [Google Scholar]
- Chambers CG, Cooke H. Lexical competition during second-language listening: Sentence context, but not proficiency, constrains interference from the native lexicon. Journal of Experimental Psychology. Learning, Memory, and Cognition. 2009;35:1029–1040. doi: 10.1037/a0015901. [DOI] [PubMed] [Google Scholar]
- Cohen J. Statistical power analysis for the behavioral sciences. 2. Hillsdale, NJ: Erlbaum; 1988. [Google Scholar]
- de Groot AMB, Borgwaldt S, Bos M, van den Eijnden E. Lexical decision and word naming in bilinguals: Language effects and task effects. Journal of Memory and Language. 2002;47:91–124. doi: 10.1006/jmla.2001.2840. [DOI] [Google Scholar]
- Delgado P, Guerrero G, Goggin JP, Ellis BB. Self-assessment of linguistic skills by bilingual hispanics. Hispanic Journal of Behavioral Sciences. 1999;21:31–46. doi: 10.1177/0739986399211003. [DOI] [Google Scholar]
- Diependaele, K., Lemhöfer, K., & Brysbaert, M. (2011). Explaining individual differences in the word frequency effect: Insights from first and second language word recognition. Manuscript submitted for publication. [DOI] [PubMed]
- Dijkstra T, Miwa K, Brummelhuis B, Sappelli M, Baayen H. How cross-language similarity and task demands affect cognate recognition. Journal of Memory and Language. 2010;62:284–301. doi: 10.1016/j.jml.2009.12.003. [DOI] [Google Scholar]
- Elston-Güttler KE, Gunter TC. Fine-tuned: Phonology and semantics affect first- to second-language zooming in. Journal of Cognitive Neuroscience. 2009;21:180–196. doi: 10.1162/jocn.2009.21015. [DOI] [PubMed] [Google Scholar]
- Fitzpatrick T, Clenton J. The challenge of validation: Assessing the performance of a test of productive vocabulary. Language Testing. 2010;27:537–554. doi: 10.1177/0265532209354771. [DOI] [Google Scholar]
- FitzPatrick I, Indefrey P. Lexical competition in nonnative speech comprehension. Journal of Cognitive Neuroscience. 2010;22:1165–1178. doi: 10.1162/jocn.2009.21301. [DOI] [PubMed] [Google Scholar]
- Fontes ABADL, Schwartz AI. On a different plane: Cross-language effects on the conceptual representations of within-language homonyms. Language and Cognitive Processes. 2010;25:508–532. doi: 10.1080/01690960903285797. [DOI] [Google Scholar]
- Haigh CA, Jared D. The activation of phonological representations by bilinguals while reading silently: Evidence from interlingual homophones. Journal of Experimental Psychology. Learning, Memory, and Cognition. 2007;33:623–644. doi: 10.1037/0278-7393.33.4.623. [DOI] [PubMed] [Google Scholar]
- Hakuta K, Bialystok E, Wiley E. Critical evidence: A test of the critical-period hypothesis for second-language acquisition. Psychological Science. 2003;14:31–38. doi: 10.1111/1467-9280.01415. [DOI] [PubMed] [Google Scholar]
- Hawkins R, Al-Eid S, Almahboob I, Athanasopoulos P, Chaengchenkit R, Hu J, Velasco-Zárato K. Accounting for English article interpretation by L2 speakers. EUROSLA Yearbook. 2006;6:7–25. doi: 10.1075/eurosla.6.04haw. [DOI] [Google Scholar]
- Huibregtse I, Admiraal W, Meara P. Scores on a yes–no vocabulary test: Correction for guessing and response style. Language Testing. 2002;19:227–245. doi: 10.1191/0265532202lt229oa. [DOI] [Google Scholar]
- Jared D, Kroll JF. Do bilinguals activate phonological representations in one or both of their languages when naming words? Journal of Memory and Language. 2001;44:2–31. doi: 10.1006/jmla.2000.2747. [DOI] [Google Scholar]
- Kotz SA. A critical review of ERP and fMRI evidence on L2 syntactic processing. Brain and Language. 2009;109:68–74. doi: 10.1016/j.bandl.2008.06.002. [DOI] [PubMed] [Google Scholar]
- Lemhöfer K, Dijkstra T. Recognizing cognates and interlexical homographs: Effects of code similarity in language specific and generalized lexical decision. Memory and Cognition. 2004;32:533–550. doi: 10.3758/BF03195845. [DOI] [PubMed] [Google Scholar]
- Lemhöfer K, Dijkstra T, Michel MC. Three languages, one ECHO: Cognate effects in trilingual word recognition. Language and Cognitive Processes. 2004;19:585–611. doi: 10.1080/01690960444000007. [DOI] [Google Scholar]
- Lemhöfer K, Dijkstra T, Schriefers H, Baayen RH, Grainger J, Zwitserlood P. Native language influences on word recognition in a second language: A mega-study. Journal of Experimental Psychology. Learning, Memory, and Cognition. 2008;34:12–31. doi: 10.1037/0278-7393.34.1.12. [DOI] [PubMed] [Google Scholar]
- Lemmon CR, Goggin JP. The measurement of bilingualism and its relationship to cognitive ability. Applied PsychoLinguistics. 1989;10:133–155. doi: 10.1017/S0142716400008493. [DOI] [Google Scholar]
- Leonard MK, Brown TT, Travis KE, Gharapetian L, Hagler DJ, Jr, Dale AM, Halgren E. Spatiotemporal dynamics of bilingual word processing. NeuroImage. 2010;49:3286–3294. doi: 10.1016/j.neuroimage.2009.12.009. [DOI] [PMC free article] [PubMed] [Google Scholar]
- Libben MR, Titone DA. Bilingual lexical access in context: Evidence from eye movements during reading. Journal of Experimental Psychology. Learning, Memory, and Cognition. 2009;35:381–390. doi: 10.1037/a0014875. [DOI] [PubMed] [Google Scholar]
- Liu H, Hu Z, Guo T, Peng D. Speaking words in two languages with one brain: Neural overlap and dissociation. Brain Research. 2009;1316:75–82. doi: 10.1016/j.brainres.2009.12.030. [DOI] [PubMed] [Google Scholar]
- Macizo P, Bajo T, Cruz Martín M. Inhibitory processes in bilingual language comprehension: Evidence from Spanish–English interlexical homographs. Journal of Memory and Language. 2010;63:232–244. doi: 10.1016/j.jml.2010.04.002. [DOI] [Google Scholar]
- Marian V, Blumenfeld HK, Kaushanskaya M. The Language Experience and Proficiency Questionnaire (LEAP-Q): Assessing language profiles in bilinguals and multilinguals. Journal of Speech, Language, and Hearing Research. 2007;50:940–967. doi: 10.1044/1092-4388(2007/067). [DOI] [PubMed] [Google Scholar]
- Martin W, Tops GAJ, Bol JL, Eeckhout R, Reinders-Reeser AE, Roos L, et al. Van Dale Groot Woordenboek Engels-Nederlands. Utrecht/Antwerpen: Van Dale Lexicografie; 1984. [Google Scholar]
- Meara PM, Buxton B. An alternative to multiple choice vocabulary tests. Language Testing. 1987;4:142–154. doi: 10.1177/026553228700400202. [DOI] [Google Scholar]
- Meara PM. New approaches to testing vocabulary knowledge. Unpublished manuscript. Swansea: Centre for Applied Language Studies; 1992. [Google Scholar]
- Meara PM. English Vocabulary Tests: 10 k. Unpublished manuscript. Swansea: Center for Applied Language Studies; 1996. [Google Scholar]
- Meara PM, Jones G. Vocabulary size as a placement indicator. In: Grunwell P, editor. Applied linguistics in society. London: CILT; 1988. pp. 80–87. [Google Scholar]
- Midgley KJ, Holcomb PJ, Grainger J. Masked repetition and translation priming in second language learners: A window on the time-course of form and meaning activation using ERPs. Psychophysiology. 2009;46:551–565. doi: 10.1111/j.1469-8986.2009.00784.x. [DOI] [PMC free article] [PubMed] [Google Scholar]
- Mochida K, Harrington M. The yes/no test as a measure of receptive vocabulary knowledge. Language Testing. 2006;2:73–98. doi: 10.1191/0265532206lt321oa. [DOI] [Google Scholar]
- Nation P. Teaching and learning vocabulary. New York: Newbury House; 1990. [Google Scholar]
- Ota M, Hartsuiker RJ, Haywood SL. The KEY to the ROCK: Near-homophony in nonnative visual word recognition. Cognition. 2009;111:263–269. doi: 10.1016/j.cognition.2008.12.007. [DOI] [PubMed] [Google Scholar]
- Palmer SD, van Hooff JC, Havelka J. Language representation and processing in fluent bilinguals: Electrophysiological evidence for asymmetric mapping in bilingual memory. Neuropsychologia. 2010;48:1426–1437. doi: 10.1016/j.neuropsychologia.2010.01.010. [DOI] [PubMed] [Google Scholar]
- Prior A, MacWhinney B, Kroll JF. Translation norms for English and Spanish: The role of lexical variables, word class, and L2 proficiency in negotiating translation ambiguity. Behavior Research Methods. 2007;39:1029–1038. doi: 10.3758/BF03193001. [DOI] [PMC free article] [PubMed] [Google Scholar]
- Qian DD. Investigating the relationship between vocabulary knowledge and academic reading performance: An assessment perspective. Language Learning. 2002;52:513–536. doi: 10.1111/1467-9922.00193. [DOI] [Google Scholar]
- Quick Placement Test. (2001). Oxford: Oxford University Press.
- Rossi S, Gugler MF, Friederici AD, Hahne A. The impact of proficiency on syntactic second-language processing of German and Italian: Evidence from event-related potentials. Journal of Cognitive Neuroscience. 2006;18:2030–2048. doi: 10.1162/jocn.2006.18.12.2030. [DOI] [PubMed] [Google Scholar]
- Sawaki, Y., & Nissan, S. (2009). Criterion-related validity of the TOEFL iBT listening section (Research Rep.09-02). Princeton, NJ: Educational Testing Service. Retrieved from http://www.ets.org/Media/Research/pdf/RR-09-02.pdf
- Stæhr LS. Vocabulary knowledge and advanced listening comprehension in English as a foreign language. Studies in Second Language Acquisition. 2009;31:577–607. doi: 10.1017/S0272263109990039. [DOI] [Google Scholar]
- Talamas A, Kroll JF, Dufour R. From form to meaning: Stages in the acquisition of second-language vocabulary. Bilingualism: Language and Cognition. 1999;2:45–58. doi: 10.1017/S1366728999000140. [DOI] [Google Scholar]
- TOEIC. (2008). TOEIC newsletter 2008. Retrieved from www.ybmsisa.com
- Tokowicz N, Kroll JF, de Groot AMB, van Hell JG. Number of translation norms for Dutch–English translation pairs: A new tool for examining language production. Behavior Research Methods, Instruments, & Computers. 2002;34:435–451. doi: 10.3758/BF03195472. [DOI] [PubMed] [Google Scholar]
- van der Meij M, Cuetos F, Carreiras M, Barber HA. Electrophysiological correlates of language switching in second language learners. Psychophysiology. 2011;48:44–54. doi: 10.1111/j.1469-8986.2010.01039.x. [DOI] [PubMed] [Google Scholar]
- Verhoef KMW, Roelofs A, Chwilla DJ. Electrophysiological evidence for endogenous control of attention in switching between languages in overt picture naming. Journal of Cognitive Neuroscience. 2010;22:1832–1843. doi: 10.1162/jocn.2009.21291. [DOI] [PubMed] [Google Scholar]
- White L, Melhorn JF, Mattys SL. Segmentation by lexical subtraction in Hungarian speakers of second-language English. Quarterly Journal of Experimental Psychology. 2010;63:544–554. doi: 10.1080/17470210903006971. [DOI] [PubMed] [Google Scholar]
- Wilson, K. M. (2001). Overestimation of LPI ratings for native-Korean speakers in the TOEIC testing context: Search for explanation. Princeton, NJ: Educational Testing Service. Retrieved fromwww.ets.org/Media/Research/pdf/RR-01-15-Wilson.pdf
- Winskel H, Radach R, Luksaneeyanawin S. Eye movements when reading spaced and unspaced Thai and English: A comparison of Thai–English bilinguals and English monolinguals. Journal of Memory and Language. 2009;61:339–351. doi: 10.1016/j.jml.2009.07.002. [DOI] [Google Scholar]
- Xi, X. (2008). Investigating the criterion-related validity of the TOEFL speaking scores for ITA screening and setting standards for ITAs (Research Rep. 08–02). Princeton, NJ: Educational Testing Service. Retrieved from http://www.ets.org/Media/Research/pdf/RR-08-02.pdf
- Zhou H, Chen B, Yang M, Dunlap S. Language nonselective access to phonological representations: Evidence from Chinese–English bilinguals. Quarterly Journal of Experimental Psychology. 2010;63:2051–2066. doi: 10.1080/17470211003718705. [DOI] [PubMed] [Google Scholar]