Abstract
This article introduces AUX (AUditory syntaX), a scripting syntax specifically designed to describe auditory signals and processing, to the members of the behavioral research community. The syntax is based on descriptive function names and intuitive operators suitable for researchers and students without substantial training in programming, who wish to generate and examine sound signals using a written script. In this article, the essence of AUX is discussed and practical examples of AUX scripts specifying various signals are illustrated. Additionally, two accompanying Windows-based programs and development libraries are described. AUX Viewer is a program that generates, visualizes, and plays sounds specified in AUX. AUX Viewer can also be used for class demonstrations or presentations. Another program, Psycon, allows a wide range of sound signals to be used as stimuli in common psychophysical testing paradigms, such as the adaptive procedure, the method of constant stimuli, and the method of adjustment. AUX Library is also provided, so that researchers can develop their own programs utilizing AUX. The philosophical basis of AUX is to separate signal generation from the user interface needed for experiments. AUX scripts are portable and reusable; they can be shared by other researchers, regardless of differences in actual AUX-based programs, and reused for future experiments. In short, the use of AUX can be potentially beneficial to all members of the research community—both those with programming backgrounds and those without.
Keywords: Programming language, Software, Psychoacoustics, Education
Many experiments in behavioral research use audio signals for stimuli. Nowadays, signals are generated and processed predominantly in a digital form, and the presentation of stimuli is controlled by a computer, as opposed to analog equipment such as tone/noise generators, filters or mixers. While researchers appreciate the flexibility and efficiency provided by digital technology, they are still required to select or create proper programs to generate and process signals. Many researchers have adopted MATLAB (The Mathworks Inc., Natick, MA) as a programming tool, because it provides an intuitive computing environment that visualizes the processing of signals in a script-based language so that users can define and analyze arbitrary signals with relative ease. However, although the definition of a single sound is straightforward, operations among multiple signals can be cumbersome. Because all signals in MATLAB are processed as matrix or vector operations, signal lengths must be carefully adjusted before manipulation. This requirement often overshadows the benefits of using MATLAB in psychoacoustic research. In other words, conceptually simple manipulations of sound (e.g., two short tones with onset/offset smoothing windows, occurring sequentially but separated by a certain delay and embedded in noise with a longer duration) often require lengthy MATLAB expressions with accurate indices and sample numbers in the signal vectors that correspond to the actual times desired in (milli)seconds. Although the indices and sample counts constitute critical elements in MATLAB, because they specify how sample points in one signal interact with those in another signal in the discrete-time domain, they are not intrinsically relevant to conceptual components of the sound. This is due in part to the nature of MATLAB, which was originally developed to facilitate computational tasks for engineering problems, not necessarily to generate audio signals.
Therefore, an alternative scripting language—namely, AUX (AUditory syntaX)—was developed specifically for generating and processing audio signals. The purpose of this article is to introduce AUX and the related software packages AUX Viewer, Psycon, and AUX Library to researchers and educators in the behavioral sciences. These tools have been used by the author and by a small number of colleagues for research and classroom demonstration and have been polished with feedback from users over several years.
AUX is based on a paradigm of device-independent programming, where sounds are specified in a conceptual representation. This is in contrast to representing sounds directly as digital samples in conventional programming languages, such as MATLAB or C, where the rendition of sounds is dependent on the settings in the device, such as the digital sampling rate or the data type chosen for sound playback. The conceptual identity of sounds sometimes becomes unclear when they are embedded with device settings. In AUX, an abstract specification of signals suffices, without the implementation details of the device.
AUX is available as a syntax module and can be adopted by other software tools that offer desirable graphical user interfaces (GUIs), or it could be incorporated in auditory research tools available in the literature, such as Praat (Boersma & Weenink, 2010), APEX3 (Francart, van Wieringen, & Wouters, 2008), DMDX (Forster & Forster, 2003), Paradigm (López-Bascuas, Carrero Marín & Serradilla García, 1999), and Alvin (Hillenbrand & Gayvert, 2005).
The primary beneficiaries of AUX would be those who find programming in MATLAB daunting or who have less programming knowledge. The primary applications of AUX would be psychoacoustical research and education with no heavy engineering requirements, such as sophisticated control of hardware, data acquisition, or real-time signal processing. AUX was not created to fulfill any signal generation and processing needs that are impossible to fulfill with MATLAB or C. Instead, AUX provides an alternative way of generating signals by representing sounds using a conceptually simpler syntax in a device-independent manner.
In this article, the background and crux of AUX are discussed first, and the operators and rules of the syntax are explained. Subsequently, the AUX-based software packages AUX Viewer, Psycon, and AUX Library are described, to illustrate how AUX can be used in actual programs. These software packages are distributed under Academic Free License 3.0 and are available for download from the following website: http://auditorypro.com/download/aux. Detailed information about the software, including the manuals, is also available on this website for interested readers.
Generation of simple signals in AUX
An AUX script consists of definitions of signals and arithmetic operations on those signals. Most signals used in psychoacoustics are based on tonal or noise components, and AUX provides predefined functions to represent these components, which are shown in Table 1. The two most fundamental functions among them are  and
and  , as in
  , which represents a tone of
  for the duration of
  milliseconds, and
  , which represents white noise for
  milliseconds. Another fundamental element of AUX is amplitude scaling, based on the RMS (root-mean square) energy using the scaling operator @, which adjusts the RMS level of the operand signal to the specified decibel value. For example,
![]()
Table 1.
Examples of built-in AUX functions for signal generation
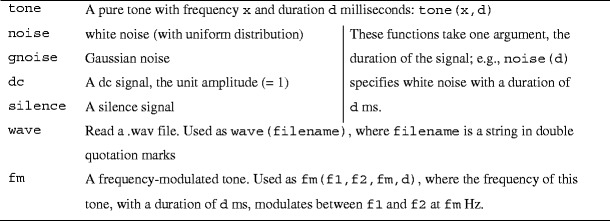
For a complete list of functions and detailed descriptions of input arguments, refer to the manual available on the website mentioned earlier
represents a 440-Hz pure tone with a duration of 500 ms, with its amplitude scaled to 10 dB below full scale. With this scaling method, two or more signals of different amplitudes can be added as necessary. For example,![]()
represents a tone–noise mixture with a signal-to-noise ratio of 15 dB. Multiple signals can also be added with amplitude coefficients, as in the following: 
Another unique operator in AUX is the time-shift operator, >>. Assume that a signal  has been defined, then
  specifies signal
  shifted in time as indicated (imagine that the symbol constitutes an arrow →). For example,
![]()
is a 300-Hz tone with a duration of 400 ms that begins at the 500-ms mark—that is, time-shifted by 500 ms. This time-shift operator is useful when arranging multiple signals in time. For example, a short, 50-ms tone beginning at 200 ms while white noise is present in the background for 500-ms is represented by the following expression:![]()
As described above, AUX employs unique syntax rules that are different from the conventions used in other programming languages, such as MATLAB. Detailed rules and conventions are presented in the following sections.
Terminology
Signal/vector
While both terms refer to a sequence (or an array) of scalar values, in this article the former implies a sound, but the latter does not. Although this distinction (auditory vs. nonauditory) is relatively arbitrary and can be flexible, it might be useful for understanding the differences between them when composing or understanding AUX expressions.
Assignment and sole expressions
An assignment expression is used to assign a signal or vector to a variable: for instance,  . A sole expression is the representation of signal without such assignment: for instance,
  .
.
Null signal/null portion
A signal is referred to as “null” if it has not been defined. As such, it has no effect during arithmetic operations. For example, in this signal,  , the null portion is from 0 to 300 ms. Note that a null signal is different from a signal with zeros (a “silence” signal), because a zero signal can be multiplied with another signal to silence out all or part of the other signal, whereas a null signal has no effect in multiplication.
AUX script
A script is one or more lines of AUX statements that represent a signal. In all examples shown below, the last statement of the AUX script refers to the signal to be generated, regardless of whether it is an assignment statement or a sole expression.
AUX user-defined function
In addition to built-in functions, AUX allows users to define their own functions, store them in a specified file path (determined by each program), and call them when necessary (see the Appendix). A user-defined function is called with input arguments to perform an intended task (such as computation or the generation of a signal), and it produces specified output arguments (such as signals or vectors), comparable to user-defined *.m functions in MATLAB.
Operators and rules in AUX
In the AUX expressions below, α and  each represent scalar values, whereas
  and
and  each represent a signal.
Rule 1—Arithmetic operators: + , -, *, and /
The arithmetic symbols (+, -, *, and /) operate on a point-wise basis; that is, values are added, subtracted, multiplied, or divided at each point of time. In a strictly mathematical sense, and in programming languages such as MATLAB, arithmetic operations on two vectors are meaningful only if vector dimension requirements are met; for example, in  ,
,  and
and  must be the same length. Arithmetic operations in AUX do not have this unwieldy constraint:
  simply means “two signals being put together.” Depending on the time windows for which
  and
and  are defined, this can be addition, concatenation with or without a silent gap, or a combination of addition and concatenation of the signals. On the other hand, the “*” operation occurs only during the intervals in which both signals are defined (examples are shown in subsequent sections).
Operations between a scalar and a signal/vector apply to the entire length of the signal/vector. For example, in  , 0.5 is a scaling coefficient, and 0.1 is a dc term.
Rule 2—Time-shift operator: >>
 indicates the signal
  time-shifted by α milliseconds. By definition, an AUX expression without the time-shift operator is considered a signal with zero shift (i.e.,
  ). Therefore, all signals in AUX are represented with explicit timing information. The use of “time-shifted” signals with arithmetic operators, discussed above, is useful when arranging multiple signals in time or applying amplitude modulation to different signals.
Rule 3—Array operations with [ ]
AUX adopts some MATLAB conventions for array operations. An array can be defined using brackets: [ ]. A sequence of values can also be represented with one or two colons (:), and the user can access parts of an array using parentheses and indices delimited by a colon. These MATLAB conventions were adopted in AUX primarily to facilitate management of vectors (nonauditory arrays), and users are discouraged from using these conventions when handling signals (auditory arrays). For example, a half-second, 440-Hz tone could be generated by manipulating an array in the following way (assuming that the intended sampling rate is 16000 Hz):![]()
Although the expression above is valid in AUX, it is not aligned with the principle of device-independent programming, since each sample is explicitly determined by the sampling rate. Instead, the following simpler and more descriptive representation is recommended:  . Similarly, while it is possible to access a portion of a signal by indices, as in MATLAB, using the extraction operator ~ with time markers (see Rule 6) is recommended, because it eliminates the burden of tracking sample indices.
Rule 4—Concatenation operator: ++
 indicates signal
  followed immediately in time by signal
  , and is equivalent to
  , where
  is a built-in AUX function that returns the duration of signal
  in milliseconds.
Rule 5—RMS scaling operator: @
The scaling operator @ is used to adjust the magnitude of a signal by specifying the desired RMS level of the signal in decibels. There are two uses of the @ operator, absolute scaling and relative scaling:

to scale the signal
 at α dB RMS relative to full scale (absolute scaling)
to scale the signal
 at α dB RMS above the signal
  (relative scaling).
In AUX, the full-scale amplitude of a signal is from 1 to −1. A signal generation function, such as  or
or  , without a scaling factor creates the signal at full scale. By definition, the RMS of a pure tone with full-scale amplitude is 0 dB. For example,
  generates the tone at full scale with an RMS of 0 dB.
Rule 6—Extraction operator: ~
 indicates the portion of signal
  between α and
  milliseconds. If
  , the extracted signal is time-reversed. For example, assuming that
  has a duration greater than 500 ms,
  is the extracted portion of the waveform from 300 to 500 ms. In general,
  is a time-reversed version of the signal (see Table 2 for the definition of the
  function).
Table 2.
Examples of built-in AUX functions for computations of signal properties or frequently used conversion

Refer to the manual on the website for the complete list of built-in AUX functions
Rule 7—Playback adjustment operator: %
The % operator changes the playback rate of the signal—for instance, modulating the pitch and increasing or decreasing the duration. For example,  is the signal with half the pitch and double the duration, and
  —or
—or  —is the signal with doubled pitch and half of the duration.
Rule 8—Stereo signal
 is a stereo signal:
  on the left channel,
  on the right channel. As with the “+” operator,
  and
and  do not need to have the same duration or time interval. Note that a semicolon is the delimiter between channels, and this should not be confused with the use of brackets for arrays, as used in MATLAB and specified in Rule 3.
  does not indicate a two-dimensional array or matrix as in MATLAB.
Rule 9—Conditional statements, logical operators, and loop control
To support programming needs, AUX provides conditional and looping control statements, such as  . The following relational or logical operators are used for logical statements:
  (conditional equal),
  (conditional not equal),
  (and), and
  (or).
(or).
Rule 10—Mathematical functions
AUX also provides mathematical functions, such as  , and the power operator ^. If the input is a vector, the output is also a vector where each element is the result of the function applied to the corresponding input element. If the input array has invalid values for the function, the corresponding output for those input values will be null. For example, negative values for the square-root function,
  , return null as output.
Rule 11—A symbol for commenting: //
The symbol // can be used to leave a comment for the user’s own reference in AUX scripts and user-defined functions.
AUX viewer
Before illustrating further examples of AUX scripts, the AUX Viewer program, running on the Windows operating system, is described in this section. All example scripts in this article can be run in AUX Viewer. This program allows the user to create, view, and play arbitrary audio signals generated with AUX scripts using a minimal GUI. The AUX script is placed in the multiline edit box, as seen in Fig. 1, and pressing the “Generate and Plot” button creates a signal window, as seen in Fig. 2. This audio signal can be played through the PC sound card by pressing the space bar. The spectrum of the signal can be seen by pressing the F4 key in this window. The “+” or “-” key on the number pad will zoom in or out of the viewing area of the signal, and the left and right arrow keys will move the viewing area accordingly. The signal displayed on the screen can be saved as a *.wav file by pressing the “/” key on the number pad. A right click of the mouse on the signal window will open a pop-up menu for the actions mentioned above.
Fig. 1.
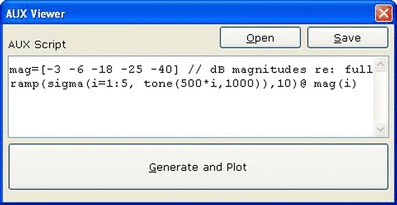
Screenshot of AUX Viewer
Fig. 2.
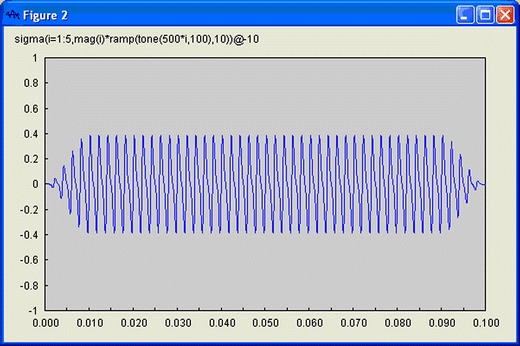
Signal displayed in AUX Viewer. The x-axis is specified in seconds. The spectrum of the signal (not shown) can be seen by pressing the F4 key in this window
Examples of AUX scripts
Several examples are included in this section to demonstrate how to use the fundamental features of AUX. These examples provide an effective illustration for beginners learning AUX and are appropriate for class demonstrations of the various signals used in psychoacoustic experiments. In AUX Viewer, multiple signal windows can be generated for comparing signals side by side. The built-in AUX functions used in these examples are displayed in Tables 1, 2 and 3 with parameter specifications and brief descriptions.
Table 3.
Examples of built-in AUX functions for signal processing

Refer to the manual on the website for the complete list of built-in AUX functions
Example 1
An illustration of the  function, the
  function, filtering, and mixing signals with specified RMS levels is below.
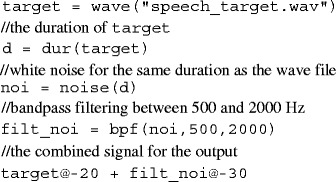
The last line indicates the speech target (from the .wav file) presented with band-pass-filtered noise of the same duration, with RMS levels of −20 and −30 dB, respectively, resulting in a signal-to-noise ratio of 10 dB.
For class demonstration, the following modifications can be made to generate different signals: varying signal-to-noise ratios, varying cutoff frequencies, or different filtering functions, such as low-pass ( ) or high-pass (
 ) filtering.
Example 2
The sigma function  is equivalent to the mathematical symbol
One use of the sigma function is to define a complex tone with desired magnitudes in decibels for harmonic components, as follows:
For class demonstration, the number of harmonics and/or the distribution of the magnitudes of harmonics can be adjusted. Complex signals with a missing fundamental frequency component, or partial components with shifted frequencies, can also be generated, and their perceptual effects can be demonstrated in the classroom.
Example 3
The sigma function with the time-shift operator >> can be used to generate an echo or reverberation effect. The  function takes an array of decibel values as input and returns an equivalent array of magnitude coefficients (cf. Rule 10).
In addition to the examples above, other examples in which the sigma function could be useful include generating a Schroeder phase tone complex (Schroeder, 1970) or iterated rippled noise (Yost, 1996).
Example 4
Mathematical manipulations of signals can be efficiently represented in AUX. A nonlinear amplitude compression using the mathematical function  , which takes only positive values and returns null otherwise, is as follows (cf. Rules 1 and 10):
![]()
Example 5
In this example of binaural hearing, the same signal is presented on both sides, but depending on the binaural delay, the sound can be perceived as a single object (fusion) with a clear lateralization or a sound with a distinct spatial echo. The precedence effect can occur with different upper limits, depending on the stimulus (Gelfand, 1998, pp. 412–416). With this example, the perceptual consequences of binaural delay can be studied using three stimuli (tone, click, and speech sound). The delay should be adjusted from less than one millisecond to tens of milliseconds.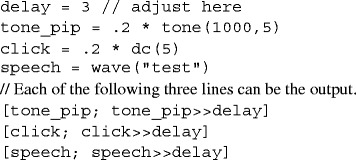
Example 6
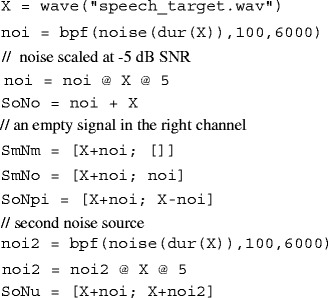
The following example illustrates binaural signals used to examine spatial release of masking or the binaural masking level difference (Gelfand, 1998, pp. 416–418).  is wideband noise between 100 and 6000 Hz. Several versions of the speech–noise mixture can be made in a binaural presentation, depending on whether the speech or noise is presented diotically or monaurally, denoted respectively by the character
  or
or  : First,
  refers to a diotic presentation of both speech and noise, mixed with −5 dB SNR in this example. Second,
  is a monaural presentation (on the left side). Speech intelligibility could be improved from these conditions in different versions of binaural presentation:
  ,
,  (where the binaural phase difference of 180º or π exists), or
  (where the noise is uncorrelated between channels). For class demonstration, the intelligibility of these binaural signals can be compared (preferably through headphones).
Example 7
This example illustrates (a) the use of the extraction operator ~ and (b) looping or conditional statements as a signal from a .wav file is analyzed and modified automatically. Suppose that a .wav file has a silent portion (or a portion of low-level background noise) in the beginning, and the user wishes to remove it. In the script below, the RMS energy of the signal is analyzed for each 50-ms segment, and the signal is trimmed until an analyzed segment exceeds −40 dB relative to full scale.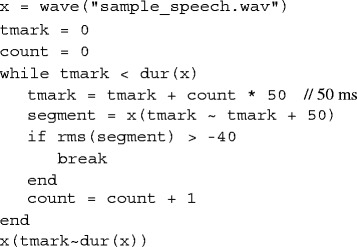
Example 8
This example illustrates how the multiplication (*) operation works. The function  generates a signal with zeros for the specified duration. This can be useful to generate an interrupted signal, as this can, when multiplied, silence out the specified duration without modifying other portions of the signal. Consider the following example demonstrating temporal induction (Dannenbring, 1976), where a short middle portion of a tone glide is replaced with noise and a continuity illusion occurs (i.e., the tone is not perceived as interrupted):
On the first line,  is a tone glide with the frequency changing from 1000 to 1500 Hz. On the second line,
  is a silence signal for 50 ms, time-shifted by 225 ms. Then
  means the tone with an interrupted interval in the middle (from 225 to 257 ms).
  is low-pass noise to be inserted into that interrupted interval.
While many features are covered in the examples thus far, a beginning user might learn and use only the features of AUX that are required for the complexity of the signals that he or she wishes to create. For example, if one needs to generate relatively simple signals, consisting of a small number of tonal and noise components, but with specific temporal arrangements or intensity relations, one needs to be familiar with basic built-in functions and operators (such as >>, ++, or @). A wide range of signals that are covered in psychoacoustic textbooks and behavioral listening tests can be created using only these language features. Finally, since this article is intended to introduce only the fundamental features of AUX, interested readers are highly encouraged to refer to the website mentioned earlier for more in-depth information, such as user-defined functions, cell arrays, and string manipulations. Some select examples of user-defined functions are included in the Appendix.
Psycon
Overview
Psycon is a Windows-based program for administering psychoacoustic experiments using multiple presentation intervals. It offers three commonly used experimental modules: adaptive procedure (Levitt, 1971), the method of constant stimuli, and the method of adjustment. A diverse range of signals can be tested in Psycon, because the signals are specified in AUX.
Structure and basic operations
Psycon supports experimental procedures in which the stimulus is presented in multiple intervals, either “standard/reference” or “odd-ball/variable,” in a random order. The subject’s task is to pick the interval with the odd-ball stimulus. Two executables are included in the program: psycon.exe and psycon_reseponse.exe. The former is for the experimenter, while the latter is for the subject. Upon presentation of the stimulus, the subject responds with a mouse click on the response screen, which can be on the same computer or on another computer connected via a network (TCP/IP). The program on the experimenter’s side, psycon.exe, administers the entire procedure: presenting the stimuli as specified in the AUX script, collecting the subject’s response, providing feedback if desired, and displaying and saving the result upon completion of the session. During the testing session, the progress of the procedure is visualized with graphs (such as the excursion of values for the adaptive procedure).
Specification of signals
Figure 3 shows a screenshot of Psycon. The signals are specified in two edit boxes labeled “Standard” and “Odd-ball.” For example, for a frequency discrimination experiment with a 1000-Hz tone, the AUX script for the standard interval is![]()
Fig. 3.
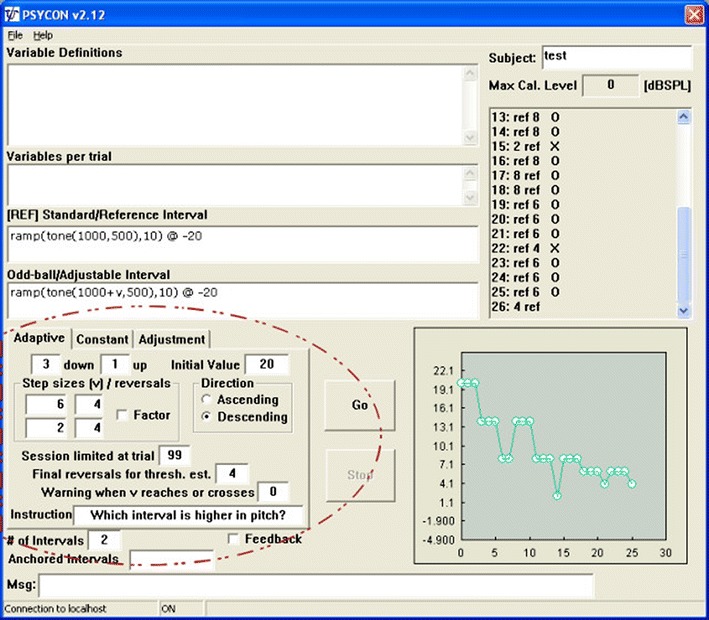
The experimenter console screen of the Psycon program, used for a wide range of psychoacoustic experiments. The signals are defined in AUX for the standard and odd-ball intervals. Additional definitions can be written in other edit boxes (“Variable Definitions” and “Variables per trial”). Currently, three experimental modules—adaptive procedure, the method of constant stimuli, and the method of adjustment—are included
and the AUX script for the odd-ball interval is![]()
Note that  is a reserved variable, specific to Psycon, that denotes the amount of adjustment (or adaptation) between trials during the procedure. In addition to the example above, the signals for other psychoacoustic experiments can be specified, as follows (the first and second statements are for the standard and odd-ball intervals, respectively):
![]()
for intensity discrimination, or![]()
for duration discrimination, or![]()
for 8-Hz amplitude modulation (AM) detection with a noise carrier.
The “Variable Definitions” box is used to define variables for complex signal generation. For example, in a forward masking experiment, detection of a short tone is measured shortly after a narrow-band noise masker is turned off. The corresponding AUX statements would be![]()
for the standard interval (masker only), and![]()
for the odd-ball interval (masker plus probe). However, note that in this case the two intervals produce different instances of noise. If the use of “frozen” noise is desired—that is, the same generation of noise in all presentations—the “Variable Definitions” box should contain the following:![]()
and the standard and odd-ball are![]()
respectively. Upon beginning the testing session, AUX statements in “Variable Definitions” are executed once, and the variables are used throughout trials. The other box, “Variables per trial,” serves a similar purpose, but AUX statements in this box are updated in each trial. Therefore, the use of this box allows presentation of “frozen” noise within each trial.
Procedure control—Adaptive
The control tab of the adaptive procedure is circled in Fig. 3. The number of responses before adjusting the stimuli up or down and the direction of adjustment are specified by the experimenter. In Fig. 3, these are set as “3 down, 1 up” and “descending,” indicating that the adjustment will be made in the direction of the decrease in the value ( ). The “Initial Value” box specifies the value that
  starts with when the testing session begins, in units implied by the AUX script used for testing. In the examples above, it could be 20 (Hz) for frequency discrimination, 6 (dB) for intensity discrimination, 100 (ms) for duration discrimination, or −10 (dB) for AM detection, and so on. Likewise, the “Step sizes” boxes indicate desired step sizes in the implied unit, along with the number of reversals for the adaptive procedure. Upon completion of all reversals, the mean of the
  values at a specified number of reversal points is calculated and presented as the result of the session.
Procedure control—Constant
In this procedure, signals are prepared with preselected values of  and presented in random order with repetition. At the completion of the testing session, the data for a psychometric function—that is, the percent scores of performance as a function of
  —are obtained. Figure 4 shows a cropped view of the control tab for the method of constant stimuli from the Psycon screen. Here, the values are specified in the “Independent variable/conditions” box, and the repeat count is indicated in the “Repeat” box. For example, if frequency differences of 1, 3, 5, and 10 Hz were to be tested for frequency discrimination, the “Independent variable” box should indicate [1 3 5 10].1
Fig. 4.
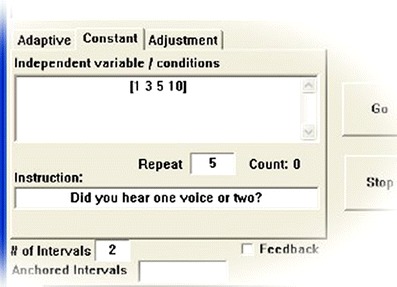
The experimenter console screen of the Psycon program, cropped to show the “Constant” tab, used for the method of constant stimuli. Values for the predefined variable  in Psycon are shown
Procedure control—Adjustment
In this procedure, a pair of stimuli are presented in the fixed order of standard and odd-ball/adjustable intervals. In each presentation, subjects adjust the second stimulus, according to the instructions they have been given. They are given adjustment buttons, two up and two down, with “big” and “small” step sizes for each direction. The subjects end the procedure by pressing the “done” button once they are satisfied that the adjustment is complete. For example, imagine an experiment to test a listener’s ability to adjust the pitch of a tone to be an octave higher than the pitch of a reference tone. The standard signal would be  , and the adjustable signal would be
  . The initial value could be somewhere close to the target 1000 Hz, but to avoid a bias, it could be specified with a random number, as seen in Fig. 5:
  , indicating a random value between 900 and 1100. The step sizes could be set to 10 and 3 for big and small steps, respectively. Then the subject is presented with the pair of tones, the first one fixed at 500 Hz and the second one adjustable by the subject.
Fig. 5.
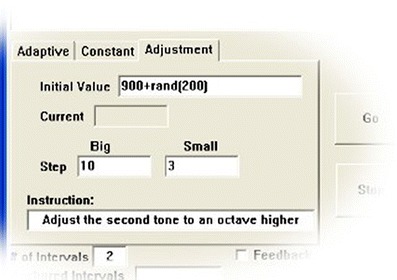
The experimenter console screen of the Psycon program, cropped to show the “Adjustment” tab, used for the method of adjustment. The initial value and step size amounts, “Big” and “Small,” are shown
Settings in common
In all three procedures, customized instructions for the subject can be used for testing sessions. The number of intervals to present and the use of feedback can also be specified. The definitions of signals and variables can be saved into a file and retrieved later from the File menu.
Decision/adjustment of the sampling rate
Although consideration of the sampling rate extends beyond the scope of AUX scripting, a sensible decision or adjustment of the sampling rate is required in actual programs using AUX, such as Psycon. For example, in order to represent a 10000-Hz tone, an AUX user may simply write it as  , but in order to generate this signal, the sampling rate must be set properly in Psycon (i.e., greater than 20000 Hz), which can be done in “Settings” under the File menu. In addition to the
  function, other functions in AUX require proper setting of the sampling rate.2
Signal calibration
Because Psycon uses the sound card in the PC, it does not provide functionality for calibration of the reference signal level, but it can generate a continuous tone for calibration purposes. The user ought to measure the output from the playback device (e.g., speakers or headphones) with this tone, which corresponds to the “full-scale level” mentioned throughout this article. The user should also be aware that the output level changes if the Windows “Volume Control” switch is adjusted, which can occur not only by the user’s explicit control, but also by any other Windows programs that control the default sound card in the PC. For this reason, the use of a dedicated sound card that is not used by other Windows programs is recommended. The “Settings” control in the File menu provides a way to designate or change the sound card for a PC with multiple sound cards.
AUX library
AUX Library provides a programming tool that allows users to create their own programs, just like AUX Viewer or Psycon. This is provided in the form of DLLs (dynamically linked libraries) with the calling convention of C. In addition, the AUX interface can be used in MATLAB through MEX (MATLAB executable), where a string input of AUX expressions (including variable definitions across multiple lines) is interpreted and the intended signal is generated. These programming tools are particularly useful to individuals who have invested significant effort or resources to develop programs for their own particular needs—for instance, a procedure with special adaptive staircase rules. They would only need to replace the signal generation routines with the codes calling AUX C Library or AUX MEX.
In the current release, both tools can be used only in the Windows environment (Windows 95 and later), since AUX was developed in Microsoft Visual C++. However, the core codes of AUX are not Microsoft-specific. Therefore, the library can be easily built for other platforms, such as Linux. The author welcomes modifications and redistributions of AUX Library for Linux under the terms of Academic Free License 3.0.
Discussion
AUX was developed to benefit psychoacoustic researchers, educators, and students by relieving them of the burden of programming in C or MATLAB that would otherwise be necessary to generate and analyze sound signals. According to the author’s own experience, most students, regardless of their training history in programming, demonstrated command of AUX after a relatively short introduction. In recent years, MATLAB has often been taught in research methods courses covering instrumentation in the curricula of experimental psychology, behavioral neuroscience, or speech–language–hearing sciences. As mentioned earlier, MATLAB is a general tool for engineering needs. Attempts to teach MATLAB to students without programming or engineering backgrounds often yield only questionable profits, despite considerable time and effort expended. AUX might be presented as an alternative.
While the device-independent representation of sounds in AUX is beneficial, in that sounds can be specified as conceptual entities, this also delineates a limit to the application of AUX. For example, AUX is not applicable when signal handling involves real-time signal processing—that is, synthesis or modification of signals by real-time analysis. C or other programming languages would be more appropriate to handle those needs. Thus, AUX, MATLAB, and C cover different scopes of demands, and AUX is not intended to replace either MATLAB or C. The convenient features that AUX offers for generation and processing of signals could be emulated with tools developed as a MATLAB toolbox or a C library. However, to the extent that issues of engineering applications are of little or no concern to the researcher, AUX can be an appropriate tool to represent sounds. In fact, it is the author’s intention that AUX will be used in environments of other programming languages when specifying sounds, which is why AUX Library was created. For example, the AUX Viewer program has been replicated to run in the MATLAB environment using AUX MEX. While AUX Viewer for MATLAB runs the same way as the original AUX Viewer, it provides an improved screen layout and greater flexibility in viewing and analyzing signals, because it is based on MATLAB graphics.
Though AUX is capable of representing a variety of sounds, as discussed in this article, AUX and the accompanying software are still works in progress. It would be an overstatement to suggest that AUX allows any conceivable signal to be specified in a simple form, because each AUX statement is still a manifestation of semimathematical and algorithmic operations. Therefore, there might be several signals that are conceptually simple but problematic to represent using simple AUX statements without specific algorithms from the user, especially if the processing involves analyses of speech sounds (e.g., the fundamental frequency or formant frequencies). While this can be handled by user-defined functions (see the Appendix), in future releases of AUX some of these functionalities might be realized through operators or built-in functions. Debugging support in AUX is another area that needs improvement. The software currently provides only limited debugging support,3 though a debugging tool is under development as part of AUX Library.
The benefits of AUX include the portability and reusability of scripts and the separation of signal definition from the software. In the context of research software development, researchers do not need to develop software for signal generation, as this can be handled by AUX. Instead, they can focus on the user interface or testing paradigm specific to their needs. Yet, signals used by one researcher can be easily shared in the research community through AUX scripts. Even if the actual program that uses the script is not shared, other researchers can easily regenerate the signals in AUX Viewer or Psycon and examine them for subsequent studies. Thus, the widespread use of AUX could ultimately promote research productivity and collaboration among researchers.
Acknowledgments
Author Note
The support was provided by NIH/NIDCD (R03DC009061) and The Ohio State University Medical Center. All due credit must go to Jae Heung Park for his improvement of author’s original source codes with yacc/lex. The author thanks Trevor Perry for developing AUX Viewer for MATLAB and for valuable comments on earlier drafts of the manuscript, John Galvin III for useful editorial comments, and the users of Psycon of earlier versions for the feedback on software features. Finally, the author expresses appreciation to Judy Dubno for her encouragement to publish this manuscript.
Open Access
This article is distributed under the terms of the Creative Commons Attribution Noncommercial License which permits any noncommercial use, distribution, and reproduction in any medium, provided the original author(s) and source are credited.
Appendix: User-defined functions
In addition to built-in functions, users can define and use customized functions, referred to as user-defined functions (UDFs). This shares the same motivation and style used in MATLAB functions that users create and save as *.m files. On the first line of a UDF is a function declaration with input and output variables, as follows:![]()
Multiple input and output variables can be declared with commas, the same way as in MATLAB. AUX expressions follow on subsequent lines, generating output variables. Unlike AUX scripts, there is no peculiar meaning attached to the last line, but the function body must include expressions to generate all output variables. This is saved as a text file. The file name must be the same as the function name with a .aux extension—for instance,  . When a function is called in an AUX-based program, if it is not one of the built-in functions, the program searches for the UDF in the specified directories and uses it if found. For example, AUX Viewer searches for UDFs in the same directory as the program directory (where auxgv.exe is located). In Psycon, one or more paths can be specified as UDF directories in “Settings” under the File menu.
In the script of Example 6, on the first line the speech signal is read from a .wav file, and the last line is the resulting signal. This script can be turned into a UDF by changing the first and last lines, as follows: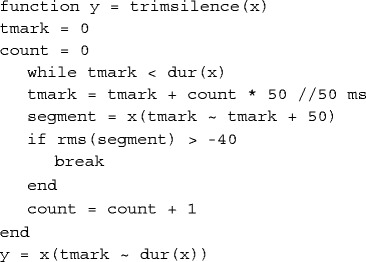
Once this is saved as  in the program directory of AUX Viewer, this UDF is ready for use, and the user can simply type the following script in AUX Viewer.
![]()
Use of UDFs results in efficient coding, because it facilitates modularization of work flow. For example, trimming out the silent portion at the end of the waveform can be done by a subsequent call in the script to  with a time-reversed version.
When using UDFs with broad or generalized applications, the user might need to consider modifying the structure of the UDF to allow for more inputs (e.g., the criterion for the silence, –40 dB below full scale, could be given as the second argument). AUX checks the expressions in a UDF and properly alerts users to syntax errors, but the author of the UDF should check for logic and control flow errors. For further information and additional UDF examples, readers should refer to the documents on the website.
Footnotes
This bracket notation also supports the use of a colon (:), the MATLAB-style expression.
In addition, users should be mindful of the effect of sampling rate when using the  function. In actual AUX-based programs, it opens the .wav file and resamples it to the chosen sampling rate in the current program, if is not already sampled at that rate. Careful consideration of the sampling rate is needed to ensure that the desired spectral information is retained during the resampling process. From a purist’s view, the
  function is a violation of the device-independence principle, since a .wav file already includes information about the implementation (the sampling rate). This function was included in AUX as a realistic consideration, and for convenience’s sake.
Current tools for debugging AUX code are relatively crude. Users can debug their AUX scripts or user-defined functions either by displaying intermediate results of values on the screen with a  function or by successively saving the intermediate results in the file with
  .
.
References
- Boersma, P., & Weenink, D. (2010). Praat: Doing phonetics by computer [Software]. Retrieved July 1, 2010, from www.fon.hum.uva.nl/praat/
- Dannenbring GL. Perceived auditory continuity with alternately rising and falling frequency transitions. Canadian Journal of Psychology. 1976;30:99–114. doi: 10.1037/h0082053. [DOI] [PubMed] [Google Scholar]
- Forster KI, Forster JC. DMDX: A Windows display program with millisecond accuracy. Behavior Research Methods, Instruments, & Computers. 2003;35:116–124. doi: 10.3758/BF03195503. [DOI] [PubMed] [Google Scholar]
- Francart T, van Wieringen A, Wouters J. APEX 3: A multi-purpose test platform for auditory psychophysical experiments. Journal of Neuroscience Methods. 2008;172:283–293. doi: 10.1016/j.jneumeth.2008.04.020. [DOI] [PubMed] [Google Scholar]
- Gelfand SA. Hearing an introduction to psychological and physiological acoustics. New York: Dekker; 1998. [Google Scholar]
- Hillenbrand JM, Gayvert RT. Open source software for experiment design and control. Journal of Speech, Language, and Hearing Research. 2005;48:45–60. doi: 10.1044/1092-4388(2005/005). [DOI] [PubMed] [Google Scholar]
- Levitt H. Transformed up-down methods in psychoacoustics. Journal of the Acoustical Society of America. 1971;49(2):467–477. doi: 10.1121/1.1912375. [DOI] [PubMed] [Google Scholar]
- López-Bascuas LE, Carrero Marín C, Serradilla García FJ. A software tool for auditory and speech perception experimentation. Behavior Research Methods, Instruments, & Computers. 1999;31:334–340. doi: 10.3758/BF03207729. [DOI] [PubMed] [Google Scholar]
- Schroeder M. Synthesis of low-peak-factor signals and binary sequences with low autocorrelation [Letter] IEEE Transactions on Information Theory. 1970;16:85–89. doi: 10.1109/TIT.1970.1054411. [DOI] [Google Scholar]
- Yost WA. Pitch of iterated rippled noise. Journal of the Acoustical Society of America. 1996;100:511–518. doi: 10.1121/1.415873. [DOI] [PubMed] [Google Scholar]


